
Market Overview
| Study Period | 2020 - 2031 |
|---|---|
| Forecast Data Period | 2026 - 2031 |
| Base Year Market Size (2025) | USD 284.43 Billion |
| Market Size (2026) | USD 292.59 Billion |
| Market Size (2031) | USD 336.86 Billion |
| Growth Rate (2026 - 2031) | 2.87 % |
| Market Concentration | Low |
Major Players *Disclaimer: Major Players sorted in no particular order Image © Mordor Intelligence. Reuse requires attribution under CC BY 4.0. | |
North America REIT Industry Analysis by Mordor Intelligence
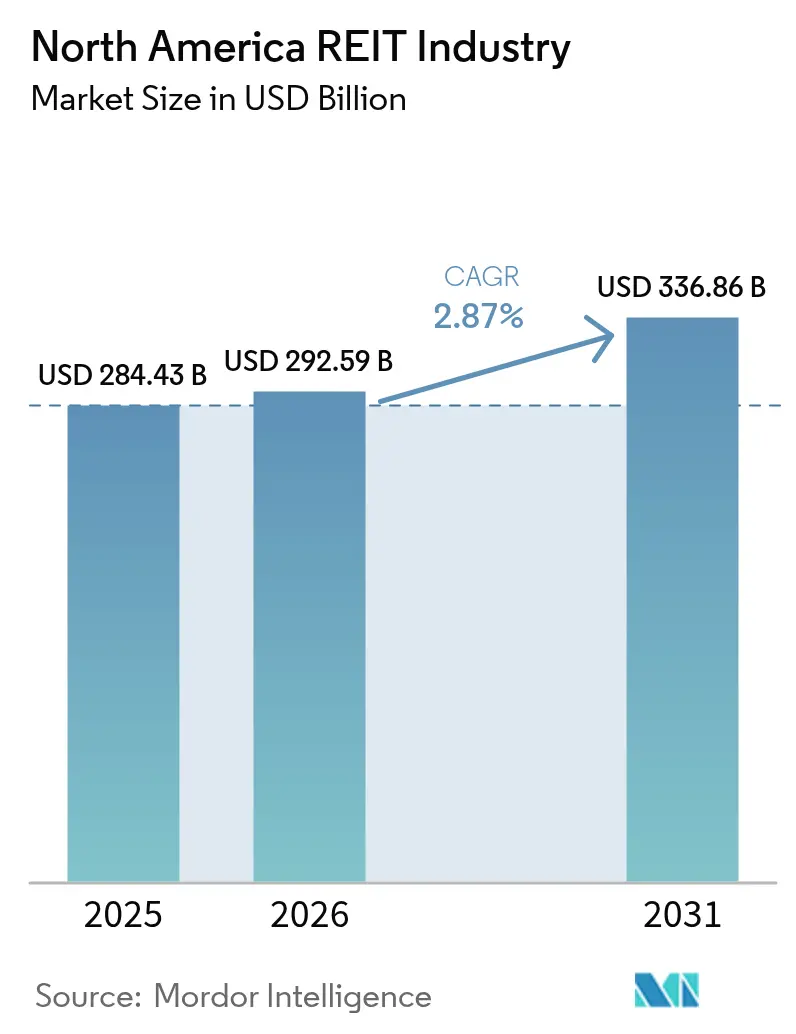
The North America REIT Industry market size in 2026 is estimated at USD 292.59 billion, growing from 2025 value of USD 284.43 billion with 2031 projections showing USD 336.86 billion, growing at 2.87% CAGR over 2026-2031.
Sustained growth reflects the sector’s maturity, supportive monetary policy expectations, and a balanced exposure to industrial, residential, and technology-linked real estate. Industrial REITs remain the largest allocation, residential platforms record the fastest expansion, and data-center operators benefit from persistent digital-infrastructure demand. Fundraising pipelines have reopened as investors anticipate lower policy rates, even though refinancing risks tied to commercial mortgage-backed securities (CMBS) remain elevated. Portfolio managers respond by rotating capital away from challenged office assets toward last-mile logistics, single-family rentals, and hyperscale data centers, while hybrid REIT structures gain attention for their flexibility in deploying both equity and debt capital.
Key Report Takeaways
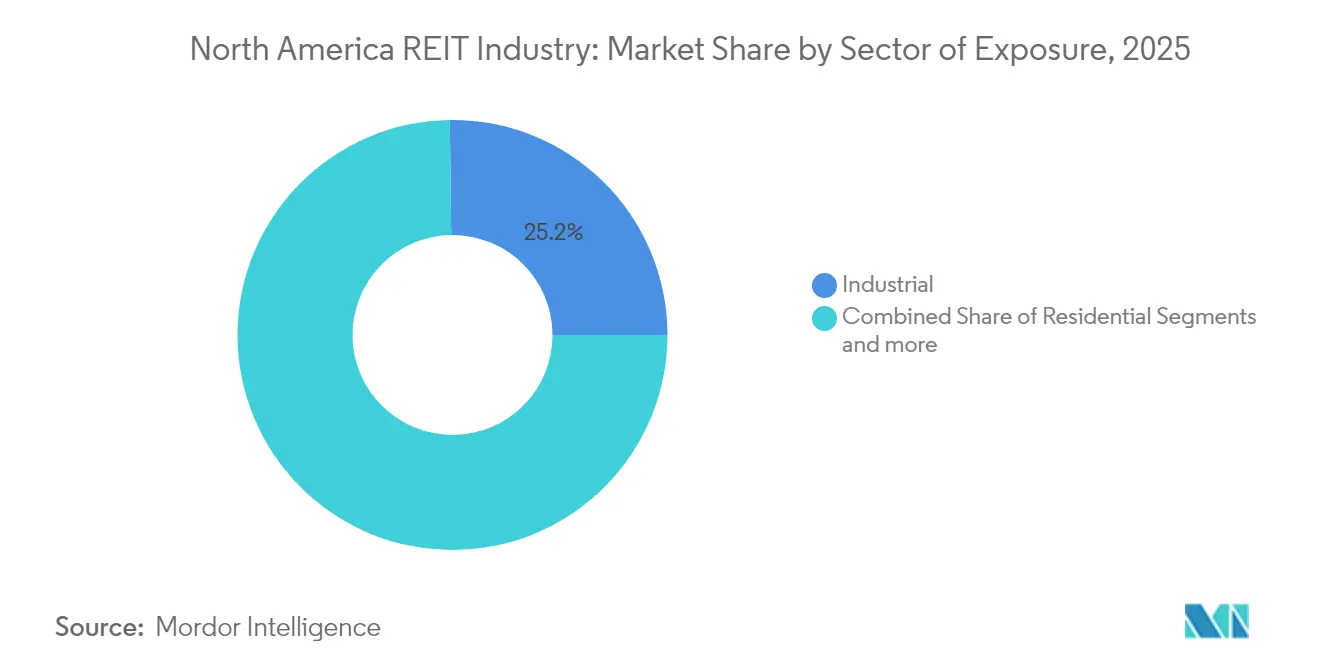
- By sector of exposure, industrial REITs led with 25.20% North America REIT market share in 2025, while residential REITs are forecast to expand at a 5.05% CAGR to 2031.
- By REIT structure, equity vehicles held 86.20% of the total market capitalization of the North America REIT market in 2025; hybrid structures record the highest projected CAGR at 3.62% through 2031.
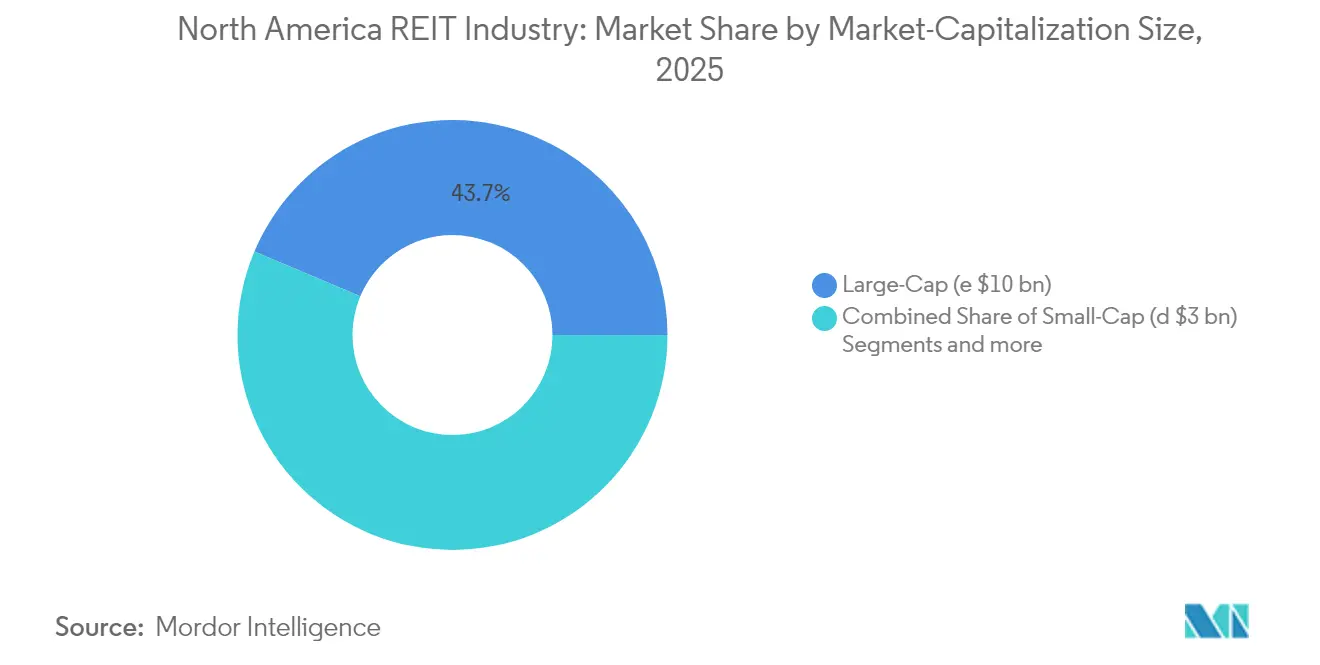
- By market-capitalization size, large-cap platforms accounted for 43.65% of the North America REIT market size in 2025, yet small-cap operators carry a 4.45% CAGR outlook to 2031.
- By country, United States entities controlled 90.15% of the North America REIT market in 2025, whereas Mexico is advancing at a 5.62% CAGR on the strength of nearshoring-driven industrial demand.
Note: Market size and forecast figures in this report are generated using Mordor Intelligence’s proprietary estimation framework, updated with the latest available data and insights as of 2026.
Market Trends and Insights
Drivers Impact Analysis of North America REIT Industry*
| Driver | (~) % Impact on CAGR Forecast | Geographic Relevance | Impact Timeline |
|---|---|---|---|
| Fed rate-cut expectations reinvigorating fundraising pipelines | +0.8% | North America | Short term (≤ 2 years) |
| Demand surge for last-mile logistics assets | +0.6% | US core markets, Canada urban centers | Medium term (2-4 years) |
| AI-led hyperscale data-center absorption | +0.5% | Northern Virginia, Texas, California | Long term (≥ 4 years) |
| Resilient rent growth in single-family rental portfolios | +0.4% | US Sunbelt, select Canadian markets | Medium term (2-4 years) |
| Institutional capital rotation from office to alternative sectors | +0.3% | North America | Medium term (2-4 years) |
| Tokenization of fractional REIT units on blockchain exchanges | +0.2% | Global, early adoption in North America | Long term (≥ 4 years) |
| Source: Mordor Intelligence | |||
Fed Rate-Cut Expectations Reinvigorating Fundraising Pipelines
Monetary policy easing forecasts lower borrowing costs, improving net operating income margins for leveraged platforms. Equity issuance volumes rose markedly in late 2024, unlocking capital for development and acquisitions. The USD 150.9 billion CMBS maturity wall scheduled for 2025 poses risk for highly leveraged peers but offers well-capitalized REITs discounted buying opportunities [1]. Issuers with strong balance sheets can refinance or opportunistically acquire assets before wider market repricing sets in. The policy backdrop, therefore, acts as both a catalyst and a filter, rewarding disciplined capital allocators.
Demand Surge for Last-Mile Logistics Assets
In 2024, e-commerce was responsible for over half of the growth in US retail sales, driving significant changes in fulfillment strategies. Companies are prioritizing facilities located near densely populated consumer areas, with urban infill warehouses achieving rental rates 15% higher than traditional distribution centers. Despite residual excess capacity from pandemic-era expansions, inventory restocking initiatives and supply-chain resilience programs are fueling additional demand. Prologis research projects a requirement for an extra 250–350 million sq ft of logistics space by 2030 to meet these evolving needs [2]. Real estate investment trusts (REITs) with zoning entitlements in land-constrained metropolitan markets are leveraging their strategic positioning to maintain pricing power. These portfolios are also benefiting from consistently high occupancy rates, reflecting the growing demand for well-located logistics facilities.
AI-Led Hyperscale Data-Center Absorption
The growing demand for high-density server halls, driven by artificial intelligence workloads, is significantly increasing power requirements and placing immense pressure on regional electricity grids. Major data center markets, including Northern Virginia, Dallas, and Silicon Valley, are experiencing extended delays, with multi-year waitlists for utility interconnections becoming a widespread issue. Operators with legacy power contracts and strategically located land are capitalizing on their advantageous positions by pre-leasing capacity at premium rates, thereby strengthening their market standing. Joint-venture investments, such as Equinix’s USD 15 billion hyperscale program, are enabling rapid expansion to address the surging demand for data center infrastructure [3]. However, grid constraints are not only creating operational challenges but are also raising substantial barriers to entry for new players. These limitations are further consolidating the competitive advantage of established operators in the market.
Institutional Capital Rotation from Office to Alternative Sectors
In 2024, the national office vacancy rate rose to 1.9%, driving capital allocators to focus on data centers, life-science laboratories, and self-storage facilities. Non-office asset classes now constitute 60% of the total market capitalization of public Real Estate Investment Trusts (REITs) [4]. The valuation disparity between sectors has grown, with alternative-sector REITs trading at or above their net-asset values while office-focused REITs continue to trade at significant discounts. Canadian pension funds, which have historically been among the largest investors in the US real estate market, are shifting their investment strategies. These funds are increasingly prioritizing healthcare and logistics properties over traditional office buildings. This trend underscores a broader reallocation of capital within the real estate market, reflecting changing investor preferences and market dynamics.
Restraints Impact Analysis of North America REIT Industry*
| Restraint | (~) % Impact on CAGR Forecast | Geographic Relevance | Impact Timeline |
|---|---|---|---|
| Elevated refinancing wall amid tapering CMBS appetites | -0.7% | North America | Short term (≤ 2 years) |
| Work-from-home pressure on CBD office occupancy | -0.5% | Major metropolitan areas | Medium term (2-4 years) |
| Legislative scrutiny of housing REIT rent escalations | -0.3% | US federal and state levels | Medium term (2-4 years) |
| Grid-capacity bottlenecks are delaying data-center developments | -0.2% | Northern Virginia, Texas, California | Long term (≥ 4 years) |
| Source: Mordor Intelligence | |||
Elevated Refinancing Wall Amid Tapering CMBS Appetites
Commercial mortgage-backed securities (CMBS) investors are pushing for wider credit spreads, which is reducing loan proceeds and increasing refinancing costs for maturing loans. Approximately USD 4.70 trillion in commercial real estate debt is expected to require refinancing by 2028, heightening the risk of financial distress for highly leveraged office and retail properties. Real estate investment trusts (REITs) with investment-grade credit ratings and staggered debt maturities are better positioned to manage these challenges. However, REITs that rely heavily on floating-rate debt are likely to face significant financial pressure. These entities may need to resort to issuing dilutive equity or selling assets to meet their obligations. The refinancing wave underscores the growing divide between financially stable REITs and those with weaker balance sheets.
Work-From-Home Pressure on CBD Office Occupancy
Structural vacancies in legacy downtown towers are rising as permanent hybrid work arrangements continue to influence tenant behavior. Businesses are increasingly seeking energy-efficient and amenity-rich spaces, leaving class B and C buildings struggling to remain competitive. This shift is driving shorter lease terms and higher concessions, which are negatively impacting net operating income. Although headline rents are showing signs of stabilization, property owners are still facing financial challenges. The elevated costs of asset repositioning or converting buildings for residential purposes are further delaying recovery efforts. These trends highlight the necessity for strategic investments to align with changing market demands.
*Our forecasts treat driver/restraint impacts as directional, not additive. The impact forecasts reflect baseline growth, mix effects, and variable interactions.
North America REIT Industry Segment Analysis
By Sector of Exposure:
Industrial Leadership Drives AllocationIndustrial facilities captured 25.20% of the North America REIT market share in 2025. The segment benefits from resilient supply-chain re-engineering, e-commerce fulfilment, and reshoring that lift warehouse absorption in port-proximate and inland hubs. Vacancy rates in tier-one logistics corridors have remained below 4% since 2023, underpinning rent growth outperformance. Capital recycling focuses on acquiring infill last-mile assets even at compressed yields, reflecting confidence in long-term demand durability. Data-center, healthcare, and self-storage niches continue to draw incremental capital, yet industrial remains the anchor allocation for diversified portfolios.
Residential REITs post the fastest expansion at a 5.05% CAGR through 2031, propelled by affordability constraints, rising household formation in the Sunbelt, and demographic aging bolstering senior housing. The North America REIT market size for residential platforms is projected to advance faster than any other property type as build-to-rent pipelines grow. Occupancy above 95% and steady same-property rent gains support dividend visibility. Legislative oversight poses a medium-term risk, though diversified rent affordability programs help sustain community engagement. Retail and office allocations remain under strategic review, with necessity-based retail holding steady while discretionary apparel centers lag footfall recovery.

By REIT Structure:
Equity Dominance with Hybrid InnovationEquity vehicles controlled 86.20% of capitalization in 2025, offering investors transparent ownership of physical assets and inflation-hedged cash flows. Tax-advantaged status underpins stable dividend policies, attracting long-only funds seeking yield replacement relative to fixed income. The North American REIT market continues to favor equity formats for their alignment with direct real-estate fundamentals. Hybrid REITs, blending property ownership with structured lending, post a 3.62% CAGR as sponsors monetize underwriting expertise during credit cycles. Mortgage-only REITs remain a minority, navigating spread volatility and stricter risk-retention standards.
Hybrid strategies enable businesses to diversify revenue streams, mitigate earnings volatility, and enhance flexibility in capital allocation. Prominent examples include platforms integrating data-center development with preferred-equity investments or combining net-lease acquisition pipelines with mezzanine loan support. These approaches are helping to bridge historical valuation gaps between hybrid strategies and traditional equity investments as investor awareness improves. The narrowing of these valuation discounts reflects a growing understanding of the benefits offered by hybrid models. However, achieving broader inclusion in major indices requires companies to maintain high standards of governance transparency. Additionally, a well-structured and clear balance sheet remains a critical prerequisite for such inclusion.
By Market-Capitalization Size:
Large-Cap Stability versus Small-Cap UpsideIn 2025, large-cap entities represented 43.65% of market capitalization, leveraging their liquidity advantages and extensive index inclusion. Their operational scale enables cost efficiencies in procurement, access to favorable debt terms, and geographic diversification, which collectively support stable dividend distributions. These entities dominate the North American REIT market, offering defensive investment characteristics that appeal to institutional investors such as pension funds and sovereign wealth funds. Their ability to maintain consistent performance underpins their attractiveness to risk-averse investors seeking reliable returns. Mid-cap REITs, in contrast, provide a blend of growth potential and yield, often focusing on specialized segments like medical office spaces or manufactured housing. This strategic focus allows mid-caps to cater to niche demands while balancing risk and return for investors.
Small-cap REITs are forecasted to grow at a 4.45% CAGR through 2031, driven by specialist managers who reposition underperforming assets and explore untapped geographic markets. These entities often trade at valuation discounts relative to their net-asset value, primarily due to limited analyst coverage, which creates opportunities for potential re-rating. Their smaller scale and focused strategies make them attractive targets for acquisition by larger peers, highlighting ongoing consolidation trends in the market. This dynamic provides small-cap REITs with an additional pathway for value realization, enhancing their appeal to investors. The segmentation of REITs by size offers a diverse range of risk-return profiles, enabling investors to align their portfolios with specific strategic objectives. Overall, the size-based segmentation reflects the varying growth trajectories and investment opportunities across the REIT market.
Geography Analysis
United States REIT Industry
The United States anchors the North American REIT market with a 90.15% share and a 2.85% CAGR outlook through 2031. Regulatory clarity, broad tenant demand, and robust public equity liquidity continue to attract domestic and offshore investors. Industrial hubs in Dallas-Fort Worth, Los Angeles, and Atlanta enjoy low vacancies, while Sunbelt multifamily assets benefit from in-migration. Federal tax rules and well-established REIT governance codes further reinforce the country’s dominance. Yet the USD 150.9 billion CMBS maturity cliff in 2025 signals heightened refinancing vigilance across all property types.
Mexico REIT Industry
Mexico records the fastest 5.62% CAGR thanks to supply-chain realignment that channels manufacturing toward cost-effective, US-proximate industrial parks. FIBRA vehicles have capitalized on this trend by expanding portfolios near Monterrey and Tijuana and by pre-leasing space to automotive and electronics tenants. Peso strength relative to the US dollar enhances effective rental growth when translated for foreign investors. Government infrastructure spending on highways and ports supports ongoing expansion. Currency volatility and distinct regulatory frameworks nonetheless require specialized asset-management capabilities.
Canada REIT Industry
Canada offers diversification through exposure to Toronto and Vancouver multifamily, Calgary energy-linked offices, and Montréal tech-enabled industrial parks. Currency movements historically act as a hedge against US dollar shifts, stabilizing total returns. Development is constrained by limited zoned land and lengthy entitlement processes, supporting rent growth even in slower GDP cycles. Foreign-buyer taxes and transaction-cost frictions persist but have not deterred pension funds from maintaining significant domestic allocations. The combined regional profile allows portfolio managers to blend high-growth Mexican assets with stable US and Canadian cash-flow streams within the North America REIT market.
Regulatory Landscape
North American REITs operate under securities, tax, and listing frameworks that influence capital formation and ongoing disclosure. In the United States, the Securities and Exchange Commission (SEC) regulates registered offerings and periodic reporting, while REIT qualification and compliance are administered through the Internal Revenue Service (IRS), including the Form 1120-REIT filing regime. A 2026 compliance shift is the IRS enabling electronic filing for Form 1120-REIT, which reduces administrative friction for larger filers and service providers running scaled tax workflows.
Cross-border capital and ownership structures remain a recurring focus for tax interpretation and policymaking. The IRS and U.S. Treasury issued final regulations on April 24, 2024 on the domestically controlled REIT qualification test (including a C corporation look-through construct). Treasury later proposed changes in October 2025 that would reverse course by repealing the look-through rule, adding additional structuring and diligence considerations for transactions involving foreign capital. In Canada, the Department of Finance has advanced updates to Income Tax Act definitions tied to qualified REIT property and qualified investment, with enforcement scheduled for taxation years beginning in 2027 and certain provisions applicable to the 2026 tax year. That timing is driving compliance planning for Canadian REIT portfolios and advisors.
Value Chain Analysis
The North America REIT value chain starts with capital sourcing from retail and institutional investors, including pensions, insurers, and sovereigns, through listed equity, follow-on offerings, and debt markets. Capital then flows to REIT sponsors and management platforms that underwrite, acquire, develop, and operate income-producing real estate. Core operating nodes include origination and transaction execution (brokers, lenders, legal, and valuation) as well as development and construction (general contractors and specialty trades), followed by property operations (property management, leasing, facilities, energy management, and tenant experience). For sector specialists, the chain expands into tenant-aligned capabilities, such as logistics-ready facilities and site optionality for industrial REITs supporting tenant supply-chain resilience.
Downstream, earnings quality and the ability to access external growth hinge on asset management discipline, including capital recycling, redevelopment, and balance-sheet management, along with governance and reporting to public-market stakeholders. Distribution through exchanges and index inclusion broadens investor access, while bottlenecks increasingly sit outside the traditional financial chain. Entitlement timelines and construction inputs can delay new development, and utility interconnection and grid capacity constraints can push back power-intensive projects such as data centers. The service-provider layer also supports scale, including transfer agents, custodians, auditors, and tax advisors, whose processes are directly affected by regulatory changes such as the 2026 move to electronic filing for IRS Form 1120-REIT.
Competitive Landscape
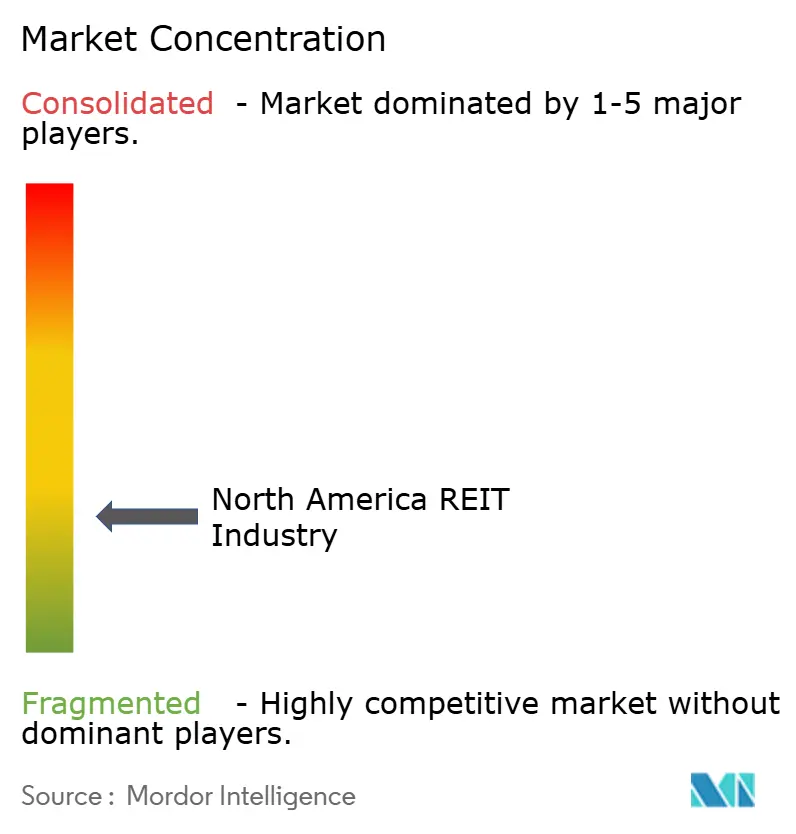
The North America REIT market remains moderately fragmented, with the five largest platforms controlling one-third of capitalization. Diversification by property type and geography lowers direct rivalry, yet competition intensifies within high-growth niches such as data centers and single-family rentals. Operators with investment-grade balance sheets can access unsecured debt at significantly tighter spreads compared to their high-yield counterparts, providing them with a competitive edge in acquisitions during periods of credit stress. Technology deployment in leasing analytics, energy management, and tenant engagement differentiates performance, particularly where AI-based tools optimize portfolio decisions.
Strategic transactions highlight scale benefits. Healthpeak Properties merged with Physicians Realty Trust to create a medical-office leader, while Blackstone’s acquisition of Retail Opportunity Investments Corp shows private-equity support for well-located necessity retail. Realty Income’s creation of a private core-plus fund expands fee revenue and deepens institutional relationships. Capital-raising innovations include green bonds tied to LEED-certified developments and pilot blockchain tokenizations that broaden investor reach. Competitive positioning, therefore, hinges on capital access, technology adoption, and disciplined portfolio rotation within the evolving North America REIT market.
North America REIT Market Leaders
-
Prologis Inc.
-
American Tower Corporation
-
Equinix Inc.
-
Crown Castle Inc.
-
Simon Property Group Inc.
- *Disclaimer: Major Players sorted in no particular order
North America REIT Industry Companies Covered in this Report
- Prologis Inc.
- American Tower Corporation
- Equinix Inc.
- Crown Castle Inc.
- Simon Property Group Inc.
- Public Storage
- Welltower Inc.
- Digital Realty Trust
- Realty Income Corporation
- AvalonBay Communities
- VICI Properties
- Invitation Homes
- Camden Property Trust
- Extra Space Storage
- Sun Communities
- Alexandria Real Estate Equities
- Healthpeak Properties
- Ventas Inc.
- Iron Mountain Inc.
- CubeSmart
- Boston Properties
Market Opportunities and Future Outlook
Capital formation and operating-model modernization are creating defined whitespace across the North America REIT ecosystem. Nareit launched its PropTech and Innovation Partnership pilot program in May 2026, with Fifth Dimension as an inaugural participant, to provide a structured channel for REITs to test and adopt technologies aimed at improving leasing efficiency, building operations, and data integration. This also fits the observed shift from isolated AI pilots toward enterprise implementations, where REITs invest in data governance and systems integration to build a trusted data layer across property, finance, and operations.
Sector positioning continues to shape where incremental investment effort concentrates, with industrial and data-center platforms receiving strategic emphasis due to e-commerce logistics needs and AI-led hyperscale infrastructure demand. At the same time, refinancing pressure and a sizable maturity wall in commercial real estate debt keep attention on balance-sheet strength and capital recycling, supporting deal activity for well-capitalized platforms when sellers face constrained refinancing. Geography-linked whitespace also remains visible in nearshoring corridors: Mexico-focused industrial vehicles (FIBRAs) keep building around manufacturing and logistics hubs near Monterrey and Tijuana, while US logistics markets such as Dallas-Fort Worth and Atlanta continue to draw investor and tenant focus.
Recent Industry Developments in North America REIT Industry
- July 2026: Prologis announced its third proposal to acquire SEGRO plc, introducing a partial cash alternative of up to GBP 2.7 billion alongside the share offer. This approach indicates an attempt to combine two major logistics platforms, with potential implications for portfolio scale, development pipelines, and capital access across core distribution markets.
- March 2026: Prologis formed a USD 1.6 billion joint venture with GIC to develop and own build-to-suit logistics facilities across major US markets. The partnership expands Prologis Strategic Capital-style fee and investment channels while funding new logistics supply tied to large-tenant requirements.
- June 2025: Realty Income introduced a private core-plus real-estate fund aimed at institutional investors seeking access to its net-lease acquisition pipeline. The vehicle broadened Realty Income’s capital stack and added a fee-based earnings lever that complements public-market funding.
North America REIT Industry Report Scope and Research Methodology
Market Definition and Coverage
For this study, the North America REIT market is defined as the value of listed and tracked REIT activity across the United States, Canada, and Mexico, captured across equity, mortgage, and hybrid REIT structures based on their investable real estate exposure.
Scope exclusions: Private real estate funds, direct property transaction values, and non-REIT operating real estate businesses are excluded from this market sizing.
Segments Covered in This Report
- By Sector of Exposure
- Retail
- Industrial
- Office
- Residential
- Diversified
- Other Sectors
- By REIT Structure
- Equity REITs
- Mortgage REITs
- Hybrid REITs
- By Market-Capitalization Size
- Large-Cap (≥ US $10 bn)
- Mid-Cap (US $3–10 bn)
- Small-Cap (≤ US $3 bn)
- By Country
- United States
- Canada
- Mexico
Data Sources, Market Sizing, and Validation
Desk Research
Desk research was used to set the market boundary and to anchor the model with repeatable public data points. We referenced sources such as NAREIT, U.S. SEC filings, U.S. Bureau of Economic Analysis (National Income and Product Accounts), U.S. Census Bureau construction and housing series, and Statistics Canada releases, which help explain property cycle signals and income flows that influence REIT performance.
Along with these, annual reports, investor presentations, exchange fact sheets, and reputable business press were reviewed to understand sector exposure shifts (for example, industrial and data infrastructure) and to sanity check timing of major corporate actions that can distort a single-year comparison. Select paid database subscriptions were used for company financials and news screening, and for patent lookups where technology-linked property themes were relevant. The desk research sources listed here are illustrative, and many other public sources were also used for data collection, validation, and clarification.
Primary Interviews and Surveys
Primary work focused on validating assumptions that desk research does not fully explain, especially around capitalization rates, sector rotation, and how REIT managers are positioning portfolios for rate changes. We spoke with a mix of REIT executives, portfolio and research roles, brokers, and lenders across the United States, Canada, and Mexico, and then used follow-up checks to confirm what was changing versus what was temporary.
Distribution of primary research fieldwork respondents
| Company type | Respondent position |
|---|---|
| Top tier: 34% | CXOs: 17% |
| Mid tier: 48% | Functional/Unit leaders: 35% |
| Smaller Players: 18% | Managers: 48% |
Market-Sizing & Forecasting
Market sizing was first built from a top-down model where listed REIT market totals are reconstructed through geography filters, REIT structure splits (equity, mortgage, hybrid), and sector exposure mapping, and then tied back to consistent financial line items. To keep the totals realistic, selective bottom-up approximations were used, such as sampled roll-ups of large and mid-cap REIT financials, and a volume times average valuation proxy for smaller coverage areas where disclosures can be thinner.
Inputs that were treated as key fingerprints included REIT market-cap and float trends, sector allocation changes (industrial, office, retail, residential, diversified, and other sectors), interest rate path and refinancing windows, occupancy and rent growth direction, and dividend payout behavior that signals cash flow health. Where bottom-up coverage had gaps, we filled them using peer-group ratios and exchange-level aggregates, and then checked that the implied results did not break basic sector math across the North America set.
For forecasting, scenario analysis was used, since REIT outcomes can swing based on rates and property cycle assumptions. The scenarios were anchored on a base case for rate normalization, cap rate movement, and sector-level demand, which were reviewed with primary respondents so the growth path stayed aligned with what investors and operators were planning for.
Data Validation & Update Cycle
Validation was done through a set of cross-checks so the final totals did not rely on one data stream. We compared modeled outputs with independent signals such as index-level REIT performance trends, aggregate market-cap movement, sector exposure shifts, and major corporate actions that can move the market size in a short period.
Anomalies were flagged when implied growth, sector shares, or valuation changes moved outside what public filings and interview feedback could explain, and those cases were reviewed again before sign-off. The report is refreshed annually, with interim updates when material events occur, and a final pre-release pass is completed so clients receive the latest updated view.
Mordor Intelligence's North America Reit Market Size Compared Against Other Published Estimates
Published market size numbers for North America REITs can vary, even when they look like they are describing the same thing, because the boundaries and measurement choices are not always aligned. Differences in whether the value reflects market capitalization, assets under management style totals, or a blended approach are usually the biggest reasons the figures spread.
By tracking sector exposure mixes, refreshing currency timing, and checking REIT-type classification rules, Mordor Intelligence keeps the estimate tied to equity, mortgage, and hybrid REIT coverage in North America rather than drifting into broader real estate totals. Other estimates may also apply different base case assumptions on rate cuts, cap rate compression, or office recovery timing, which can lift or suppress the stated market value for the same year.
Benchmark comparison
| Source | Market Size | Gaps in Research Methodology |
|---|---|---|
| Mordor Intelligence | USD 292.59 B (2026) | |
| Industry Association A | USD 305.40 B (2026) | Uses a broader listed real estate bucket that can blend REITs with real estate operating companies, and it relies more on market-cap snapshots without consistently separating equity versus mortgage REIT exposures. |
| Global Consultancy B | USD 271.80 B (2026) | Applies a more conservative rate and valuation scenario and trims smaller REIT coverage through stricter liquidity screens, which reduces the implied total even if the sector splits look similar. |
The comparison shows that the spread is mainly explained by classification choices and macro assumptions, not by arithmetic mistakes. When scope is held to REIT structures and sector exposure, and the year timing is kept consistent, the model stays traceable to clear inputs that can be reviewed and repeated.
Key Questions Answered in the Report
What is the current size of the North America REIT market?
The market is valued at USD 292.59 billion in 2026 and is forecast to reach USD 336.86 billion by 2031.
Which sector holds the largest share in the North America REIT market?
Industrial assets lead with 25.20% market share in 2025, reflecting strong e-commerce and supply-chain demand.
Which segment is growing fastest within the North America REIT market?
Residential REITs post the fastest 5.05% CAGR outlook, driven by housing affordability challenges and build-to-rent development.
How does monetary policy influence the North American REIT market growth?
Anticipated Federal Reserve rate cuts reduce borrowing costs, revive equity issuance, and support acquisition pipelines, adding an estimated 0.8% to forecast CAGR.
Why are data-center REITs attracting investor interest?
AI-related workloads are doubling energy demand, and operators with secured power contracts can pre-lease space at premium rates, creating strong cash-flow visibility.
Which geography outside the United States shows the strongest REIT growth?
Mexico advances at a 5.62% CAGR through 2031 as nearshoring drives industrial leasing along key manufacturing corridors.