
Market Overview
| Study Period | 2020 - 2031 |
|---|---|
| Forecast Data Period | 2026 - 2031 |
| Base Year Market Size (2025) | USD 21.77 Billion |
| Market Size (2026) | USD 23.57 Billion |
| Market Size (2031) | USD 35.03 Billion |
| Growth Rate (2026 - 2031) | 8.25 % |
| Market Concentration | High |
Major Players *Disclaimer: Major Players sorted in no particular order Image © Mordor Intelligence. Reuse requires attribution under CC BY 4.0. | |
North America Recreational Vehicle Market Analysis by Mordor Intelligence
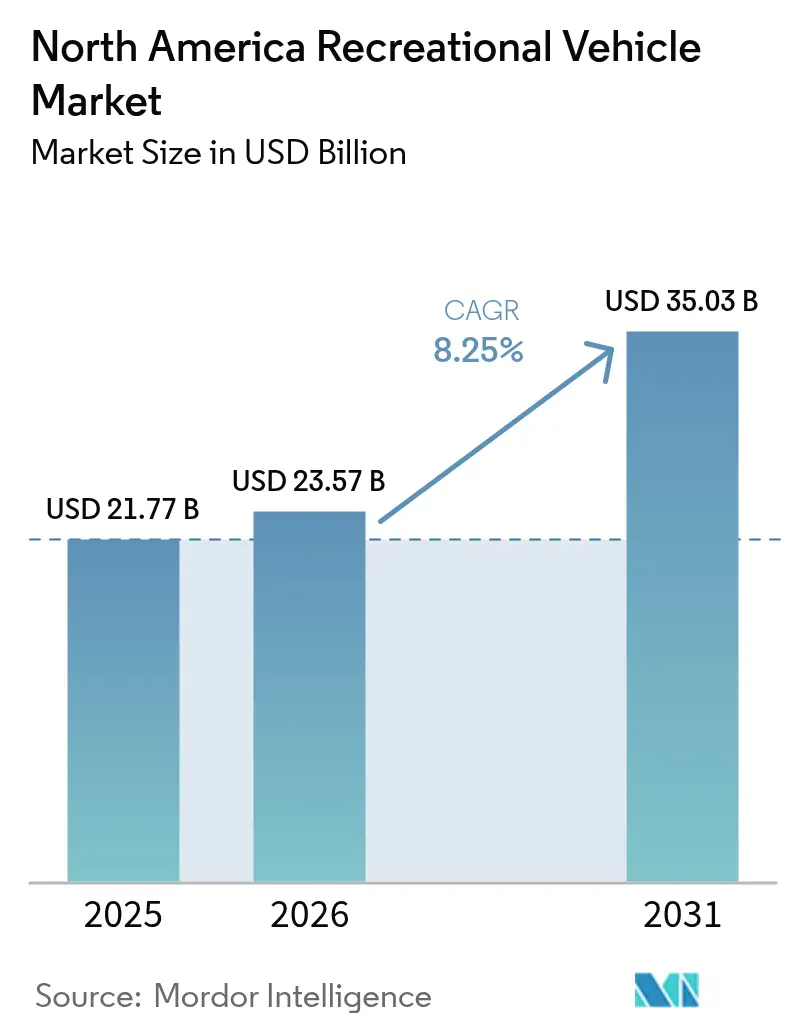
The North America RV market size was valued at USD 21.77 billion in 2025 and estimated to grow from USD 23.57 billion in 2026 to reach USD 35.03 billion by 2031, at a CAGR of 8.25% during the forecast period (2026-2031). Demand accelerates as remote work flexibility converts RVs from weekend escapes into viable long-term living spaces, while rising household ownership broadens the consumer base. Younger buyers represent a growing share of purchases, nudging product design toward connected, tech-rich floor plans. Electrified drivetrains gather momentum, helped by manufacturer commitments to hybrid and battery-electric models. Parallel growth in peer-to-peer rentals adds an access alternative that complements ownership and increases vehicle utilization. Despite macro-economic swings, the oligopolistic structure of leading suppliers speeds innovation cycles and cushions supply-chain shocks.
Key Report Takeaways
- By type, towable RVs held 63.52% of the North American Recreational Vehicle market share in 2025, while motorhomes are projected to expand at a 12.93% CAGR through 2031.
- By application, private use accounted for 69.48% share of the North America RV market size in 2025; commercial applications are forecasted to grow at 9.22% CAGR to 2031.
- By fuel type, gasoline units commanded a 60.88% of the North American Recreational Vehicle market share in 2025, yet battery-electric models are forecasted to post a 19.59% CAGR through 2031.
- By sales channel, new vehicles captured 70.12% of the North American Recreational Vehicle market share in 2025, whereas used sales are set to rise at a 7.21% CAGR between 2026 and 2031.
- By geography, the United States led with 91.95% of the North American Recreational Vehicle market share in 2025; Canada is expected to record the fastest 9.02% CAGR to 2031.
Note: Market size and forecast figures in this report are generated using Mordor Intelligence’s proprietary estimation framework, updated with the latest available data and insights as of 2026.
Market Trends and Insights
Drivers Impact Analysis of North America Recreational Vehicle Market*
| Driver | (~) % Impact on CAGR Forecast | Geographic Relevance | Impact Timeline |
|---|---|---|---|
| Electrified and Hybrid RV Models | +2.1% | United States, Canada | Medium term (2-4 years) |
| Increased Domestic Road-Trip | +1.8% | United States, Canada | Short term (≤ 2 years) |
| Popularity Of Remote Work | +1.6% | United States, Canada | Medium term (2-4 years) |
| Advanced Connectivity and IoT | +1.3% | United States, Canada | Long term (≥ 4 years) |
| Peer-To-Peer Platforms | +0.9% | United States, Canada | Short term (≤ 2 years) |
| Favorable State Tax Incentives | +0.6% | United States | Long term (≥ 4 years) |
| Source: Mordor Intelligence | |||
Growth in Electrified & Hybrid RV Models
Battery-electric and hybrid powertrains represent the most disruptive product shift underway in the North America recreational vehicle market. Thor Industries unveiled a hybrid Class A coach featuring a 140-kWh battery pack and a gasoline range extender that delivers a 500-mile total range. The design answers range anxiety and qualifies for emerging low-emission regulations. Electric torque improves hill-climbing performance, while silent operation raises campsite comfort. Manufacturers highlight off-grid capability by pairing large battery packs with roof solar arrays, enabling auxiliary power for residential needs when parked. Sustainability messaging aligns with the Scope 1 and 2 emissions cut Thor achieved since 2019, sharpening brand appeal to eco-conscious buyers. As charging infrastructure grows, electric RV ownership barriers continue to fall.
Increased Domestic Road-Trip Tourism Post-COVID
Domestic road travel remains the preferred alternative to international trips even after border restrictions eased. Approximately 8.1 million American households own an RV, and 16.9 million are expected to own an RV in the coming five years[1]. Average annual usage days jumped from 20 in 2021 to 30 in 2025, signaling deeper lifestyle integration. Younger cohorts under 50 now dominate new purchases, reinforcing a long replacement-demand runway. With high brand loyalty, more than 80% of pandemic-era buyers intend to repurchase the same marque, which creates predictable repeat sales for leading OEMs. The shift toward localized experiences and socially distanced recreation underpins persistent demand even as broader tourism normalizes.
Rising Popularity of Remote Work Enabling Long-Term RV Living
Twenty-two percent of campers reported working remotely from campsites in 2024, up sharply from pre-pandemic levels in the North America recreational vehicle market. The trend favors larger motorhomes configured with dedicated workspaces, reliable connectivity, and climate control fine-tuning. Winnebago’s connected-RV platform illustrates how OEMs integrate smart interfaces that let owners monitor systems, schedule maintenance, and manage energy use from a single app. Extended living periods reduce seasonal sales cyclicality and encourage demand for upgraded insulation, power management, and water-saving technologies. The professionalization of RV interiors closes the comfort gap with brick-and-mortar housing, positioning the category as a flexible real estate substitute
Advanced Connectivity & IoT Enhancing User Experience
Smart-device control of lighting, HVAC, slide-outs, and diagnostics is now a primary differentiator for premium brands in the North America recreational vehicle market. Remote monitoring supports predictive maintenance that prevents trip disruptions and lowers warranty costs. Usage data feeds new revenue models such as subscription-based feature unlocks or insurance priced by miles traveled. Integration with voice assistants streamlines operation for tech-savvy owners, aligning RV interiors with the connected-home environment. These digital enhancements strengthen resale values and accelerate replacement cycles as past-generation units feel dated.
Restraints Impact Analysis of North America Recreational Vehicle Market*
| Restraint | (~) % Impact on CAGR Forecast | Geographic Relevance | Impact Timeline |
|---|---|---|---|
| Volatile Fuel Prices | -1.4% | United States, Canada | Short term (≤ 2 years) |
| Rising Interest Rates | -1.2% | United States, Canada | Medium term (2-4 years) |
| Campground Capacity Shortages | -0.8% | United States, Canada | Long term (≥ 4 years) |
| Proliferation Of Rental Platforms | -0.6% | United States, Canada | Medium term (2-4 years) |
| Source: Mordor Intelligence | |||
Volatile Fuel Prices Increasing Trip Costs
Average U.S. gasoline prices averaged USD 3.30 per gallon in 2024, down 20 cents from 2023[2]. Class A motorhomes consume 1 gallon every 6-10 miles, so a two-week tour can require USD 1,000 in fuel, making travel decisions sensitive to pump swings. Diesel variants face separate volatility patterns that complicate budgeting for commercial fleets. Persistently high costs have revived consumer interest in hybrid drivetrains and lighter composite materials that improve mileage. Electrification provides a structural hedge but will take years to scale due to charging-site investments.
Rising Interest Rates Impacting Financing Affordability
Typical motorhome transactions exceed USD 100,000, and most buyers finance approximately 80% or more of the purchase. Steeper interest rates lengthen terms or raise payments, squeezing monthly budgets. Captive finance subsidiaries and dealer promotions absorb some pressure but compress margins. First-time buyers with no trade-in equity feel the strongest pinch, which can redirect them to the used market or rental alternatives. Elevated rates likewise weigh on commercial buyers who must manage fleet total-cost-of-ownership metrics.
*Our forecasts treat driver/restraint impacts as directional, not additive. The impact forecasts reflect baseline growth, mix effects, and variable interactions.
North America Recreational Vehicle Market Segment Analysis
By Type:
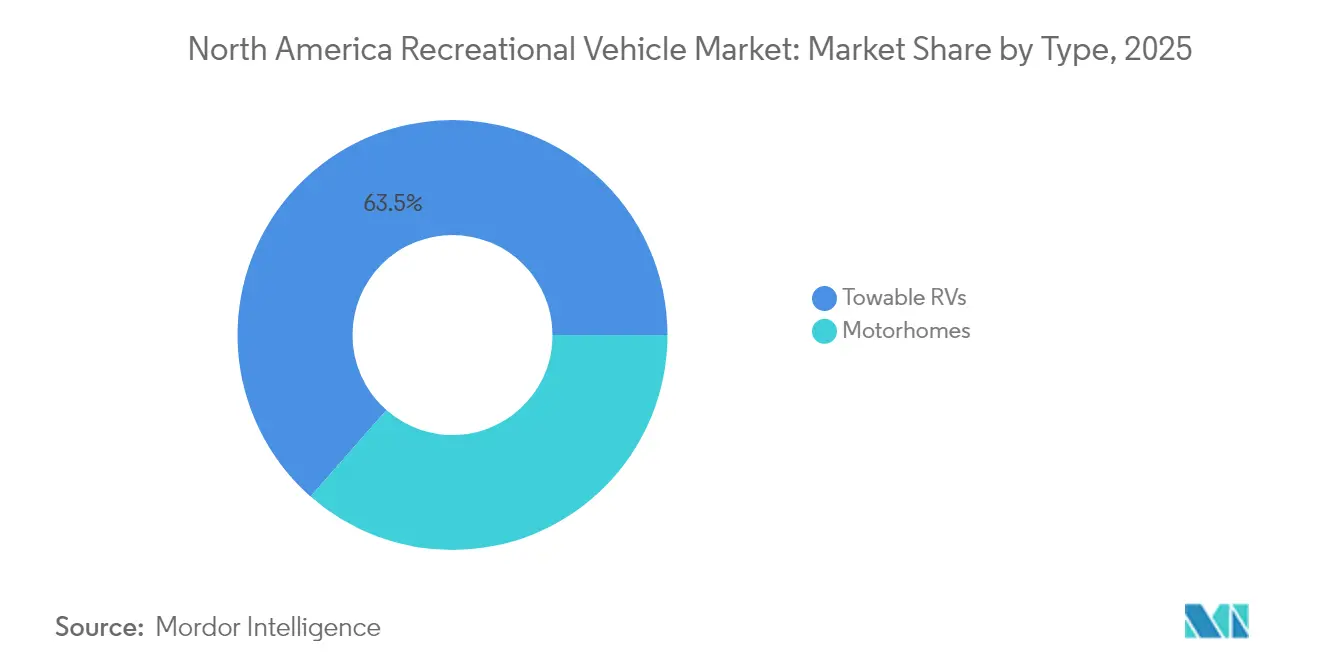
Motorhomes Drive Premium Segment GrowthTowable RVs held 63.52% of the North American Recreational Vehicle market share in 2025, while Motorhomes are forecast to log a 12.93% CAGR, positioning it as the principal growth engine for the North America RV market. Premium Type A models add residential finishes, slide-outs, and hybrid powertrains that reduce emissions and extend range. Type B camper vans target urban professionals who value maneuverability and stealth camping. Type C units balance price and livable space, widening appeal to families. Manufacturers deploy modular production that flexes between classes, preserving scale advantages while accommodating varied demand.
Towables retain relevance due to lower acquisition costs and the widespread availability of pickup trucks capable of towing. Travel trailers lead the category thanks to versatile floorplans and modest maintenance needs. Fifth-wheels add multi-level layouts and residential appliances suited for seasonal snowbird migration. Folding campers and truck campers serve entry-level budgets and off-road niches, respectively. This diversity keeps towable volume robust even as affluent cohorts shift into motorized products.

By Application:
Commercial Segment Accelerates AdoptionPrivate use captured 69.48% of the North American Recreational Vehicle market share in 2025, reflecting the recreational origins of the sector. Commercial usage, however, is forecast to compound at a 9.22% CAGR through 2031, outpacing the overall North America RV market size. Corporations deploy customized RVs as mobile command centers, pop-up showrooms, or temporary workforce housing on remote projects. Healthcare systems leverage self-contained clinics to expand rural reach. Hospitality firms outfit luxury units for glamping sites that command premium nightly rates.
The blurring of business and leisure travel fuels dual-use purchasing, allowing owners to classify expenses across personal and professional budgets. Tax advantages available in certain states further encourage commercial fleet formation. OEMs now offer factory-installed office pods, satellite connectivity, and generator packages that meet enterprise specifications.
By Fuel Type:
Electric Variants Signal Industry TransformationGasoline engines maintained a 60.88% of the North American Recreational Vehicle market share in 2025, supported by ubiquitous fueling infrastructure. Diesel power meets torque demands in heavy Class A coaches but faces tightening emission standards. Hybrid systems bridge current gaps by pairing range extenders with regenerative braking that cuts consumption by double-digit percentages. Electric RVs own a small base but are projected to achieve the highest 19.59% CAGR, reshaping the long-term profile of the North America RV market. Next-generation battery chemistry promises pack costs below USD 100 per kWh by 2028, narrowing parity with internal-combustion drivetrains.
OEMs tackle charging logistics by integrating 240-volt onboard inverters and advocating for pull-through high-amp stalls at truck-stop chains. Solar panels now ship as standard on select flagship models, delivering an incremental charge that supports boondocking independence. The evolution of propulsion technologies will likely reorder supplier relationships as electric-drive component specialists displace traditional engine partners.

By Sales Channel:
Used Market Gains MomentumNew units generated 70.12% of the North American Recreational Vehicle market share in 2025, yet used sales are forecast to rise at a 7.21% CAGR. The post-2020 buying surge created a pipeline of late-model trade-ins that swell dealer inventories. Certified pre-owned programs extend factory warranties, easing quality concerns for budget-focused shoppers. Digital marketplaces enhance price transparency and geographic reach, enabling sellers to tap buyers nationwide without consignment fees.
Dealer consolidation is reshaping both channels. Larger dealership groups are now providing enhanced service capabilities and better inventory management. Meanwhile, online platforms are increasingly complementing traditional dealers. A buying surge during the COVID era has led to a strong pipeline of used inventory. As early adopters either upgrade or exit the market, this influx supports used sales growth. To capture the value of the used market, manufacturers are rolling out certified pre-owned programs.
Geography Analysis
United States Recreational Vehicle Market
The United States commanded 91.95% of the North American Recreational Vehicle market share in 2025, buoyed by its 4.1 million miles of public roads, dense dealer networks, and campground inventory that spans climate zones. State property tax exemptions on motorhomes in 20 jurisdictions lower the total cost of ownership and influence registration location decisions. Capacity constraints loom as occupancy peaks during summer, prompting calls for 18,000 new sites by 2027. Infrastructure upgrades at national parks and private resorts aim to preserve traveler satisfaction but face permitting and funding hurdles.
Canada Recreational Vehicle Market
Canada represents the fastest-expanding geography at a 9.02% CAGR through 2031. Exchange-rate tailwinds make U.S.-built models more affordable to Canadian buyers. At the same time, domestic manufacturers leverage cold-weather engineering know-how to offer thermal-pane windows, enclosed underbellies, and higher R-value insulation suited for long-range trips. Government campaigns encouraging residents to explore provincial parks sustain demand beyond peak months, smoothing seasonal sales volatility. Dealer expansion into urban centers such as Toronto and Vancouver improves access for first-time buyers.
Mexico Recreational Vehicle Market
Rest of North America, chiefly Mexico, is poised for gradual growth as infrastructure and security improvements attract foreign and domestic tourists. Highway modernization under federal programs reduces travel times between urban hubs and scenic coasts, boosting confidence among long-distance RVers. U.S. retirees wintering in Mexico stimulate aftermarket parts and service opportunities. Currency fluctuations and customs procedures still limit large-scale import volumes, but partnerships between Mexican hospitality developers and North American OEMs signal early-stage ecosystem development.
Regulatory Landscape
In the United States, recreational vehicles operate under the National Highway Traffic Safety Administration (NHTSA) self-certification framework under 49 U.S.C. 30115, where manufacturers certify compliance with Federal Motor Vehicle Safety Standards (FMVSS) in 49 CFR Part 571 rather than pursuing type approval. RVs and trailers are governed by FMVSS labeling and load information requirements, including FMVSS No. 110 and FMVSS No. 120 (cargo and occupant/cargo carrying capacity disclosures). As a result, documentation, testing, and accurate labeling are central to compliance programs for both OEMs and upfitters.
In Canada, Transport Canada enforces the Motor Vehicle Safety Regulations (C.R.C., c. 1038) and requires compliance labels with prescribed information in both English and French. For RV body systems and installations, CSA Z240 RV Series standards (covering areas such as propane and electrical systems) are widely referenced for market access and safety alignment, creating a practical compliance layer for manufacturers and suppliers selling across provinces and into cross-border distribution networks. Cross-border trade also adds tariff and classification considerations, with RVs and components falling under established U.S. Customs and Border Protection HTSUS categories, such as motor homes under 8703 and camping trailers under 8716.10.00, which can affect sourcing decisions and landed-cost planning.
Value Chain Analysis
North American RV value creation starts with chassis and powertrain supply (notably for motorhomes) and a large bill of materials for towables and interiors, including frames, axles, appliances, HVAC, electrical distribution, plumbing, cabinetry, composites, and energy-storage systems. Component ecosystems are coordinated through industry bodies such as the RV Industry Association (RVIA), which represents over 500 manufacturers and suppliers and accounts for about 98% of U.S. RV production, alongside standards and compliance support delivered through RVIA-linked programs and supplier networks.
Manufacturing is geographically concentrated, with Elkhart County, Indiana producing roughly 85% to 86% of U.S.-built RVs, which supports localized supplier clusters, specialized labor, and short-haul logistics to OEM plants and upfitters. Distribution relies on franchised dealer networks and large dealership groups, supported by wholesale shipments of 342,220 units in 2025 (RVIA), and it is increasingly complemented by used and peer-to-peer channels that raise utilization and service demand. The chain remains sensitive to imported inputs, including select hydraulic and electrical parts from China and building materials from Canada and Mexico, which pushes sourcing diversification, supplier partnerships, and vertical integration to protect quality, cost, and lead times.
Competitive Landscape
The North American RV market exhibits high concentration, with the top 5 manufacturers controlling significant market share, creating oligopolistic dynamics that enable rapid innovation deployment while limiting new entrant opportunities. Scale advantages let leaders negotiate bulk component contracts, invest in proprietary electrification platforms, and finance dealer floor plans that secure shelf space. Thor Industries maintains the widest brand roster, coupling acquisitions with product-line specialization that minimizes cannibalization. Forest River leverages cross-segment manufacturing that fills factory slots year-round, optimizing labor utilization. Winnebago focuses on premium build quality and early adoption of smart-RV systems that sustain pricing power.
Competitive dynamics center on technology leadership. Thor’s hybrid Class A launch showcases integration capabilities that set performance benchmarks. Winnebago’s connected-RV ecosystem embeds over-the-air software updates that create recurring revenue while locking customers into branded service plans. Forest River invests in composite materials that shave weight and boost fuel economy. Vertical integration through component suppliers and captive financiers helps incumbents guard margins and resist price wars.
New entrants target niche offerings such as all-electric travel trailers or adventure-ready off-road campers; however, high capital requirements and dealership access hurdles restrict scale. Peer-to-peer rental platforms present indirect competition by monetizing under-used assets instead of selling new ones. Incumbents hedge by partnering with these platforms, offering fleet sales and maintenance packages that convert usage data into future product insights. As electrification accelerates, collaboration with battery and charging-infrastructure specialists becomes a gating factor for sustained leadership.
North America Recreational Vehicle Industry Leaders
-
Thor Industries
-
Forest River Inc.
-
Winnebago Industries, Inc.
-
REV Group
-
Triple E Recreational Vehicles
- *Disclaimer: Major Players sorted in no particular order

North America Recreational Vehicle Market Companies Covered in this Report
- Thor Industries Inc.
- Forest River Inc.
- Winnebago Industries Inc.
- REV Group
- Tiffin Motorhomes Inc.
- Entegra Coach Inc.
- NeXus RV
- Cruiser RV
- Triple E Recreational Vehicles
- Newmar Corporation
- Jayco Inc.
- Airstream Inc.
- Lance Camper Manufacturing Corp.
- Pleasure-Way Industries
- Keystone RV Company
- Coachmen RV
- Grand Design RV
- Roadtrek Inc.
- Fleetwood RV
- Holiday Rambler
Market Opportunities and Future Outlook
Electrification, off-grid power, and connectivity packages represent a clear whitespace across both motorhomes and towables, with supplier and OEM activity providing more concrete signals than concept-stage positioning. K-Z Recreational Vehicles partnering with Expion360 to integrate lithium-ion battery technology into premium Boondocker and Off the Grid packages in August 2024, along with OEM emphasis on connected experiences such as connected-RV platforms that centralize monitoring, diagnostics, and energy management, are examples of this direction. Materials innovation is another near-term lever, as builders and suppliers adopt composites to improve durability and weight; Coachmen RVs partnership with Supersede to integrate composite decking into Catalina and Aurora travel trailers (July 2026) illustrates an approach aimed at reducing moisture-related failures while supporting higher perceived quality in mass-market products.
Operational execution and supply-chain structure also create opportunity as product configurations multiply and warranty avoidance becomes a differentiator. Industry discussion has put VIN-level tracking and configuration management (ERP modernization) ahead of spreadsheet-driven complexity, reflecting the sector’s made-to-order manufacturing reality. Beyond product, advocacy around campground modernization and tariff stability is being coordinated through RVIA engagement with federal lawmakers, while the scale of the U.S. RV economy (RVIA cited USD 159 billion in annual economic output and 643,238 jobs as of June 2026) strengthens the case for infrastructure and policy support that expands usable capacity and reduces adoption friction for both owners and commercial fleets.
Recent Industry Developments in North America Recreational Vehicle Market
- July 2026: Forest River reintroduced the Concord premium Class C motorhome line with updated design and expanded floorplans. The refresh targets a higher-margin motorhome offering and supports buyers looking for longer-stay comfort and feature-rich layouts.
- February 2026: Thor Industries reorganized its North American RV operations into two operating groups, aiming to strengthen competitiveness and better align brand portfolios. The structure is intended to support deeper enterprise-wide digital and data integration across product development, sourcing, and dealer-facing operations.
- February 2024: Winnebago Industries partnered with Xos, Inc. to develop a fully electric chassis for its Specialty Vehicles division using Xos battery and electronics technology. This collaboration extends electrification beyond consumer RV concepts into commercial-grade platforms and supports technical readiness for battery-electric architectures and supplier ecosystems.
North America Recreational Vehicle Market Report Scope and Research Methodology
Market Definition and Coverage
For this methodology, the North America recreational vehicle market covers factory-level sales value of RVs that are built with living facilities for travel and temporary stay, including motorhomes and towable RVs sold across the region.
Scope exclusions: We exclude campground services, rentals, financing, insurance, aftermarket parts, and routine maintenance services from the market value.
Segments Covered in This Report
- By Type
- Towable RVs
- Travel Trailers
- Fifth Wheel Trailers
- Folding Camp Trailers
- Truck Campers
- Motorhomes
- Type A
- Type B
- Type C
- Towable RVs
- By Application
- Private
- Commercial
- By Fuel Type
- Gasoline
- Diesel
- Hybrid
- Battery-Electric
- By Sales Channel
- New RV Sales
- Used RV Sales
- By Country
- United States
- Canada
- Rest of North America
Data Sources, Market Sizing, and Validation
Desk Research
Desk research was used to set the basic demand and supply boundaries and to avoid counting non-RV spending in the same basket. We relied on public sources such as RV industry association releases, vehicle registration and transportation statistics, USITC and national customs trade tables, and government travel and tourism datasets that help explain RV usage intensity.
To make assumptions realistic, we also reviewed OEM annual reports and investor decks, dealership and association websites, and reputed press coverage around shipment trends, inventory corrections, and promotional pricing. Where needed, we referenced paid subscriptions for company financials and news intelligence, and also an import and export shipment-level database to sanity-check cross-border flows of completed units and key components. These examples are not exhaustive, and many other public sources were also consulted for data collection, validation, and clarification during the work.
Primary Interviews and Surveys
Primary work focused on interviews and structured surveys with RV manufacturers, key dealers and distributor groups, component suppliers, and fleet and commercial operators that buy RVs for business use. Inputs were collected across the United States and Canada, with selective checks tied to cross-border trade and demand seasonality, so assumptions from desk research could be corrected where the numbers did not line up.
Distribution of primary research fieldwork respondents
| Company type | Respondent position |
|---|---|
| Top tier: 35% | CXOs: 15% |
| Mid tier: 50% | Functional/Unit leaders: 28% |
| Smaller Players: 15% | Managers: 57% |
Market-Sizing & Forecasting
Sizing starts with a top-down rebuild of the RV demand pool by linking new RV shipments and registrations to replacement cycles, dealer inventory movements, and the share of buyers choosing motorhomes versus towables. Once that structure is in place, totals are corroborated with selective bottom-up checks using sampled unit volumes by RV type, typical transaction price ranges, and channel-level mix discussions from interviews, and then adjustments are made where the two views disagree.
Key inputs used in the model include RV shipment indicators, dealership inventory and retail turn expectations, interest rate sensitivity on big-ticket purchases, campground participation and travel trends, and observed price progression by RV class (including promotions and feature-content changes). For forecasting, scenario analysis is used so the base case can reflect expected macro conditions, financing availability, and normal seasonality, which is then refined using expert consensus on what demand looks like in peak versus off-peak periods. When bottom-up points are missing for smaller categories, the gaps are handled through mix-based interpolation using nearby RV classes and validated against total shipments and dealer feedback.
Data Validation & Update Cycle
Outputs are cross-checked against independent signals such as shipment trend lines, trade flows, and reported financial performance of the supply chain, and then the main drivers are reviewed to confirm the math still follows real market behavior. If unusual jumps appear, the assumptions behind units, pricing, and mix are rechecked and respondents are re-contacted when a mismatch cannot be explained by seasonality or one-off events.
Before sign-off, the model and narrative pass through multiple analyst review steps so the totals, growth rates, and key drivers stay consistent across sections. The report is refreshed annually, and interim updates are triggered when material events occur, such as a sharp inventory reset, major pricing moves, or policy and interest-rate changes that alter purchase intent. Right before delivery, a final fresh pass is completed so clients receive the most up-to-date view available at the time.
Mordor Intelligence's North America Recreational Vehicle Market Size Compared With Other Published Estimates
Published market values for North America recreational vehicles can differ even when they look like they measure the same thing, because the timing and the pricing assumptions behind the totals are not always aligned. In practice, the year chosen for currency conversion, how promotions are treated in average selling price (ASP), and whether inventory corrections are counted as real demand can all move the number.
The key gap drivers here are usually scope and refresh cadence. Some estimates lean heavily on retail spending style figures, which can quietly include rentals, services, or aftermarket add-ons, while others annualize a strong month and miss the winter slow period. By keeping the model updated when price and mix shift through the year and validating the implied ASP against dealer feedback and shipment signals, the 2026 market size used here stays closer to what is actually sold as new RV units, a refresh-led choice applied by Mordor Intelligence.
Benchmark comparison
| Source | Market Size | Gaps in Research Methodology |
|---|---|---|
| Mordor Intelligence | USD 23.57 B (2026) | |
| Regional Consultancy A | USD 27.48 B (2024) | Uses an earlier base year and appears to apply a broader revenue lens, which can blend retail spending effects and higher ASP assumptions that do not fully reflect promotion-led price resets. |
| Industry Publisher B | USD 20.16 B (2024) | Starts from a lower 2024 base and may rely more on reported demand narratives without fully reconciling dealer inventory swings and mix shifts between towables and motorhomes. |
The spread across sources is mostly explained by how the base year is set and how pricing and mix are refreshed during volatile periods. When the scope is kept to new RV unit sales value and the ASP is checked against shipment and channel signals, the outcome becomes easier to trace and repeat, which is what decision makers typically need for planning.
Key Questions Answered in the Report
How large will the North America RV market be by 2031?
The market is expected to reach USD 35.03 billion by 2031 at an 8.25% CAGR.
Which RV segment is growing the fastest?
Motorhomes are projected to expand at a 12.93% CAGR through 2031 due to demand for self-contained mobility.
Why are electric RVs gaining attention?
Battery-electric models promise lower operating costs, quieter performance, and compliance with stricter emission rules, fueling a 19.59% CAGR.
What is driving commercial adoption of RVs?
Businesses use RVs as mobile offices, clinics, and lodging, pushing the commercial segment to a 9.22% CAGR.
Which country in North America will grow fastest?
Canada is set to post the highest 9.02% CAGR, helped by four-season campground investments and favorable exchange rates.