North America Real Estate Brokerage Market Size and Share
Market Overview
| Study Period | 2019 - 2030 |
|---|---|
| Base Year For Estimation | 2024 |
| Forecast Data Period | 2025 - 2030 |
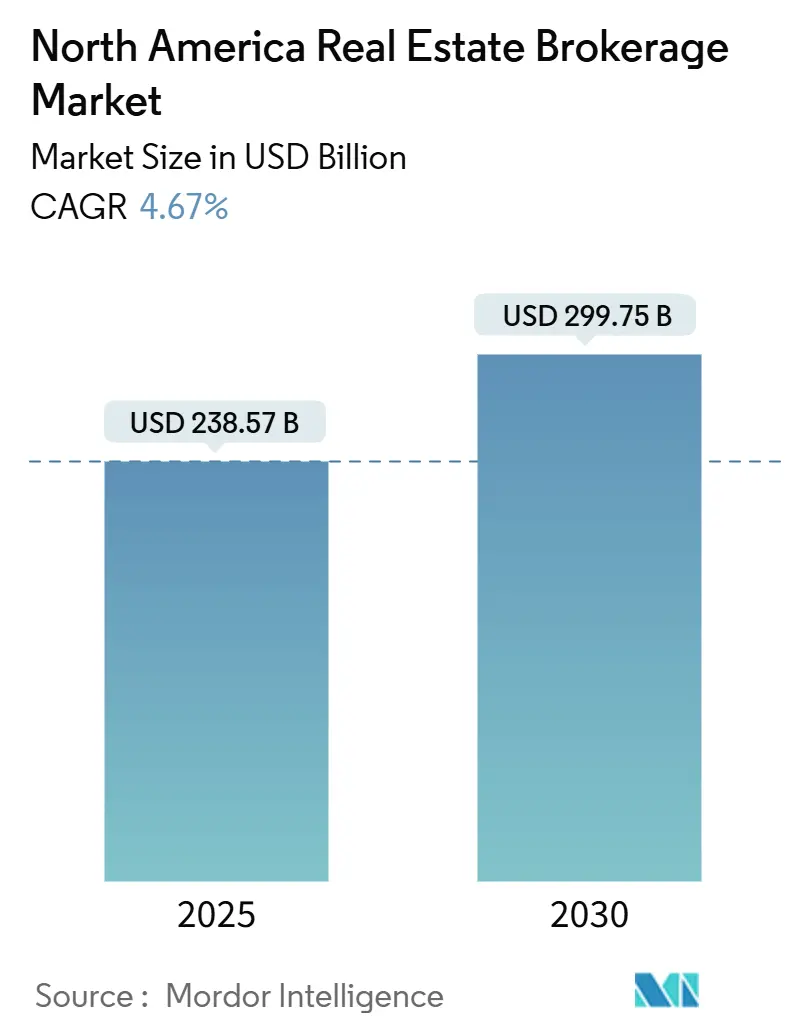
| Market Size (2025) | USD 238.57 Billion |
| Market Size (2030) | USD 299.75 Billion |
| Growth Rate (2025 - 2030) | 4.67% CAGR |
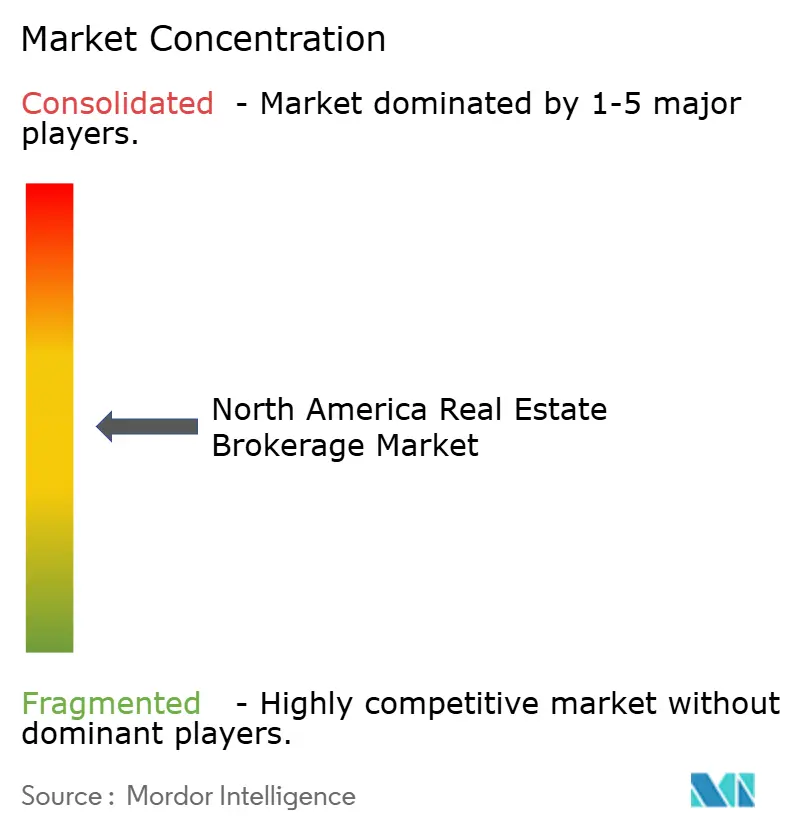
| Market Concentration | Medium |
Major Players *Disclaimer: Major Players sorted in no particular order Image © Mordor Intelligence. Reuse requires attribution under CC BY 4.0. | |
North America Real Estate Brokerage Market Analysis by Mordor Intelligence
The North America Real Estate Brokerage Market size is estimated at USD 238.57 billion in 2025, and is expected to reach USD 299.75 billion by 2030, at a CAGR of 4.67% during the forecast period (2025-2030). Demand resilience stems from sizable cross-border inflows—foreign capital into industrial and office assets rose 40% year over year in 2024—and from robust institutional appetite for single-family rental (SFR) portfolios. Residential transactions anchor the market with a 78.9% share, yet commercial brokerage fees are expanding more quickly as logistics and premium office assets attract overseas investors. Technology investment is accelerating because AI-powered valuation tools and virtual tours have become essential differentiators in a commission-compressed landscape. Meanwhile, commission rates slipped from 3% in the late 1990s to about 2.7% today, placing a premium on scale, operational efficiency, and M&A-driven consolidation.
Key Report Takeaways
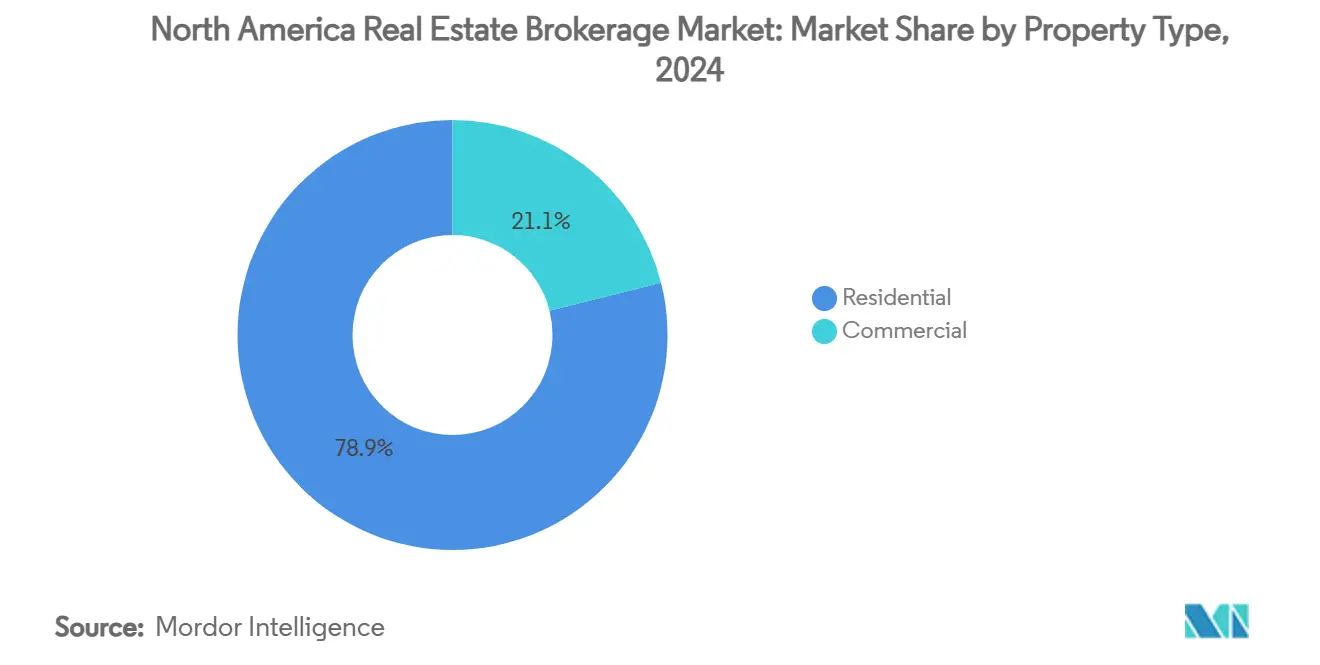
- By property type, residential assets led with 78.9% of the North America real estate brokerage market share in 2024, while commercial properties are projected to post the fastest 5.12% CAGR through 2030.
- By service, sales transactions accounted for 68.1% of the North America real estate brokerage market size in 2024, whereas rental/leasing services are expected to grow at a 5.41% CAGR to 2030.
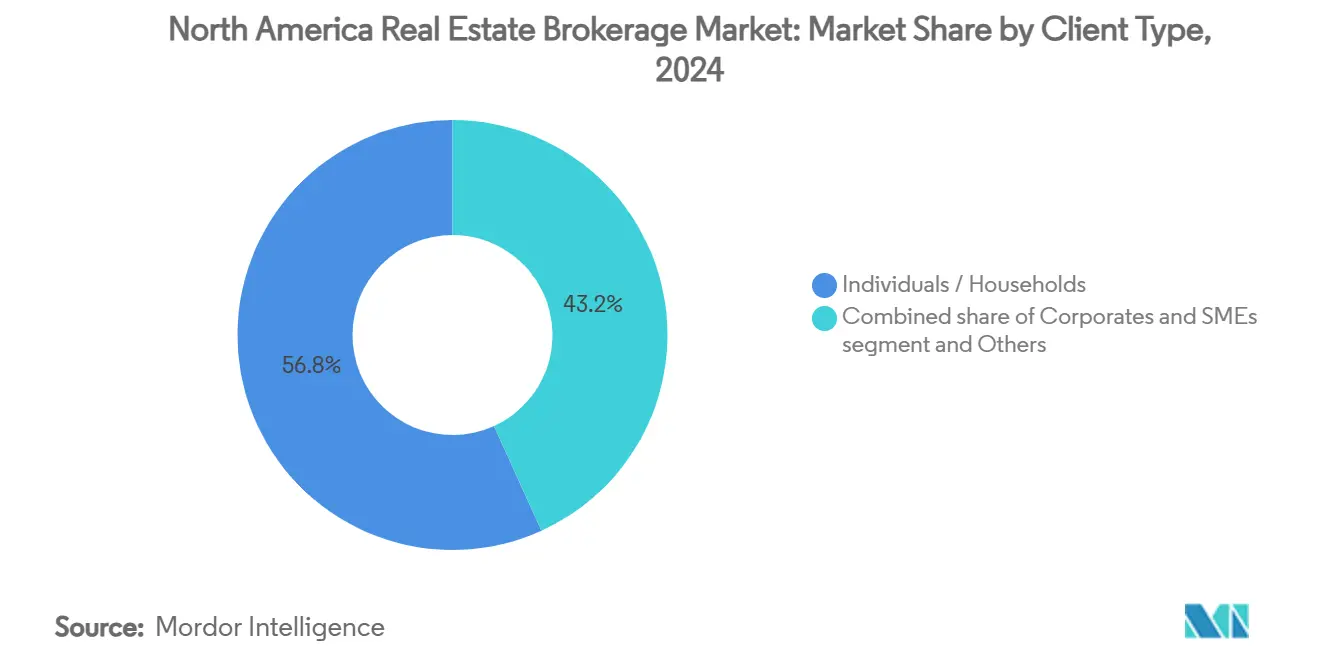
- By client type, individual and household clients held 56.8% of the North America real estate brokerage market share in 2024; corporate and SME clients represent the fastest-growing segment at a 5.30% CAGR.
- By geography, the United States commanded 86.9% of 2024 revenue, but Mexico is forecast to be the fastest-rising market at a 6.05% CAGR through 2030.
North America Real Estate Brokerage Market Trends and Insights
Drivers Impact Analysis
| Drivers | (~) % Impact on CAGR Forecast | Geographic Relevance | Impact Timeline |
|---|---|---|---|
| Uptick in residential resale volumes due to easing mortgage rates post-2023 peak | +1.2% | North America, strongest in US and Canada | Short term (≤ 2 years) |
| Increased institutional activity in the single-family rental (SFR) segment | +1.1% | US Sun Belt, expanding to Canada and Mexico | Long term (≥ 4 years) |
| Shift in urban-to-suburban migration patterns driving localized brokerage activity | +0.9% | US core markets, spillover to secondary cities | Medium term (2-4 years) |
| Surge in cross-border investment transactions across major metro cities | +0.8% | Global, concentrated in New York, San Francisco, Boston, Miami | Medium term (2-4 years) |
| Brokerage consolidation trends intensifying M&A activity across U.S. and Canada | +0.7% | North America, concentrated in major brokerages | Short term (≤ 2 years) |
| Expansion of AI-powered property valuation and virtual tour technologies | +0.6% | North America, early adoption in major metros | Long term (≥ 4 years) |
| Source: Mordor Intelligence | |||
Surge in Cross-Border Investment Transactions Across Major Metro Cities
Cross-regional capital inflows into North America have emerged as a key indicator of the region's economic resilience and investor confidence. In the latter half of 2024, North America experienced a notable rebound in investor confidence, evidenced by a robust 40% year-over-year surge in cross-regional capital inflows, totaling USD 9 billion. European pension funds predominantly channeled their investments into industrial sectors and prime office towers. New York emerged as a primary recipient, drawing in USD 2.3 billion, while cities such as San Francisco, Boston, and Miami also reaped substantial capital inflows, enhancing their brokerage fee pools. With reshoring trends amplifying the demand for last-mile facilities, logistics assets attracted a hefty USD 4.2 billion. Although office inflows witnessed a 50% rise, they still fell short of the five-year average, underscoring a selective investor inclination towards trophy buildings. Despite this capital influx, foreign investments remain shy of pre-pandemic figures, suggesting that brokerages dependent on these foreign allocations are still at the mercy of bond yield fluctuations and policy shifts. The shifting landscape of cross-regional capital flows highlights the critical nature of strategic investment choices in today's market[1]Jessica Kuronen, “Cross-Border Capital Flows into North American Real Estate Markets,” Bureau of Economic Analysis Working Paper, bea.gov.
Uptick in Residential Resale Volumes Due to Easing Mortgage Rates Post-2023 Peak
The real estate markets in Canada and the United States witnessed significant transformations in 2024, shaped by evolving monetary policies and economic conditions. The Bank of Canada reduced rates from 5% to 3.25%, driving a 10% increase in home resales and raising the average selling price to USD 510,439 after CAD conversion. Alberta benefited the most, while British Columbia and Ontario struggled with affordability. In the U.S., borrowing costs remained above 6%, keeping many homeowners tied to sub-4% mortgages and limiting new listings. Existing-home sales dropped to a 14-year low of 4.1 million units, while new-home sales saw a slight uptick, reflecting tight inventory levels. Looking ahead, Canada’s 2025 mortgage renewals, amounting to USD 222 billion in principal, could result in defaults of USD 11.1 billion, creating short-term volatility in brokerage deal flows. These developments underscore the dynamic nature of the housing markets and the challenges they face, as stakeholders navigate an uncertain future.
Expansion of AI-Powered Property Valuation and Virtual Tour Technologies
The North American real estate brokerage market is undergoing a transformative phase, driven by technological advancements and regulatory changes. Brokerages are investing in automated valuation models for real-time pricing insights and immersive 3-D tours, enabling remote buyers to assess properties without traveling. Following a litigation settlement, the National Association of Realtors has removed standard compensation offers from MLS listings, requiring agents to demonstrate their value through data-driven tools. Virtual tours, once seen as a temporary pandemic measure, are now a standard, particularly for institutional and foreign buyers seeking detailed property evaluations. Larger firms with proprietary data are gaining a technological edge over smaller independents, accelerating industry consolidation as regulators examine algorithm fairness. Adapting to these shifts will be crucial for maintaining competitiveness in this evolving market.
Shift in Urban-to-Suburban Migration Patterns Driving Localized Brokerage Activity
The real estate market in the United States is undergoing significant changes, driven by the shift towards remote work. CBRE's analysis of 19 markets reveals that families, influenced by remote-work flexibility, are moving to lower-density suburbs. While major coastal cities faced rising office vacancies, Dallas and Atlanta saw population inflows, boosting both home and rental demand. In Q1 2025, the formation of Gen Z households led to a record absorption of 130,000 multifamily units, increasing the demand for suburban brokerage services. Local agents with strong community knowledge gained an edge as buyers and renters sought guidance on emerging neighborhoods. This migration trend is diversifying the geographic spread of real estate commissions and benefiting networks adept at reallocating talent beyond traditional downtown hubs. The evolving dynamics of the real estate market reflect the changing work and lifestyle preferences of the population.
Restraints Impact Analysis
| Restraints | (~) % Impact on CAGR Forecast | Geographic Relevance | Impact Timeline |
|---|---|---|---|
| Ongoing affordability crisis in key housing markets limiting transaction volumes | -1.4% | North America, acute in major metros | Long term (≥ 4 years) |
| Persistent inventory shortages in both resale and new home listings | -1.1% | North America, concentrated in high-demand markets | Medium term (2-4 years) |
| Regulatory uncertainty around agent commission structures post-litigation rulings | -0.8% | US primarily, spillover effects in Canada | Short term (≤ 2 years) |
| Rising operational costs due to inflation and tech adoption burdens on small brokers | -0.6% | North America, disproportionate impact on independents | Medium term (2-4 years) |
| Source: Mordor Intelligence | |||
Ongoing Affordability Crisis in Key Housing Markets Limiting Transaction Volumes
The U.S. housing market continues to face significant challenges, driven by a persistent supply-demand imbalance. The country is dealing with a 3.7 million-unit housing deficit, which keeps prices elevated relative to incomes. Since late 2019, mortgage payments have surged by 92%, while rents have increased by 28%, pushing homeownership rates down to 65.6%. British Columbia and Ontario report the steepest price-to-income ratios, whereas Alberta shows stronger market velocity. Millennials, now the largest buyer cohort, often delay home purchases, extending rental periods and reducing resale listings. For brokerages, this translates to fewer transactions, particularly in the entry-level segment, as the pool of eligible buyers shrinks. Addressing these challenges remains critical for market stability.
Persistent Inventory Shortages in Both Resale and New-Home Listings
The North America real estate brokerage market is navigating a challenging landscape shaped by supply constraints and evolving trends. Homeowners, locked into low mortgage rates, are resisting moves, leading to tight active for-sale inventory. Builders face constraints from labor shortages and rising financing costs, resulting in annual completions falling short of household formation needs. In the U.S., existing-home listings hover near multi-decade lows. Meanwhile, in Canada, developers contend with zoning caps in Toronto and Vancouver. Despite robust demand, constrained supply limits transaction throughput, stunting market growth during the forecast period. However, brokerage firms are adapting by focusing on build-to-rent and new-home marketing mandates, positioning themselves to capitalize on emerging opportunities.
Segment Analysis
By Property Type: Residential Dominance Amid Accelerating Commercial Demand
Residential listings captured 78.9% of the North America real estate brokerage market in 2024, reflecting the large base of individual homebuyers and renters. Within residential, apartments and condominiums benefit from Gen Z household formation and millennial urban lifestyles, while suburban single-family houses ride work-from-anywhere migration waves. Institutional investors expanding build-to-rent portfolios have intensified demand for brokerage guidance on bulk deals and management tie-ups. Commercial assets are smaller in volume but post the fastest 5.12% CAGR as industrial and life-science sectors attract cross-border capital.
Commercial performance diverges by subtype: logistics hubs near ports and population centers draw multi-billion-dollar inflows, whereas B-grade offices in midsize cities struggle with double-digit vacancies. Premium office towers in gateway markets still clear high prices thanks to global capital hunting stable yields. Retail storefronts face selective downsizing as e-commerce penetration deepens, but necessity-based centers in high-growth suburbs maintain occupancy. Data centers and healthcare facilities in the “other” category provide counter-cyclical resilience and niche commission opportunities.
By Service: Sales Leadership with Expanding Rental Revenue Streams
Sales commands 68.1% of the North America real estate brokerage market share in 2024, underpinned by legacy commission structures. Yet rentals and lease-ups will outpace at 5.41% CAGR because prolonged affordability stress keeps households renting longer. Multifamily absorption records and institutional SFR expansion bolster recurring leasing fees, giving brokerages a steadier earnings base compared with transaction-driven sales income.
Sales volumes face headwinds from scarce listings and buyer budget constraints; however, each closed deal carries sizable commissions that sustain revenue concentration. The North America real estate brokerage market size for rental services is growing as property managers seek tenant-placement partners able to leverage data analytics for pricing and retention. Cross-border corporate tenants looking for industrial and office space across NAFTA corridors add to rental brokerage pipelines.
By Client Type: Individuals Still Rule as Corporates Accelerate
Individuals and households represented 56.8% of the 2024 client base, but corporate and SME demand is climbing at a 5.30% CAGR. Consumers drive most residential resales and rentals, generating frequent though often smaller ticket sizes. Mortgage renewals at sharply higher rates jeopardize some household budgets in Canada, potentially prompting distress listings that brokerages must handle with sensitivity.
Corporate clients, meanwhile, engage brokers for portfolio acquisitions, build-to-rent platform rollouts, and sale-leaseback strategies. European institutions alone invested USD 9 billion in 2024, with mandates often spanning multiple cities and asset classes. Advisory fees, data-driven site selection, and integrated debt-placement services enlarge the wallet share that brokers capture from enterprise relationships, tilting revenue mix gradually toward institutional accounts.
Note: Segment shares of all individual segments available upon report purchase
Geography Analysis
The United States retained 86.9% of the total 2024 revenue, a reflection of its depth, liquidity, and diversity of inventory. Sun Belt metros—Dallas-Fort Worth, Phoenix, Tampa, and Charlotte—continue to log population inflows and corporate relocations, translating into steady home sales and robust SFR leasing pipelines. New York, Los Angeles, and San Francisco remain capital magnets for international investors seeking trophy office and multifamily towers, although affordability constraints and elevated vacancy reshape deal underwriting. The North America real estate brokerage market size linked to U.S. logistics corridors is expanding as reshoring boosts demand for modern distribution facilities.
Canada contributes the second-largest share but confronts mortgage-renewal stress. Roughly USD 222 billion in mortgages will re-price in 2025, and potential defaults of USD 11.1 billion could spur motivated listings and portfolio rebalancing among lenders. Rate cuts during 2024 revived sales volumes, with Alberta’s oil-driven economy posting the healthiest gains. In contrast, British Columbia and Ontario grapple with hefty price-to-income ratios, restraining first-time buyers. Federal incentives to spur rental construction and GST relief on new multifamily supply will influence brokerage focus toward build-to-rent projects and institutional equity placement[2]Sophie Desroches, “Mortgage Renewals and Household Balance Sheets in Canada,” Bank of Canada Staff Discussion Paper, bankofcanada.ca.
Mexico, although only a small fraction of current revenue, is projected to grow fastest at a 6.05% CAGR through 2030. Reforms easing foreign ownership rules in industrial parks and the nearshoring of U.S. supply chains have propelled demand for logistics and manufacturing facilities along the Bajío and northern border corridors. Brokerages facilitating cross-border leases and build-to-suit arrangements capture higher-margin advisory fees. Coastal resort markets still require trust structures (fideicomisos) for foreign buyers, compelling specialized legal-broker partnerships. Rising middle-class homeownership and institutional appetite for rental apartments in Mexico City further widen growth avenues for the North America real estate brokerage market.
Competitive Landscape
The North America Real Estate Brokerage Market is a moderately concentrated yet still competitive market. Competition has intensified as commission compression and soaring tech budgets favor larger platforms. Compass tops league tables by volume and is finalizing the HomeServices of America acquisition that would cement scale across 45 states. Its earlier USD 444 million deal for @properties Christie’s bolstered luxury exposure and introduced an international referral network. Keller Williams’ funding round from Stone Point Capital injects capital for technology upgrades and agent recruitment, underscoring private equity’s growing influence on brokerage strategy[3]Katie Johnson, “National Association of REALTORS Settlement Agreement Summary,” NAR Legal Affairs Brief, nar.realtor.
Traditional franchise models confront disruption from digital entrants promising lower fees and AI-driven matching engines. Opendoor’s instant-buy model and Redfin’s salaried-agent approach have pressured incumbents on price transparency. Nevertheless, established firms leverage vast MLS coverage, proprietary data, and ancillary services such as mortgage origination, title insurance, and property management to protect share. The North America real estate brokerage market, therefore, favors firms that can bundle services and cross-sell to both individual and corporate clients.
Technology adoption is the chief battleground. AI valuation, predictive lead scoring, and blockchain-enabled smart contracts are moving from pilots to mainstream rollouts. Firms unable to fund these capabilities risk relegation to subscale local status or forced sale. Cost synergies and data aggregation underpin ongoing consolidation, with smaller independents joining national franchises to access platforms, training, and marketing reach.
North America Real Estate Brokerage Industry Leaders
Compass
Anywhere Real Estate (Coldwell Banker, Sotheby’s, etc.)
Keller Williams Realty
HomeServices of America / Berkshire Hathaway HomeServices
RE/MAX
- *Disclaimer: Major Players sorted in no particular order
Recent Industry Developments
- March 2025: Compass announced strategic acquisition of HomeServices of America from Berkshire Hathaway, combining the first and fourth-ranked U.S. brokerages by volume in a transaction that would create dominant market position amid industry consolidation trends.
- March 2025: Keller Williams secured strategic investment from Stone Point Capital, appointing Christopher Czarnecki as CEO while Gary Keller remains executive chairman, demonstrating private equity's growing role in residential brokerage sector.
- December 2024: Compass completed USD 444 million acquisition of @properties Christie's International Real Estate, marking its first major international expansion and adding the eighth-largest residential brokerage by sales volume to its portfolio.
- November 2024: The Agency launched mortgage lending business Aclara Lending in partnership with Barrett Financial Group, offering over 140 loan products for luxury transactions and expanding vertical integration strategy.
North America Real Estate Brokerage Market Report Scope
Real estate brokerage involves various activities, including dealing in timeshares, selling, buying, negotiating real estate transactions, property management, leasing, renting, and referring prospects to secure real estate or its improvements, all in exchange for a fee or compensation.
The North American real estate brokerage market is segmented by type (residential and non-residential), service (sales and rental), and geography (United States, Canada, and Mexico). The report offers market size and forecasts in value (USD) for all the above segments.
| Residential | Apartments and Condominums |
| Villas and Landed Houses | |
| Commercial | Office |
| Retail | |
| Logistics | |
| Others |
| Sales |
| Rental / Leasing |
| Individuals / Households |
| Corporates & SMEs |
| Others |
| United States |
| Canada |
| Mexico |
| By Property Type | Residential | Apartments and Condominums |
| Villas and Landed Houses | ||
| Commercial | Office | |
| Retail | ||
| Logistics | ||
| Others | ||
| By Service | Sales | |
| Rental / Leasing | ||
| By Client Type | Individuals / Households | |
| Corporates & SMEs | ||
| Others | ||
| By Country | United States | |
| Canada | ||
| Mexico | ||
Key Questions Answered in the Report
How large is the North America real estate brokerage market in 2025?
The market is valued at just over USD 237.57 billion in 2025 and is projected to climb to USD 299.75 billion by 2030 on a 4.67% CAGR trajectory.
Which property type generates the most brokerage revenue?
Residential assets account for 78.9% of 2024 revenue, with apartments, condominiums, and single-family homes providing the bulk of commission fees.
Why are rental and leasing services growing faster than sales?
Affordability challenges and tight resale inventory keep households renting longer, driving rental/leasing brokerage revenue at a 5.41% CAGR compared with slower sales growth.
What impact did the National Association of Realtors settlement have on commissions?
The USD 418 million settlement removed standard buyer-agent compensation offers from MLS listings and is expected to compress commission rates below the current 2.7% average.
Which geography offers the fastest growth opportunity through 2030?
Mexico leads with a forecast 6.05% CAGR thanks to liberalized investment rules and nearshoring-driven demand for industrial and residential assets.
How is technology reshaping brokerage competition?
AI valuation tools, virtual tours, and integrated CRM platforms have become must-have capabilities, rewarding well-capitalized firms and intensifying consolidation among smaller agencies.


