
Market Overview
| Study Period | 2020 - 2031 |
|---|---|
| Forecast Data Period | 2026 - 2031 |
| Base Year Market Size (2025) | USD 72.63 Billion |
| Market Size (2026) | USD 76.47 Billion |
| Market Size (2031) | USD 98.99 Billion |
| Growth Rate (2026 - 2031) | 5.29 % |
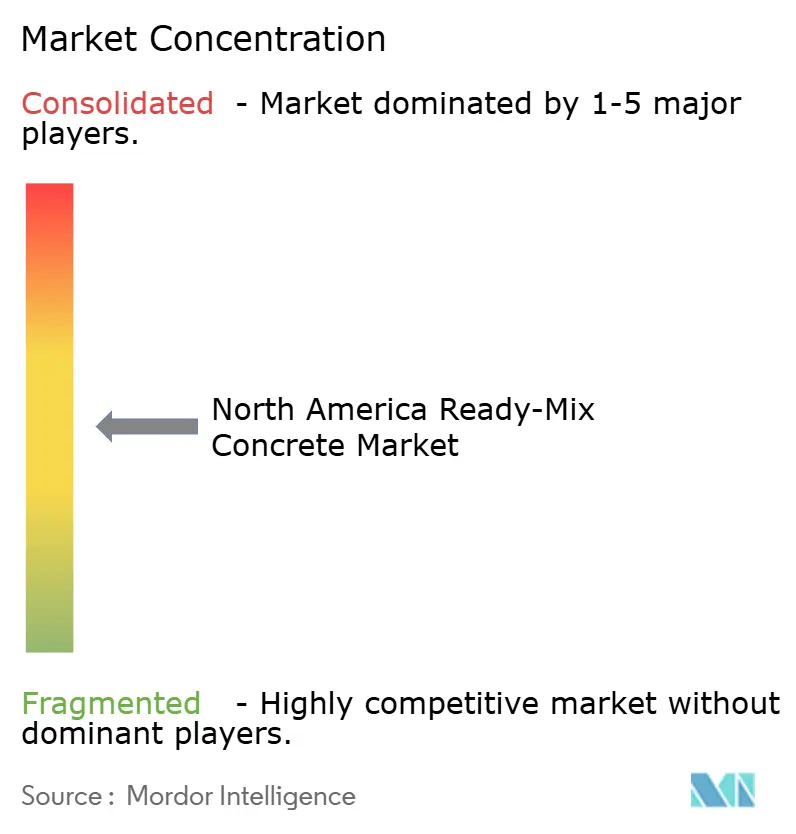
| Market Concentration | Medium |
Major Players *Disclaimer: Major Players sorted in no particular order Image © Mordor Intelligence. Reuse requires attribution under CC BY 4.0. | |
North America Ready-Mix Concrete Market Analysis by Mordor Intelligence
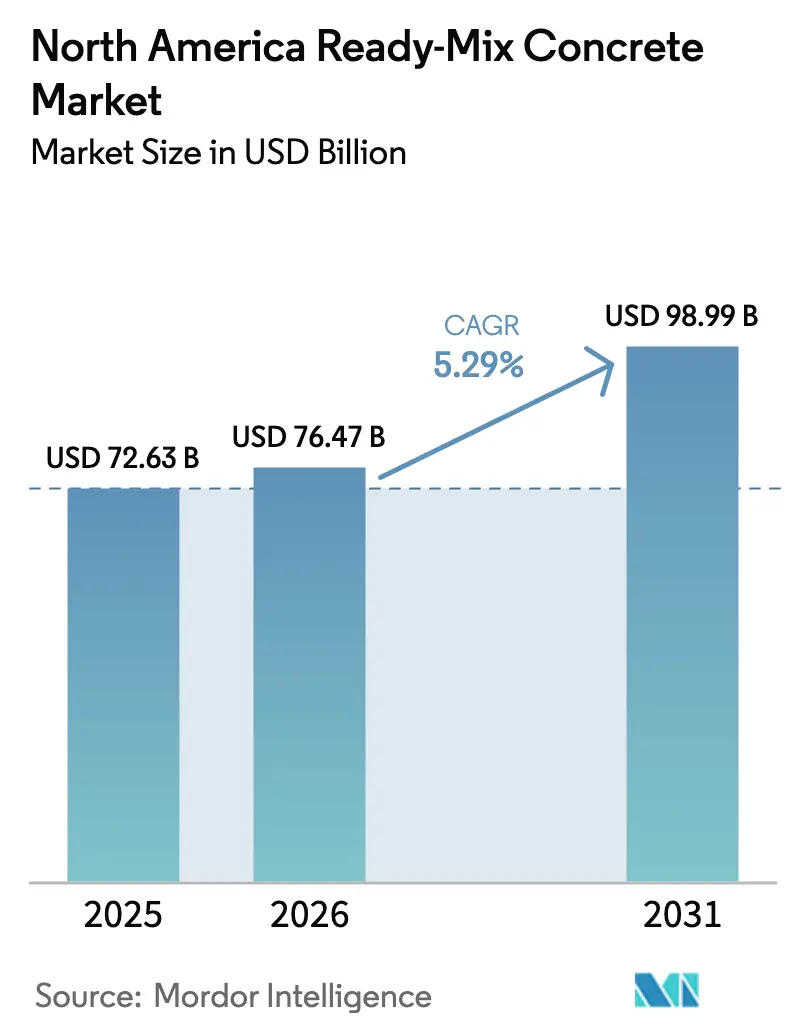
The North America Ready-Mix Concrete Market size was valued at USD 72.63 billion in 2025 and estimated to grow from USD 76.47 billion in 2026 to reach USD 98.99 billion by 2031, at a CAGR of 5.29% during the forecast period (2026-2031). The trajectory underscores the sector’s resilience as federal infrastructure outlays, a broad-based housing recovery, and rapid digitalization of dispatch and batching operations converge to expand demand. Funds released under the Infrastructure Investment and Jobs Act (IIJA) have already accelerated concrete consumption along priority highway and bridge corridors, while state decarbonization mandates are nudging producers toward low-carbon mix designs that command premium pricing yet still meet performance specifications. At the same time, AI-enabled quality control systems are trimming material waste and reducing delivery cycle times, giving early adopters a competitive cost advantage. Consolidation continues unabated, with leading vertically integrated suppliers expanding geographic footprints and capturing synergies by controlling cement, aggregate, and downstream mixing assets. Collectively, these forces indicate that the North America Ready-Mix Concrete market will sustain solid mid-single-digit growth through the end of the decade.
Key Report Takeaways
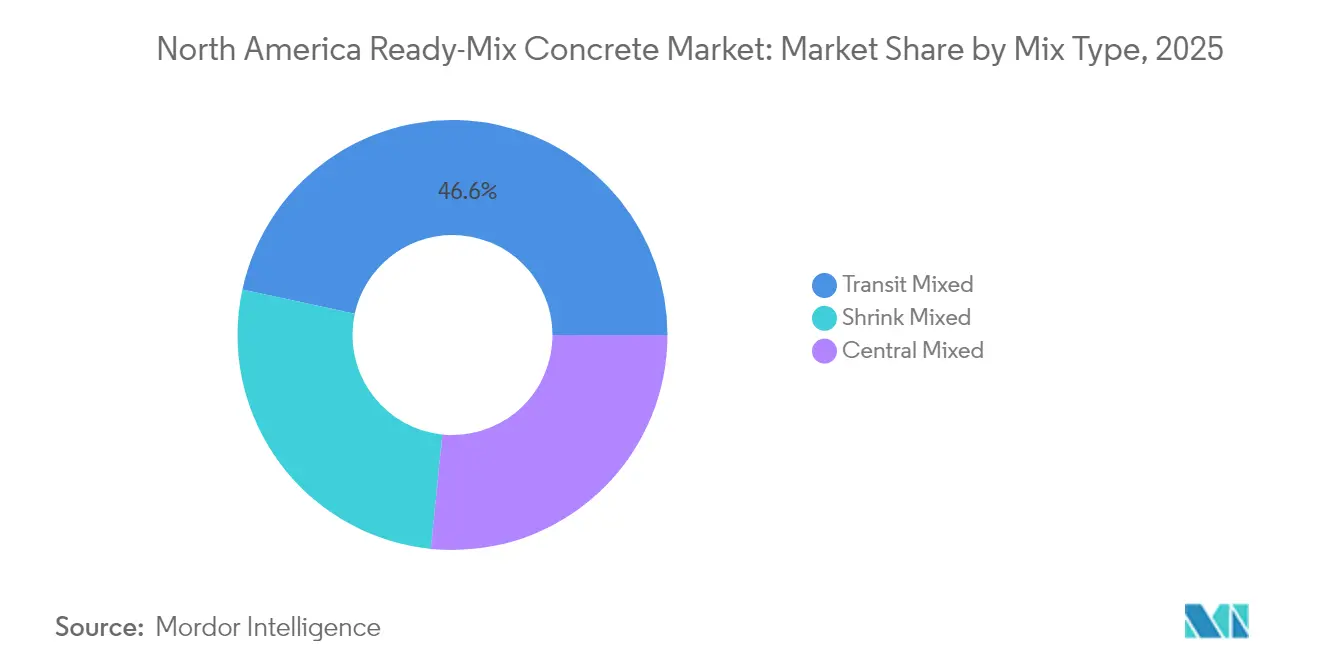
- By mix type, transit-Mixed concrete led with a 46.60% share of 2025 revenue and remains the largest contributor to growth. Shrink-Mixed concrete is advancing at a 5.59% CAGR through 2031, the fastest rate among mix types.
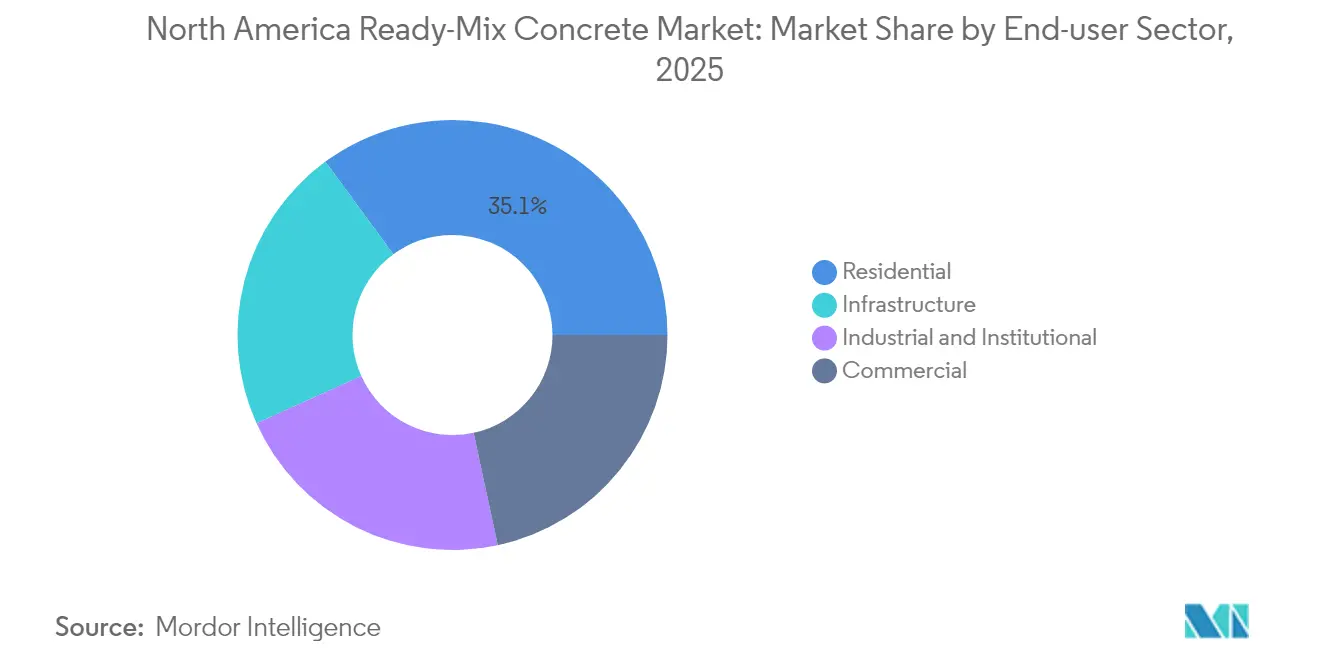
- By end-use sector, the residential segment accounted for 35.07% of 2025 revenue and is expanding at a leading 5.91% CAGR.
- By geography, the United States commanded 84.17% of 2025 value while also posting the highest 5.45% CAGR.
Note: Market size and forecast figures in this report are generated using Mordor Intelligence’s proprietary estimation framework, updated with the latest available data and insights as of 2026.
Market Trends and Insights
Drivers Impact Analysis of North America Ready-Mix Concrete Market*
| Drivers | (~) % Impact on CAGR Forecast | Geographic Relevance | Impact Timeline |
|---|---|---|---|
| Federal-level infrastructure stimulus packages | +1.8% | Highest concentration in California, Texas, New York, Florida, Pennsylvania | Medium term (2-4 years) |
| Housing starts rebound and residential retrofits | +1.5% | U.S. metropolitan areas | Short term (≤ 2 years) |
| Superior consistency and speed versus site-mixed | +0.9% | Urban markets worldwide | Long term (≥ 4 years) |
| State decarbonization mandates | +1.1% | Early adoption in California and New York, spreading nationally | Medium term (2-4 years) |
| AI-optimized dispatch and batching platforms | +0.6% | Technology-forward producers, especially in dense metro regions | Medium term (2-4 years) |
| Source: Mordor Intelligence | |||
Federal Infrastructure Stimulus Drives Sustained Concrete Demand
Annual IIJA allocations of USD 62 billion for highways and bridges are channeling a reliable order pipeline to producers across the North America Ready-Mix Concrete market[1]. Contractors on Michigan’s I-69 rebuild, for example, established temporary batch plants to meet accelerated delivery schedules and optimize mix performance[2]. With disbursements fixed through 2030, producers now operate with unprecedented demand visibility, de-risking capital outlays for new plants and fleets.
Housing Market Recovery Accelerates Residential Concrete Consumption
The residential segment posted the highest 5.98% CAGR as pent-up demand, favorable mortgage support, and migration to Sun Belt metros lifted housing starts. Population inflows into Texas, Florida, and the Carolinas require rapid foundation and slab work—applications where ready-mix’s speed and strength consistency eclipse site-mixed alternatives. Parallel retrofit activity in legacy cities such as Chicago and Philadelphia is boosting demand for specialty decorative and fiber-reinforced mixes.
Technology Integration Transforms Operational Efficiency
Producers deploying cloud-based dispatch platforms report up to 15% improvement in truck utilization and 20% lower material waste through real-time slump monitoring and predictive batching algorithms. Heidelberg Materials uses AI-driven in-drum probes that continuously relay temperature and workability data, reducing rejection rates while shrinking CO₂ intensity. The SlumpGuard vision analytics system adds automated slump prediction and has cut manual testing labor by half at pilot plants
State Decarbonization Mandates Reshape Product Specifications
California’s CALGreen Code caps concrete’s global-warming potential at 260-433 kg CO₂e/m³ depending on strength class, pushing suppliers to integrate higher fly-ash and slag ratios or alternative binders. New York’s Buy Clean law requires Environmental Product Declarations on projects over USD 1 million, favoring producers that can certify low-carbon mixes. These mandates accelerate the scaling of technologies such as Fortera’s ReCarb process, which claims 70% lower embodied carbon versus ordinary Portland cement
Restraints Impact Analysis of North America Ready-Mix Concrete Market*
| Restraints | (~) % Impact on CAGR Forecast | Geographic Relevance | Impact Timeline |
|---|---|---|---|
| Cement and aggregate price volatility | –1.2% | Import-dependent regions across North America | Short term (≤ 2 years) |
| Competition from precast and modular systems | –0.8% | Commercial and industrial segments | Long term (≥ 4 years) |
| Truck-driver capacity and Hours-of-Service limits | –0.7% | Rural and long-distance delivery markets | Medium term (2-4 years) |
| Source: Mordor Intelligence | |||
Cement and Aggregate Price Volatility Pressures Margins
Energy-linked cement price spikes in 2024 and 2025 strained producer margins as tariffs on imported clinker compounded supply tightness. Aggregate haulage costs also rose amid diesel price volatility, with western Canadian quarries citing freight as 40% of delivered cost. Contract structures often delay pass-through, forcing producers to hedge input costs or absorb margin compression during peak volatility.
Precast and Modular Construction Systems Gain Market Share
In parking structures and warehouse shells, precast panels can shave weeks off schedules, challenging ready-mix volumes. Precasters are harnessing automation and digital-twin design to improve dimensional accuracy, while 3D-printed concrete elements are carving out niche demand for bespoke architectural components. Ready-mix suppliers are countering by offering on-site volumetric trucks and rapid-set mixes that narrow the time-to-erection gap.
*Our forecasts treat driver/restraint impacts as directional, not additive. The impact forecasts reflect baseline growth, mix effects, and variable interactions.
North America Ready-Mix Concrete Market Segment Analysis
By Mix Type:
Transit-Mixed Dominance Amid Shrink-Mixed InnovationTransit-Mixed concrete accounted for a 46.60% North America Ready-Mix Concrete market share. As mobile drums enable last-minute water adjustments, contractors value the flexibility to fine-tune slump on arrival, making the format indispensable for bridge decks and mid-rise frames. Over the forecast horizon, the segment continues to leverage established logistics networks and truck telematics that optimize engine idle time and Washington-mandated emissions targets. Central-Mixed concrete holds the second-largest portion of the North America Ready-Mix Concrete market, favored for mega-volume pours such as dam footings, where central batching ensures homogeneous quality. Shrink-Mixed concrete, though currently smaller, is projected to expand at 5.59% CAGR—the highest among mix types—thanks to admixture advancements that prolong workability for small urban deliveries, cutting site congestion and storage footprints.
Demand for Shrink-Mixed products is also being fueled by cities tightening noise and dust ordinances, prompting contractors to avoid on-site mixers. Producers are responding with mini-fleet agitator trucks that feature hydraulic drive systems and carbon-fiber drums, slashing tare weight and boosting payload. Central-Mixed operators, meanwhile, are retrofitting plants with high-shear twin-shaft mixers capable of ultra-high-performance concrete (UHPC) for precast girders on high-speed rail projects.

By End-User Sector:
Residential Leadership Drives Market ExpansionThe residential sector held a 35.07% slice of the North America Ready-Mix Concrete market. Single-family starts in Texas, Florida, and Arizona surged on domestic inward migration, while multifamily towers in Dallas, Miami, and Toronto drove demand for high-strength pumpable mixes. The segment’s 5.91% CAGR is buoyed by public-private partnerships targeting affordable housing backlogs and by municipal incentives for low-carbon building materials. Commercial construction ranks second, covering retail centers, data halls, and mixed-use downtown redevelopments that rely on ready-mix for accelerated topping-out schedules. Industrial-and-institutional projects deliver stable baseline demand, with semiconductor fabs and school modernization programs specifying shrinkage-compensating mixes for vibration-sensitive flooring.
Infrastructure remains volume-intensive although smaller by revenue, yet it earns premium margins via high-performance formulations used in bridge decks and water-treatment facilities. Across sectors, developers increasingly mandate Environmental Product Declarations, pushing producers to document embodied-carbon reductions. The residential domain is especially sensitive to green-building certification: mixes with 30% fly-ash substitution and warm-mix admixtures help builders secure LEED points.
Geography Analysis
United States Ready-Mix Concrete Market
The United States dominated with an 84.17% share of the North America Ready-Mix Concrete market. IIJA funds of USD 62 billion annually guarantee a multiyear pipeline, with California, Texas, and New York receiving the largest allocations. California’s CALGreen Code and executive orders from New York’s Office of General Services compel low-carbon concrete adoption, setting early-mover standards soon to permeate neighboring states. U.S. producers also benefit from dense interstate highway networks that optimize back-haul opportunities for aggregate fleets, trimming logistics costs.
Canada Ready-Mix Concrete Market
Canada contributes a moderate slice of regional revenue anchored in Ontario and Québec population centers. Federal and provincial infrastructure budgets prioritize rehabilitation of aging overpasses and public-transit expansions, while harsh winter cycles constrain construction windows to roughly eight months, amplifying the appeal of high-early-strength mixes.
Mexico Ready-Mix Concrete Market
Mexico is propelled by industrial nearshoring clusters along the Bajío corridor and northern maquiladora zones. The country’s 38 integrated cement plants supply a domestic clinker capacity of 60.5 million t, allowing ready-mix affiliates of Cemex, GCC, and Holcim-Apasco to leverage captive cement and aggregate while exporting surplus to U.S. border projects when demand peaks.
Value Chain Analysis
The ready-mix concrete value chain in North America starts with upstream extraction and processing of aggregates and cementitious materials (cement, supplementary cementitious materials such as fly ash and slag), followed by admixture supply and batching and mixing at fixed plants. Deliveries depend on mixer truck fleets and scheduling discipline to meet site requirements. Vertically integrated players reduce exposure to cement and aggregate price volatility by controlling quarries, terminals, and cement supply, while independent ready-mix producers rely more heavily on regional aggregate availability and inbound cement logistics, making freight and energy costs central to delivered cost.
Midstream operations increasingly focus on quality and carbon documentation alongside throughput, with Environmental Product Declarations (EPDs) and product category rules becoming part of procurement for public and large private projects. On the downstream side, contractors and developers are consolidating supplier bases to secure schedule reliability, which raises the importance of dispatch optimization and fleet utilization. This interacts with early 2026 capacity constraints and supports earlier procurement, diversified sourcing, and more localized stock and terminal strategies for critical inputs.
Competitive Landscape
The market is moderately fragmented. Technology leadership is turning into a key differentiator. Producers using AI-optimized truck queuing and automated batching have boosted on-time delivery above 96%, outclassing peers still reliant on manual dispatch spreadsheets. Sustainability credentials further shape bid competitiveness: CEMEX’s Vertua product line, marketed at 20-70% lower embodied carbon, secured marquee pours on U.S. federal courthouses after surpassing Buy Clean thresholds. Barriers to entry remain high because a single dry-batch plant costs USD 2-3 million, not including aggregate reserves and fleet investment.
North America Ready-Mix Concrete Industry Leaders
-
CEMEX SAB de CV
-
CRH
-
Holcim
-
Heidelberg Materials
-
Vulcan Materials Company
- *Disclaimer: Major Players sorted in no particular order
North America Ready-Mix Concrete Market Companies Covered in this Report
- Argos USA LLC
- Buzzi SpA
- CEMEX SAB de CV
- Colas
- CRH
- GCC
- Heidelberg Materials
- HOLCIM
- Martin Marietta Materials
- R.W. Sidley Inc.
- Sika AG
- SRM Concrete
- Thomas Concrete Group
- Titan Cement
- Vicat SA
- Vulcan Materials Company
Market Opportunities and Future Outlook
Low-carbon and EPD-backed concrete is creating a clearer whitespace for producers to differentiate mix designs while aligning with evolving project procurement requirements. Holcim’s ECOPact, which reached 31% of its ready-mix net sales, illustrates how measurable product adoption is shaping specification decisions, and state and project-driven embodied-carbon reporting is pushing producers to scale SCM substitution, alternative fuels, and circular construction hubs that incorporate construction and demolition materials.
The most actionable opportunities also cluster in large, programmatic demand pockets where ready-mix supply reliability and documented performance matter. These include IIJA-funded highways and bridges, with multi-year allocations through 2030, advanced manufacturing builds, and data center construction referenced in 2026 construction-market commentary. Producers with dense plant networks, aggregate access, and digital dispatch systems can win through faster cycle times, tighter slump control, and compliance-ready documentation, while smaller operators can compete by specializing in high-performance, rapid-set, or low-carbon mixes linked to local EPD efforts and green-building procurement frameworks.
Recent Industry Developments in North America Ready-Mix Concrete Market
- June 2026: CRH Plc enters into a definitive agreement to acquire Arcosa Inc. in an all-cash transaction valued at $8.5 billion, expected to close in early 2027. The deal expands CRH's access to assets serving ready-mix producers, including quarries and terminals, and enhances downstream consolidation. The acquisition strengthens CRH's North America infrastructure materials footprint and control over supply chains for ready-mix customers.
- June 2026: CRH Plc entered into a definitive agreement to acquire Arcosa Inc. in an all-cash transaction valued at $8.5 billion, expected to close in early 2027. The deal includes assets serving ready-mixed concrete producers, such as quarries and terminals, and Arcosa's specialty products. The transaction broadens CRH's network and augments materials capacity for sustained market competitiveness.
- April 2026: Suncrete, Inc. completes the acquisition of Hope Concrete, LLC, adding 10 ready-mix plants and 88 mixer trucks in North Texas and Southern Louisiana. The expansion reinforces regional coverage and fleet capacity to support more commercial and public sector pours. Suncrete also extends its geographic footprint and operational scale in the southern corridor.
North America Ready-Mix Concrete Market Report Scope and Research Methodology
Market Definition and Coverage
This market covers revenues generated from ready-mixed concrete supplied in North America, where concrete is batched at a plant and delivered to job sites for immediate placement, across typical construction and infrastructure uses.
Scope exclusions: It excludes on-site mixed concrete, precast concrete products, cement and aggregates sold as standalone materials, and equipment rental or placement services that are billed separately.
Segments Covered in This Report
- By Mix Type
- Transit Mixed
- Central Mixed
- Shrink Mixed
- By End-user Sector
- Residential
- Commercial
- Industrial and Institutional
- Infrastructure
- By Geography
- United States
- Canada
- Mexico
Data Sources, Market Sizing, and Validation
Desk Research
Desk work started with building a common fact base around construction activity and concrete usage, so later interview inputs had a stable reference point. We mainly used public series such as US Census construction spending and building permits, Statistics Canada construction indicators, Mexico INEGI construction statistics, and USGS minerals and cement materials data. For trade exposure checks, we also used trade information from USITC and UN Comtrade.
To convert activity into a realistic ready-mix demand pool, we reviewed concrete mix consumption patterns using sources such as NRMCA publications (for example, reported US ready-mix industry revenue and delivered volume benchmarks), DOT and infrastructure program disclosures, and technical papers that describe concrete mix designs and strength requirements. Company filings, investor presentations, and trusted industry press were also reviewed for plant footprint signals and pricing commentary, while paid subscriptions were used selectively for company financials, news, and shipment-level import and export checks. This desk source list is illustrative and not exhaustive, and we relied on additional public and paid references to validate and clarify specific data points.
Primary Interviews and Surveys
Primary work focused on validating what actually moved the market in the base year, especially pricing behavior, fleet and plant utilization, and the split between private building and public works demand. We spoke with ready-mix producers, materials distributors, contractors, and project specifiers across the United States, Canada, and Mexico, so desk-research assumptions could be adjusted when local dispatch ranges, job mix, or procurement routines differed.
Distribution of primary research fieldwork respondents
| Company type | Respondent position |
|---|---|
| Top tier: 39% | CXOs: 14% |
| Mid tier: 47% | Functional/Unit leaders: 39% |
| Smaller Players: 14% | Managers: 47% |
Market-Sizing & Forecasting
Sizing was built using a top-down approach where construction activity and infrastructure outlays were translated into concrete consumption, then filtered to the portion typically supplied as ready-mix in North America. For each country, demand was reconstructed using a limited set of inputs that can be explained and refreshed each year, and totals were checked against selective bottom-up approximations from supplier revenue disclosures and sampled price-times-volume logic.
Key inputs included construction spending by segment, housing starts and nonresidential floor-area signals, public infrastructure awards and DOT programs, reported ready-mix delivered volume indicators (cubic yards), observed average selling price movement by metro area, and plant and fleet utilization constraints that can limit supply during peak season. Forecasts were produced using scenario analysis supported by simple trend fitting, with scenarios driven by the pace of infrastructure letting, interest-rate sensitivity in private construction, and cement and aggregates cost pass-through. Where local data gaps appeared, we first used nearby market proxies, then corrected via interview-based reality checks on dispatch radius, job mix, and typical order sizes.
Data Validation & Update Cycle
Model outputs were validated through multiple checks to reduce the impact of any single noisy input on the final market value. We compared implied ready-mix volumes and revenues against independent signals such as delivered volume benchmarks, construction spending totals, and trade exposure for cementitious materials, then reworked assumptions when variances looked unusually large.
If a mismatch persisted, we revisited assumptions and, when needed, re-contacted respondents to confirm pricing, utilization, or end-use splits. Each report is refreshed annually, and interim updates are made when material events occur, including major stimulus changes, sharp cement price movements, or demand shocks. Before delivery, the latest data release pass is completed so clients receive an updated view rather than an older snapshot.
Mordor Intelligence's North America Ready Mix Concrete Market Size Compared Against Other Published Estimates
Published market values for ready-mix concrete can differ because publishers use different geography coverage, count different revenue lines, and apply price inflation differently from the base year. Timing also varies since construction cycles can shift quickly, and some studies do not always refresh base-year assumptions after new construction and pricing data become available.
The main gap comes from whether the estimate includes concrete placement services and on-site mixing revenues. In our approach, those are excluded, so the total counts only plant-batched ready-mix sales delivered to job sites, which is the same scope choice applied by Mordor Intelligence.
Benchmark comparison
| Source | Market Size | Gaps in Research Methodology |
|---|---|---|
| Mordor Intelligence | USD 72.63 B (2025) | |
| Industry Association A | USD 64.00 B (2023) | Uses a United States only revenue statement, which can understate North America totals and may reflect member and survey framing rather than a full country roll-up. |
| Regional Consultancy B | USD 181.53 B (2022) | Likely applies a broader construction materials scope or counts adjacent concrete activities, and the earlier base year combined with different price escalation assumptions can lift the stated value. |
Overall, the spread in the table is explained by scope and timing more than by arithmetic. By keeping the value build tied to clear demand signals (construction activity, delivered volume, and achievable pricing) and stress-testing those assumptions with interviews, the final number stays traceable and repeatable when the model is refreshed.
Key Questions Answered in the Report
What is the 2026 value of the North America Ready-Mix Concrete market?
It totaled USD 76.47 billion in 2026.
How fast is demand forecast to grow through 2031?
Revenue is expected to expand at a 5.29% CAGR to reach USD 98.99 billion.
Which mix type currently holds the largest revenue share?
Transit-Mixed concrete leads with 46.60% of 2025 revenue.
Which end-user sector is growing the fastest?
Residential applications are expanding at a 5.91% CAGR on sustained housing starts.
What share does the United States command?
The U.S. accounts for 84.17% of regional revenue and posts the highest 5.45% CAGR.
How are state regulations shaping product specifications?
CALGreen and New York's Buy Clean rules are driving adoption of low-carbon mixes and requiring Environmental Product Declarations.