
Market Overview
| Study Period | 2021 - 2031 |
|---|---|
| Forecast Data Period | 2026 - 2031 |
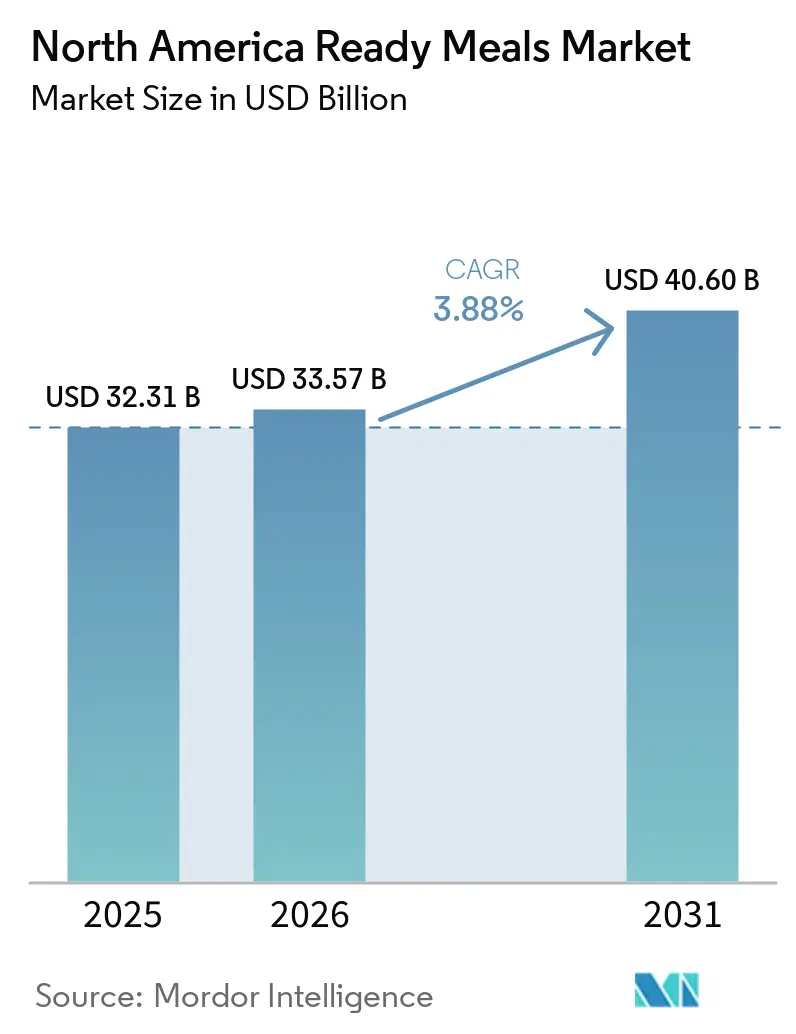
| Base Year Market Size (2025) | USD 32.31 Billion |
| Market Size (2026) | USD 33.57 Billion |
| Market Size (2031) | USD 40.60 Billion |
| Growth Rate (2026 - 2031) | 3.88 % |
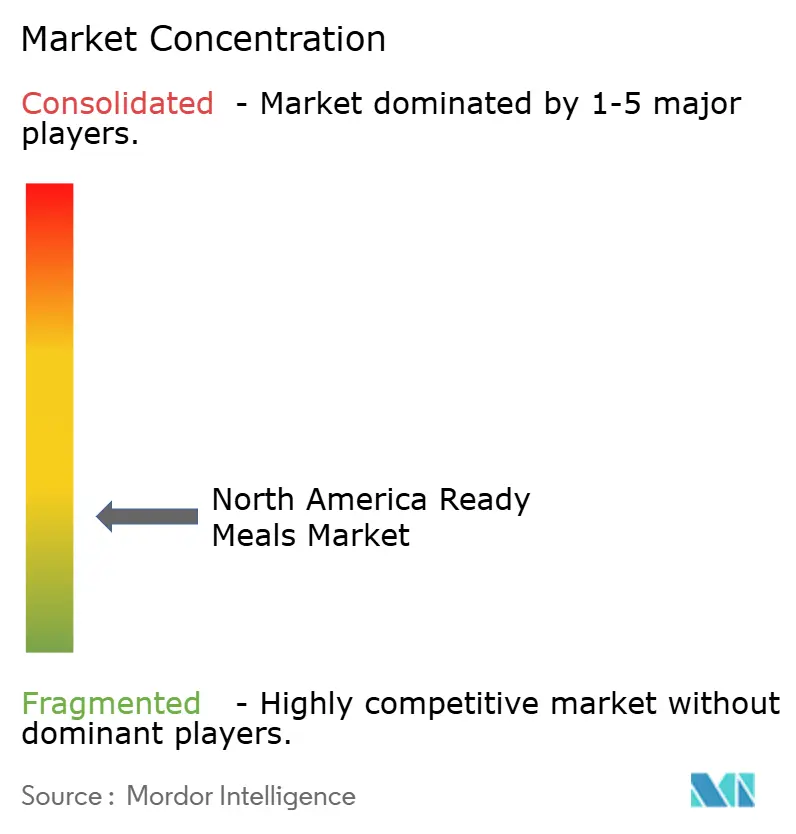
| Market Concentration | Low |
Major Players *Disclaimer: Major Players sorted in no particular order Image © Mordor Intelligence. Reuse requires attribution under CC BY 4.0. | |
North America Ready Meals Market Analysis by Mordor Intelligence
North America ready meals market size in 2026 is estimated at USD 33.57 billion, growing from 2025 value of USD 32.31 billion with 2031 projections showing USD 40.6 billion, growing at 3.88% CAGR over 2026-2031. Growth is supported by dual-income households that rely on quick meal solutions, robust cold-chain networks that keep quality intact, and packaging innovations that lengthen shelf life while protecting nutrition. Manufacturers channel these advantages into differentiated product lines that meet shifting dietary preferences, capture premium price points, and reduce food waste through better inventory turnover. Online grocery adoption lifts direct-to-consumer volume and enriches demand signals that accelerate product refresh cycles. At the same time, cost pressures from raw materials and sustainability mandates nudge players toward scale efficiencies and strategic partnerships that spread capital risk.
Key Report Takeaways
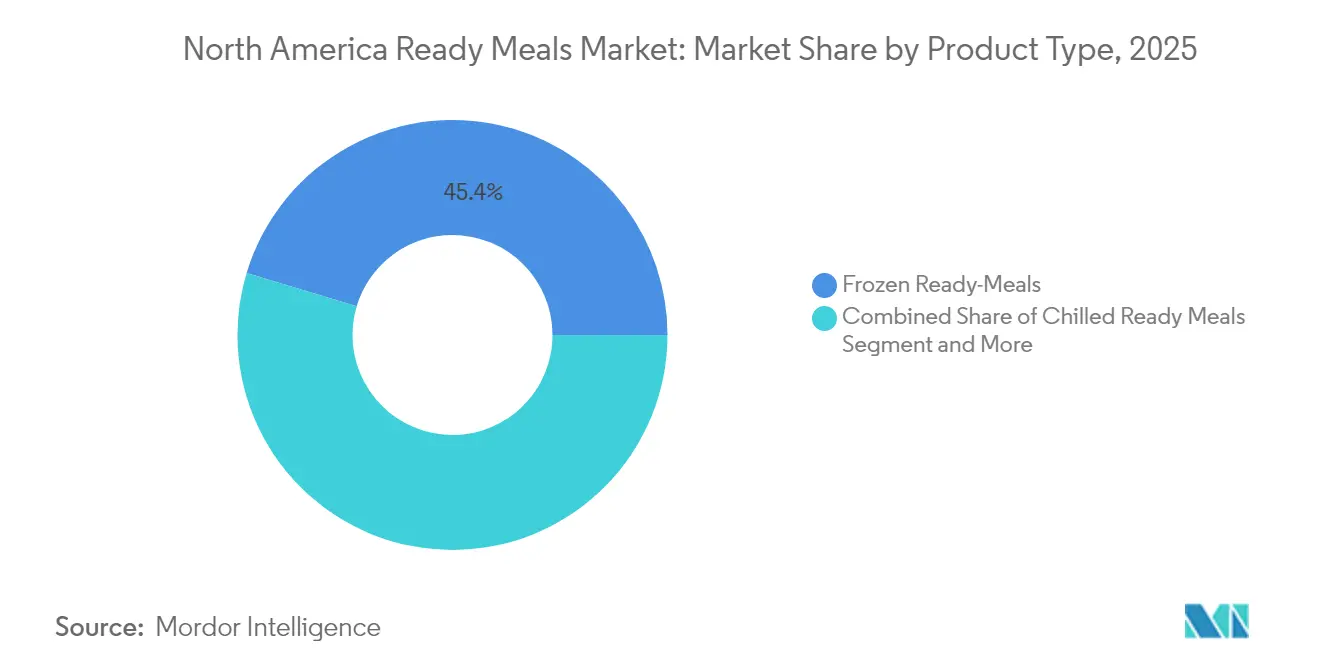
- By product type, frozen ready meals led with 45.35% revenue share in 2025; frozen options are forecast to expand at a 4.72% CAGR through 2031.
- By ingredient, conventional formulations captured 73.82% of the ready meals market share in 2025, while free-from alternatives are set to grow at a 4.07% CAGR to 2031.
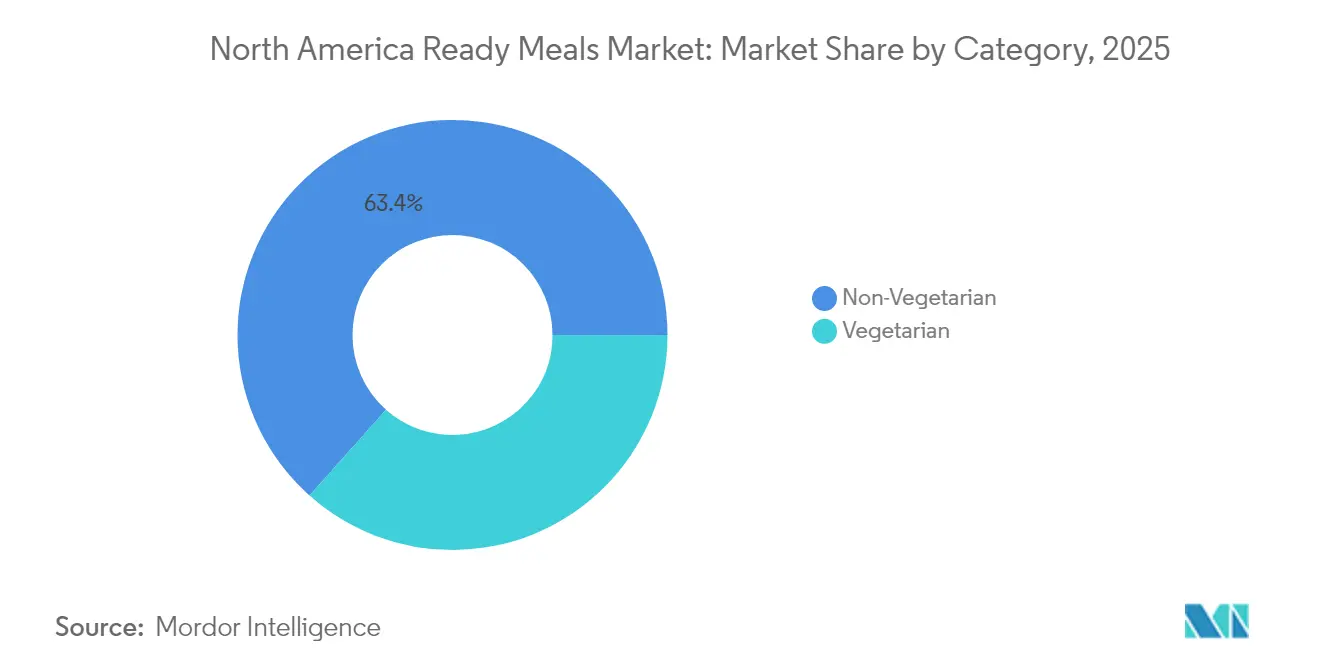
- By category, non-vegetarian lines accounted for 63.42% of the ready meals market size in 2025, whereas vegetarian offerings are advancing at a 4.49% CAGR through 2031.
- By distribution channel, supermarkets and hypermarkets held 41.26% revenue share in 2025; online retail is on track for a 4.21% CAGR between 2026 and 2031.
- By geography, the United States commanded 82.15% share of the ready meals market in 2025, while Mexico is projected to register the fastest 6.62% CAGR to 2031.
Note: Market size and forecast figures in this report are generated using Mordor Intelligence’s proprietary estimation framework, updated with the latest available data and insights as of 2026.
Market Trends and Insights
Drivers Impact Analysis of North America Ready Meals Market*
| Driver | % Impact on CAGR Forecast | Geographic Relevance | Impact Timeline |
|---|---|---|---|
| Busy dual-income lifestyles driving convenience demand | 1.2% | North America, with highest impact in US metropolitan areas | Long term (≥ 4 years) |
| Cold-chain & flash-freezing tech expanding product quality | 0.8% | Global, with early adoption in US and Canada | Medium term (2-4 years) |
| Innovation in packaging advancements | 0.7% | North America & EU regulatory markets | Medium term (2-4 years) |
| Self-heating meal packaging gains retail listings | 0.6% | US and Canada, expanding to Mexico | Short term (≤ 2 years) |
| Growing preference for ready plant-based and sustainable meals | 0.5% | US West Coast, urban Canada, Mexico City | Long term (≥ 4 years) |
| Flavor and culinary product diversification | 0.4% | North America, with ethnic population centers leading adoption | Medium term (2-4 years) |
| Source: Mordor Intelligence | |||
Busy Dual-Income Lifestyles Driving Convenience Demand
Dual-income household proliferation fundamentally reshapes meal preparation priorities, with 58% of US adults consuming breakfast at home while 18% eat on-the-go or at work, creating sustained demand for portable, heat-and-eat solutions[1]. Time-pressed consumers increasingly view cooking as discretionary rather than essential, driving premiumization opportunities for brands offering restaurant-quality flavors in convenient formats. The trend accelerates in metropolitan areas where commute times exceed 30 minutes, creating geographic pockets of concentrated demand that justify targeted distribution strategies. Demographic analysis reveals millennial and Gen Z consumers exhibit 40% higher ready meal purchase frequency compared to older cohorts, suggesting sustained growth as these segments enter peak earning years. This behavioral shift extends beyond traditional dinner occasions, with breakfast and lunch segments experiencing rapid expansion as consumers seek consistent meal solutions across dayparts.
Cold-Chain & Flash-Freezing Technology Expanding Product Quality
Advanced preservation technologies enable ready meal manufacturers to deliver fresh-equivalent taste profiles while extending shelf life to 18-24 months, fundamentally altering consumer perceptions of frozen convenience foods. NewCold's USD 1.2 billion facility expansion across North America and Lineage Logistics' successful IPO raising USD 2.4 billion demonstrate institutional confidence in cold-chain infrastructure investments[2]. UFrost's flash-freezing technology preserves cellular structure in proteins and vegetables, reducing texture degradation that historically limited frozen meal acceptance among quality-conscious consumers. Temperature-controlled distribution networks now reach 95% of North American households within 48 hours, enabling direct-to-consumer models that bypass traditional retail markups. These technological advances create competitive moats for companies investing in proprietary preservation methods, while smaller players face increasing pressure to partner with specialized cold-chain providers or risk quality deterioration that erodes brand equity.
Innovation in Packaging Advancements
Packaging innovation transcends traditional barrier protection to incorporate active heating elements, portion control mechanisms, and sustainability credentials that address evolving consumer priorities. Self-heating packaging technology achieved mainstream retail adoption in 2024, with major grocery chains allocating dedicated shelf space for heat-activated meal solutions that require no external cooking equipment[3]. Biodegradable materials derived from cornstarch, sugarcane, and bamboo are replacing petroleum-based plastics, though cost premiums of 15-25% require careful margin management and consumer education about environmental benefits. Smart packaging integration includes QR codes providing recycling instructions and freshness indicators that change color based on storage conditions, enhancing food safety while reducing waste. Regulatory compliance costs for sustainable packaging transitions range from USD 2-5 million for mid-sized manufacturers, creating consolidation pressure as smaller players struggle to absorb these investments while maintaining competitive pricing.
Self-Heating Meal Packaging Gains Retail Listings
Self-heating packaging technology represents a paradigm shift in ready meal convenience, eliminating dependence on microwave access while delivering restaurant-temperature meals in 8-12 minutes through exothermic chemical reactions. Major retail chains expanded self-heating product allocations by 300% in 2024, driven by consumer willingness to pay 20-30% premiums for ultimate portability. Military and outdoor recreation applications initially drove technology development, but workplace consumption now represents 60% of self-heating meal occasions as office buildings restrict microwave access or employees seek desk-dining solutions. Regulatory approval processes require extensive safety testing for chemical heating elements, creating 18-24 month development timelines that favor established manufacturers with regulatory expertise. The technology's success depends on achieving cost parity with traditional packaging within 3-5 years, as current production volumes limit economies of scale that would enable mass market penetration.
Restraints Impact Analysis of North America Ready Meals Market*
| Restraint | % Impact on CAGR Forecast | Geographic Relevance | Impact Timeline |
|---|---|---|---|
| High sodium/additive health concerns | -0.9% | North America, with strongest impact in health-conscious demographics | Long term (≥ 4 years) |
| Volatile raw-material & packaging costs | -0.7% | Global supply chains affecting North American manufacturers | Short term (≤ 2 years) |
| Meal-kit subscription cannibalization | -0.6% | US and Canada urban markets | Medium term (2-4 years) |
| Plastics-ban compliance raising packaging CAPEX | -0.5% | US states and Canadian provinces with environmental regulations | Medium term (2-4 years) |
| Source: Mordor Intelligence | |||
High Sodium/Additive Health Concerns
Consumer health consciousness creates formulation challenges as sodium reduction initiatives clash with flavor preservation and shelf-life requirements essential for ready meal viability. FDA guidance recommends reducing sodium content by 20-30% across processed food categories, yet sodium serves critical functions in moisture retention, microbial inhibition, and taste enhancement that cannot be easily replicated through alternative ingredients. CDC studies linking high-sodium diets to cardiovascular disease drive consumer scrutiny of nutrition labels, with 65% of health-conscious shoppers actively avoiding products exceeding 600mg sodium per serving. Reformulation costs range from USD 500,000 to USD 2 million per product line, requiring extensive taste testing, shelf-life validation, and regulatory approval processes that can delay launches by 12-18 months. Alternative preservation methods including natural antimicrobials, modified atmosphere packaging, and pH adjustment offer partial solutions but often compromise taste profiles or increase production complexity, forcing manufacturers to balance health positioning against consumer acceptance.
Volatile Raw-Material & Packaging Costs
Commodity price volatility creates margin pressure as wheat, protein, and packaging material costs fluctuate 20-40% quarterly, challenging manufacturers' ability to maintain consistent pricing while preserving profitability. Biofuel mandates divert agricultural output from food production, with corn-based ethanol requirements consuming calories sufficient for 100 million people, artificially inflating grain prices that represent 30-40% of ready meal input costs. Energy price fluctuations directly impact cold-chain logistics and manufacturing operations, with natural gas representing 15-20% of total production costs for frozen meal manufacturers. Packaging material shortages, particularly for specialized barrier films and sustainable alternatives, create supply chain disruptions that force production delays or emergency sourcing at premium prices. Forward contracting strategies provide partial hedging but require significant capital commitments that strain smaller manufacturers' working capital, creating competitive advantages for well-capitalized players who can lock in favorable pricing during market downturns.
*Our forecasts treat driver/restraint impacts as directional, not additive. The impact forecasts reflect baseline growth, mix effects, and variable interactions.
North America Ready Meals Market Segment Analysis
By Product Type:
Frozen Dominance Drives InnovationFrozen-cooked ready meals command 45.35% market share in 2025, leveraging superior shelf stability and cost efficiency that enable mass distribution through conventional retail channels. The segment's technological sophistication continues to advance through flash-freezing innovations that preserve cellular integrity, reducing the texture degradation historically associated with frozen convenience foods Progressive Grocer. Major manufacturers invest heavily in blast-freezing equipment and modified atmosphere packaging to maintain fresh-equivalent taste profiles while achieving 18-24 month shelf lives that optimize inventory management and reduce food waste. Consumer acceptance of frozen meals has shifted dramatically as quality improvements eliminate the stigma previously associated with freezer-aisle options, with premium frozen lines now competing directly against fresh prepared foods on taste and nutritional value.
Frozen ready meals simultaneously represent the fastest-growing segment at 4.72% CAGR through 2031, driven by continuous product innovation and expanding distribution reach into convenience stores and online channels. Self-heating frozen meal technology eliminates microwave dependency, addressing workplace and travel consumption occasions where heating equipment access remains limited Kvaroy Arctic. Plant-based frozen options experience particularly strong growth as manufacturers leverage freezing technology to preserve delicate plant protein textures that deteriorate rapidly in refrigerated formats. The segment benefits from economies of scale in production and distribution, enabling competitive pricing that attracts value-conscious consumers while maintaining margins sufficient for continued innovation investment.

By Ingredient:
Conventional Meals Maintain Market LeadershipConventional ready meals hold 73.82% market share in 2025, reflecting mainstream consumer preferences for familiar flavors and established protein sources that deliver predictable taste experiences. Traditional formulations benefit from decades of optimization in flavor development, preservation techniques, and cost management that enable competitive pricing across mass market channels. Conventional ingredients offer superior shelf stability and manufacturing scalability compared to specialized alternatives, allowing manufacturers to achieve economies of scale that support extensive distribution networks and promotional pricing strategies. Consumer research indicates that taste and convenience rank higher than ingredient specialization for 70% of ready meal purchasers, sustaining demand for conventional formulations despite growing health consciousness trends.
Free-from meals accelerate at 4.07% CAGR through 2031, capturing consumers with specific dietary restrictions and health-conscious purchasing behaviors willing to pay premium prices for specialized formulations. Gluten-free ready meals lead this segment's growth, driven by both medically necessary consumption and perceived health benefits among general consumers seeking cleaner ingredient profiles. Manufacturing complexity for free-from products requires dedicated production lines and specialized sourcing that creates barriers to entry, enabling established players to command premium pricing while smaller brands struggle with scale economics. Regulatory compliance for allergen-free claims demands extensive testing and documentation that adds USD 200,000-500,000 to product development costs, favoring manufacturers with existing quality assurance infrastructure and regulatory expertise.
By Category:
Non-Vegetarian Preferences Shape Market DynamicsNon-vegetarian ready meals capture 63.42% market share in 2025, reflecting North American consumers' continued preference for animal protein as the primary meal component across breakfast, lunch, and dinner occasions. Protein-forward positioning resonates with fitness-conscious demographics seeking convenient options that support muscle maintenance and satiety goals, with ready meals containing 20+ grams of protein experiencing 25% faster inventory turnover than lower-protein alternatives. Chicken-based formulations dominate this segment due to versatility, cost efficiency, and broad consumer acceptance across ethnic and regional preferences. Premium non-vegetarian options incorporating grass-fed beef, wild-caught seafood, and heritage pork varieties command 30-50% price premiums while maintaining strong velocity in natural and organic retail channels.
Vegetarian ready meals grow at 4.49% CAGR through 2031, driven by environmental consciousness, health considerations, and expanding plant-based protein options that deliver improved taste and texture profiles. Younger demographics show 40% higher vegetarian ready meal purchase rates compared to older cohorts, suggesting sustained growth as these consumers mature and increase household formation. Innovation in plant-based protein technology enables manufacturers to replicate meat-like textures and flavors that previously limited vegetarian meal acceptance among flexitarian consumers. Retail positioning strategies increasingly emphasize protein content and nutritional density rather than vegetarian labeling alone, appealing to broader consumer segments seeking healthier meal options without explicitly committing to plant-based diets.
By Distribution Channel:
Traditional Retail Dominance Faces Digital DisruptionSupermarkets and hypermarkets maintain 41.26% market share in 2025, leveraging extensive freezer space, promotional capabilities, and one-stop shopping convenience that drives impulse purchases and basket-building opportunities. These channels benefit from established relationships with major manufacturers, securing favorable pricing and promotional support that enables competitive retail pricing and frequent promotional activities. Dedicated frozen food sections provide optimal product visibility and temperature control, while end-cap displays and cross-merchandising with complementary items drive incremental sales. Private label ready meal programs generate higher margins for retailers while offering value positioning that attracts price-sensitive consumers during economic uncertainty periods.
Online retail segments accelerate at 4.21% CAGR through 2031, capturing consumers seeking convenience, variety, and subscription-based replenishment options that traditional retail cannot match. E-commerce platforms enable direct-to-consumer relationships that provide valuable consumption data and personalization opportunities for targeted marketing and product development. Cold-chain logistics investments by major e-commerce players ensure product quality during last-mile delivery, addressing historical concerns about frozen food integrity in online channels. Subscription models create predictable revenue streams while reducing customer acquisition costs, though higher fulfillment expenses require premium pricing that limits addressable market size to affluent, convenience-focused demographics.
Geography Analysis
United States and Canada Ready Meals Market
In 2025, the U.S. commands a dominant 82.15% share of the North American ready meals market. This stronghold is bolstered by a robust retail infrastructure and an extensive cold-chain network, ensuring frozen entrees are just a two-day journey from most households. With a significant portion of the population in dual-income households and the hustle of urban commuting, the appetite for quick meals has surged. Concurrently, regional health trends have paved the way for a premium market, spotlighting organic and 'free-from' products. The competitive landscape is fierce, driving brands to frequently refresh their offerings and rotate promotions, thereby enhancing consumer choices and maintaining price discipline. Canada emerges as a stable secondary market. Here, stringent health regulations and the necessity for bilingual labeling act as formidable entry barriers, safeguarding established brands. The country's foodservice sector is on an upswing, boasting a 5.4% CAGR. This growth is catalyzing a cross-channel embrace of retail ready meals, as Canadians increasingly seek to recreate dining-out experiences within their homes. Shoppers, particularly those attuned to labels, are gravitating towards premium offerings centered on clean ingredients. Furthermore, stringent governance on nutritional disclosures is fostering trust within the category.
Mexico Ready Meals Market
Mexico is making waves with an impressive 6.62% CAGR. This growth is largely driven by urbanization and a rising middle class that places a premium on convenient meal solutions. The swift rise of food-delivery apps is not only familiarizing consumers with frozen offerings but also introducing them to subscription models. Supermarkets are expanding their freezer sections, thanks to retail modernization and fresh investments in cold storage. In a market flooded with imports, local flavor adaptations are carving out a niche. While the trend of plant-forward positioning is still in its infancy, it's poised to echo the coastal trends of the U.S. as both income levels and environmental consciousness rise.
Regulatory Landscape
Ready meals sold across North America operate under increasingly prescriptive labeling and preventive-control regimes that affect formulation, claims, and packaging changeovers. In the United States, the FDA set a uniform compliance date of January 1, 2028 for final food labeling regulations published between January 1, 2025 and December 31, 2026, which provides a defined re-labeling and inventory transition window for manufacturers and private-label programs. In parallel, the FDA front-of-package nutrition labeling proposal progressed through 2025 (including an extended comment period ending July 15, 2025), reinforcing the direction of travel toward simplified nutrition signaling and supporting SKU-by-SKU label redesign cycles in high-velocity frozen and shelf-stable ready meal lines.
In Canada, the Canadian Food Inspection Agency (CFIA) enforces the Safe Food for Canadians Regulations (SFCR), consolidated as of May 26, 2026, and these requirements underpin licensing, traceability, and preventive control plan expectations for domestic production and imports. CFIA guidance for ready-to-eat (RTE) foods emphasizes Listeria monocytogenes control aligned with Health Canada policy, and product-specific benchmarks apply to RTE meats (including lethality performance targets for Salmonella reduction). As a result, brands need to align HACCP validation, sanitation programs, and finished-product testing strategies to both pathogen control and category-specific criteria. For cross-border and third-country supply, CFIA import guidance and its Automated Import Reference System (AIRS) function as a practical gatekeeper for food-specific requirements, adding compliance steps that can shift ingredient sourcing and finished-goods portfolio decisions for brands active in both the United States and Canada.
Competitive Landscape
The North America ready meals market exhibits moderate fragmentation with a concentration score of 3 out of 10, creating strategic opportunities for both consolidation and niche specialization across diverse consumer segments. Market leaders including Nestlé, HelloFresh, Kraft Heinz, Conagra, and Campbell pursue differentiated strategies ranging from premium direct-to-consumer models to mass market retail distribution, avoiding direct head-to-head competition through channel and positioning segmentation. Technology adoption patterns reveal competitive advantages for companies investing in proprietary preservation methods, AI-driven demand forecasting, and omnichannel distribution capabilities that optimize inventory management and reduce waste HelloFresh. White-space opportunities exist in specialized dietary segments, regional flavor preferences, and emerging consumption occasions where established players lack focused offerings or distribution reach.
Emerging disruptors leverage direct-to-consumer models, subscription-based replenishment, and data-driven personalization to capture market share from traditional retail-focused manufacturers. FreshRealm's USD 24 million acquisition of Marley Spoon's operational assets demonstrates infrastructure consolidation trends that enable smaller brands to access nationwide distribution without capital-intensive facility investments Progressive Grocer. Strategic partnerships between meal-kit services and traditional retailers create hybrid models that combine convenience store accessibility with subscription-based customization, challenging pure-play ready meal manufacturers to develop omnichannel capabilities. Regulatory compliance frameworks including FDA food safety modernization and extended producer responsibility for packaging create competitive moats for established players while raising entry barriers for new market entrants lacking regulatory expertise and quality assurance infrastructure.
North America Ready Meals Industry Leaders
-
Nestle SA
-
Conagra Brands, Inc.
-
The Kraft Heinz Company
-
Hello Fresh Group
-
Campbell Soup Company
- *Disclaimer: Major Players sorted in no particular order
North America Ready Meals Market Companies Covered in this Report
- Nestle SA
- HelloFresh SE
- The Kraft Heinz Company
- Conagra Brands, Inc.
- Campbell Soup Company
- General Mills Inc.
- Hormel Foods Corporation
- Unilever PLC
- Mars Incorporated
- Ebro Foods S.A.
- Nomad Foods Ltd.
- McCain Foods Ltd.
- Tyson Foods Inc.
- Amy's Kitchen Inc.
- Bakkavor Group Plc
- Ajinomoto Co., Inc.
- Maple Leaf Foods Inc.
- Pinnacle Foods (Birds Eye)
- JBS S.A.
- Dr. Oetker GmbH
Market Opportunities and Future Outlook
Manufacturing whitespace is emerging around shelf-stable and frozen formats that fit omnichannel distribution, particularly where retort and IQF capabilities are constrained. In March 2026, private-label producer Dainty Foods announced its first US manufacturing operation in Batavia Township, Ohio, backed by an initial USD 85 million investment and positioned around retort pouches, cups, and bowls. The announcement signals retailer and brand demand for scalable heat-and-eat platforms beyond traditional trays. In February 2026, Seenergy Foods expanded with a second production facility in Ontario and launched an IQF pasta line, reinforcing another route to broaden ready-meal component supply (grains, pasta, beans) and support faster menu rotation and SKU variety while maintaining freezer performance.
Process and product development toolchains are also moving toward faster iteration, which creates room for brands that can shorten development cycles while staying aligned with food safety documentation. Foodservice-facing forums in 2026 showcased practical AI use cases for identifying menu gaps and accelerating product development workflows, supporting faster flavor iteration and tighter alignment to regional preferences, particularly in the United States where the market has the largest share. At the same time, pull from portability-focused packaging (including self-heating concepts already gaining listings) and continued sodium/additive scrutiny are steering innovation toward reformulation, clearer nutrition communication, and packaging redesign. Players that can manage labeling changeovers alongside cost-effective material transitions also have an operational pathway to protect cold-chain integrity across retail and direct-to-consumer channels.
Recent Industry Developments in North America Ready Meals Market
- June 2026: Conagra Brands announced a broad 2026 innovation lineup across its frozen foods and grocery portfolio, emphasizing convenience-led formats and bolder flavor profiles. The expanded pipeline raises competitive pressure in the freezer aisle and increases the pace of SKU refresh across key retail accounts.
- June 2025: Conagra Brands completed the divestiture of its Chef Boyardee brand to Hometown Food Company, while retaining licensing for frozen skillet meals. The divestiture sharpened Conagra's portfolio focus and preserved participation in select frozen meal occasions tied to the brand.
- July 2024: Mars Food and Nutrition expanded the Ben's Original portfolio with single-serve rice cups and additional Street Food flavors. The rollout reinforced single-serve, time-saving meal components that can be paired with ready meals and supports broader convenience-led merchandising in retail.
North America Ready Meals Market Report Scope and Research Methodology
Market Definition and Coverage
For this study, the market covers ready meals sold across North America, counted as packaged, pre-prepared meal solutions that can be heated or served quickly, and then consumed at home or on the go.
Scope exclusions: We exclude meal kits that need meaningful cooking, fresh deli counter meals sold by weight, and restaurant-prepared meals sold for immediate consumption.
Segments Covered in This Report
- By Product Type
- Frozen Ready Meals
- Chilled Ready Meals
- Shelf Stable
- Freeze-dried Ready Meals
- By Ingredient
- Conventional Meals
- Free-from Meals
- By Category
- Vegeterian
- Non-Vegeterian
- By Distribution Channel
- Supermarkets/ Hypermarkets
- Convenience Stores
- Online Retailers
- Other Distribution Channel
- By Geography
- United States
- Canada
- Mexico
- Rest of North America
Data Sources, Market Sizing, and Validation
Desk Research
Desk work started with setting a clear perimeter around ready meals and mapping how the category is tracked in public statistics. We referred to sources such as the USDA and Economic Research Service, the US International Trade Commission DataWeb for trade flows, Statistics Canada for packaged food spending indicators, and the Government of Canada trade data portal for cross-border movements.
To ground assumptions on packaged food demand and price movement, we also used inflation and consumer spending series from the US Bureau of Labor Statistics and the US Bureau of Economic Analysis, along with industry association publications and reputable retail and food press coverage. Company annual reports and investor decks were used to understand category mix, pricing actions, and distribution emphasis, then to sanity check the direction of the model. In a few cases, we also used paid subscriptions for company financials and patent databases to confirm scale signals and innovation focus. These are illustrative sources, and many other public and secondary references were also reviewed to collect data points, validate assumptions, and clarify gaps.
Primary Interviews and Surveys
Primary work was used to test how ready meals are defined in practice and how revenues split across frozen, chilled, and shelf-stable offerings, as well as across retail and foodservice channels. We spoke with a mix of manufacturers, ingredient and packaging participants, distributors, and retail category teams across the United States, Canada, and Mexico, then cross-checked points where desk sources were thin. Inputs from these discussions helped us lock realistic price ladders, promotion intensity, and how newer formats are being counted in reported sales.
Distribution of primary research fieldwork respondents
| Company type | Respondent position |
|---|---|
| Top tier: 30% | CXOs: 14% |
| Mid tier: 52% | Functional/Unit leaders: 27% |
| Smaller Players: 18% | Managers: 59% |
Market-Sizing & Forecasting
The sizing model starts with a top-down build where packaged food consumption signals are reconstructed into a ready meals demand pool for North America, then refined using category structure and channel split logic. Once the initial total is formed, it is corroborated with selective bottom-up checks, such as sampled average selling price by format multiplied by estimated volumes and a roll-up of public revenue cues from a set of relevant suppliers and brands.
A few inputs that materially shape the totals include the share of frozen and chilled ready meals in overall packaged meals, the pace of price increases and trade-down behavior, retail penetration versus foodservice contribution, and product mix shifts toward single-serve versus family packs. We also track convenience-driven purchase frequency, freezer capacity constraints in stores, and trade and import signals for prepared foods as supporting indicators. For forecasts, scenario analysis is used so base-case growth follows agreed drivers from interviews, and tighter or faster paths are stress-tested using different pricing and volume assumptions. Where bottom-up detail is missing, gaps are handled through conservative interpolation using nearby category ratios that were validated in calls.
Data Validation & Update Cycle
Model outputs are checked against independent signals such as category spending direction, price indexes, and trade movement patterns, then we run variance checks to flag abnormal jumps by year, country, or channel. If a mismatch is found, assumptions are revisited and, when needed, respondents are re-contacted to confirm what changed, such as pricing actions or reclassification of meal formats.
Before sign-off, the work goes through multi-step internal review so totals reconcile with the definition and the implied drivers remain consistent. Reports are refreshed annually, and interim updates are made when material events affect demand, pricing, or distribution. Before delivery, a final analyst pass is completed so clients receive the latest updated view.
Mordor Intelligence's North America Ready Meals Market Sizing Compared With Other Published Estimates
Published values for North America ready meals do not always match because firms often group adjacent food categories together, pick different base years, and apply different price inflation paths. Differences also come from how retail-only numbers are treated versus totals that also include foodservice, and from how quickly assumptions are refreshed.
Some published figures widen the scope by folding in meal kits, prepared salads, and broader ready-to-eat items, which pushes the total up even if growth is similar. In Mordor Intelligence, the count is limited to ready meals as packaged meal solutions that are quickly heated or served, and meal kits and deli-prepared counter meals are left out, which keeps the total tied to a repeatable demand pool and clearer pricing logic.
Benchmark comparison
| Source | Market Size | Gaps in Research Methodology |
|---|---|---|
| Mordor Intelligence | USD 32.31 B (2025) | |
| Industry Press Release A | USD 54.38 B (2023) | Often reflects an earlier base year and can include a wider set of prepared meal formats, with price growth carried forward from a different inflation window. |
| Industry Profile B | USD 52.15 B (2022) | Commonly uses a prepared meals definition that may blend chilled and deli-style prepared items and applies exchange rates from a single reference year, which can shift the USD total. |
The spread in the table is mainly explained by what is counted as a ready meal and how pricing and currency timing are handled. By keeping inclusions consistent and linking totals to observable demand and pricing signals, we can provide a number that is easier to audit and reuse for planning.
Key Questions Answered in the Report
What is the current value of the North America ready meals market?
The ready meals market size stands at USD 33.57 billion in 2026.
How fast is the category expected to grow over the next five years?
It is projected to expand at a 3.88% CAGR, pushing value to USD 40.6 billion by 2031.
Which product segment is growing the quickest?
Frozen ready meals lead growth at a 4.72% CAGR through 2031.
Why are dual-income households important to category demand?
Time-pressed dual-income families purchase heat-and-eat meals more frequently, driving sustained volume growth.