
North America Quinoa Seeds Market Analysis by Mordor Intelligence
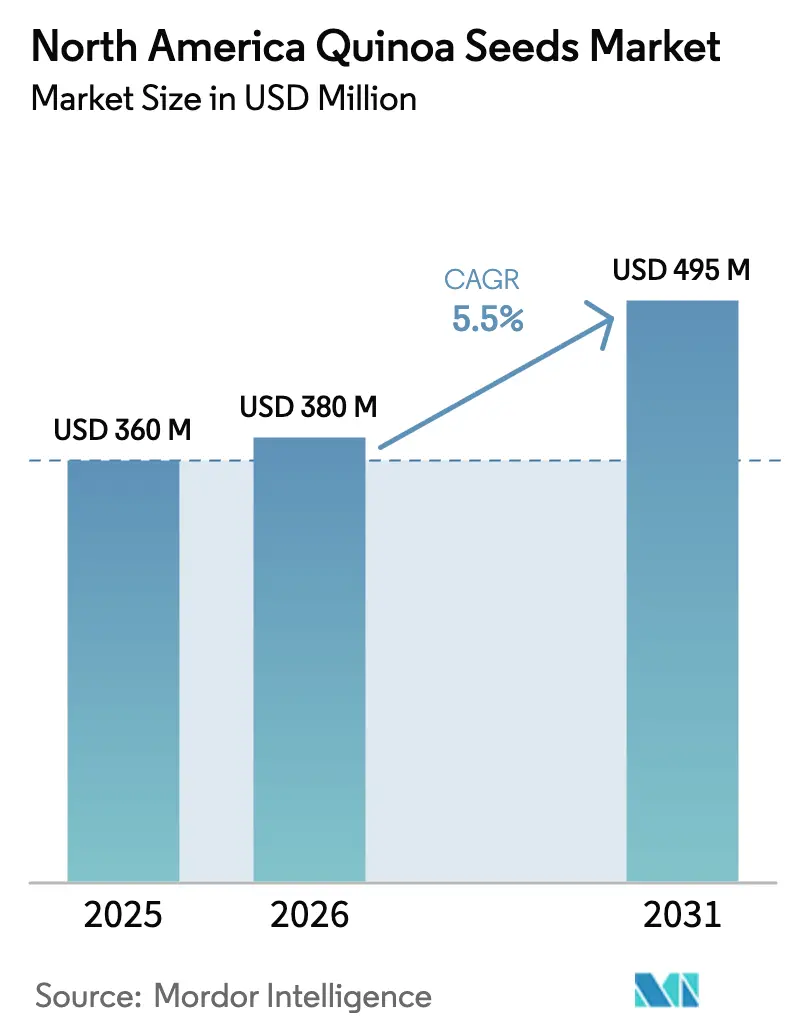
The North America quinoa seeds market size was valued at USD 360.0 million in 2025 and estimated to grow from USD 380.0 million in 2026 to reach USD 495.0 million by 2031, at a CAGR of 5.5% during the forecast period (2026-2031). A widening consumer base for gluten-free and high-protein grains underpins demand, while acreage gains in Colorado, Washington, Oregon, Saskatchewan, and Alberta signal a gradual supply response. Imports from Peru and Bolivia remain pivotal because specialized cleaning and desaponification assets are scarce in the Pacific Northwest and Prairie provinces. Currency swings within the United States–Mexico–Canada Agreement (USMCA) zone reshape sourcing decisions each season, and government programs such as the United States Department of Agriculture Specialty Crop Block Grant continue to lower entry barriers for new growers. Improved agronomic practices and varietal adaptation for North American climates are gradually narrowing quinoa’s yield gap versus imported supply, supporting better price competitiveness.
Key Report Takeaways
By geography, the United States held 72% of the North America quinoa seeds market share in 2025, while Mexico is projected to grow at a 7.4% CAGR to 2031.
Note: Market size and forecast figures in this report are generated using Mordor Intelligence’s proprietary estimation framework, updated with the latest available data and insights as of January 2026.
Market Trends and Insights
Drivers Impact Analysis of North America Quinoa Seeds Market*
| Driver | (~) % Impact on CAGR Forecast | Geographic Relevance | Impact Timeline |
|---|---|---|---|
| Rising consumer demand for gluten-free, high-protein grains | +1.2% | United States and Canada, urban clusters | Medium term (2-4 years) |
| Expansion of domestic quinoa acreage in United States and Canada | +0.9% | Colorado, Washington, Oregon, Saskatchewan, and Alberta | Long term (≥ 4 years) |
| Government incentives for climate-smart specialty crops | +0.7% | United States and Canada | Short term (≤ 2 years) |
| Import-tariff volatility favoring local production | +0.6% | United States, Canada, and Mexico | Short term (≤ 2 years) |
| Rapid growth of online bulk-grain marketplaces | +0.5% | United States and Canada | Short term (≤ 2 years) |
| Precision-ag breeding raises yields and seed quality | +0.2% | University research stations in the United States and Canada | Long term (≥ 4 years) |
| Source: Mordor Intelligence | |||
Rising Consumer Demand for Gluten-Free, High-Protein Grains
Urban consumers across North America are channeling grocery spending toward ancient grains that combine gluten-free positioning with complete amino acid profiles. Quinoa’s 14-18% protein content and lysine richness support premium pricing in ready-to-eat meals, protein bars, and bakery mixes. United States gluten-free sales kept a double-digit trajectory through 2025, boosted by celiac diagnoses and lifestyle adopters who value gut-health and allergen transparency. The food-service sector echoes this pull, inserting quinoa into salad bars and grain bowls that create steady, year-round demand. Together, these outlets help domestic growers compete with Andean imports, even though production costs remain two to three times higher than wheat or oats [1].
Expansion of Domestic Quinoa Acreage in United States and Canada
Specialty-crop growers in semi-arid zones are pivoting toward quinoa as a higher-margin substitute for wheat and barley. Cold-tolerant lines from Colorado State University and Washington State University enable plantings above 40° N latitude, and Agriculture and Agri-Food Canada backs Prairie trials where long daylight hours drive photosynthesis [3]. United States Department of Agriculture Specialty Crop Block Grant funds of USD 72.9 million in fiscal 2025 underwrote variety evaluation, soil-health work, and market access projects.
Government Incentives for Climate-Smart Specialty Crops
Federal and provincial programs reward crops that sequester carbon, improve soil structure, and reduce reliance on synthetic inputs. Quinoa aligns well, due to its deep taproot and suitability for reduced-till systems. United States Department of Agriculture (USDA) climate-smart commodity grants and Agriculture and Agri-Food Canada (AAFC) cost-share schemes for organic transition support grower adoption, although the three-year organic certification window strains cash flow. The result is a two-tier supply base, with capital-rich farms capturing subsidies while smaller operators struggle.
Rapid Growth of Online Bulk-Grain Marketplaces
Digital platforms specializing in organic and ancient grains now connect small growers with artisan bakers, meal-kit services, and health retailers. Aggregated supply, real-time pricing, and split-shipment logistics shrink order minimums, letting niche buyers bypass conventional elevators that lack quinoa-dedicated lines. Growers capture varietal premiums by selling red, black, and tri-color quinoa separately rather than blending them. The surge in direct-to-consumer sales during 2024-2025 strengthens this channel.
Restraints Impact Analysis of North America Quinoa Seeds Market*
| Restraint | (~) % Impact on CAGR Forecast | Geographic Relevance | Impact Timeline |
|---|---|---|---|
| Limited processing capacity in Prairie and Pacific Northwest | −0.8% | Saskatchewan, Alberta, Washington, and Oregon | Medium term (2-4 years) |
| High production costs vs. mainstream grains | −0.6% | All United States and Canadian quinoa zones | Long term (≥ 4 years) |
| Climate variability and pest pressure | −0.7% | Pacific Northwest, Colorado, and Prairie provinces | Short term (≤ 2 years) |
| Narrow genetic base and Intellectual Property (IP) constraints on elite seed | −0.5% | Breeding programs throughout North America | Long term (≥ 4 years) |
| Source: Mordor Intelligence | |||
Limited Processing Capacity in Prairie and Pacific Northwest
The absence of dedicated quinoa cleaning and desaponification facilities requires growers to transport raw seeds over long distances, leading to higher freight costs and increased risk of moisture damage. Conventional grain elevators prioritize wheat, barley, and canola, leaving quinoa to compete for off-season slots or surrender organic premiums through co-mingling. Capital spending on specialized lines lags because processors want multi-year supply contracts that growers hesitate to sign amid price swings, especially in Saskatchewan, Alberta, Washington, and Oregon.
Climate Variability and Pest Pressure
Peronospora variabilis outbreaks in Washington and Oregon cut yields by up to 50% during wet springs, undermining profitability. Spores survive on residue and spread by wind, complicating rotations and pushing growers toward fungicides that conflict with organic goals. Unpredictable rainfall shifts sowing windows, while late-season heat triggers premature flowering. Elevated crop-insurance premiums and absence of extension support deter acreage expansion in high-risk zones.
*Our forecasts treat driver/restraint impacts as directional, not additive. The impact forecasts reflect baseline growth, mix effects, and variable interactions.
Geography Analysis
Western United States Quinoa Seeds Market
The United States anchors the North America quinoa seeds market with 72% value share in 2025, due to its large consumer base, dense natural-foods retail network, and broad food-service penetration. Domestic output remains concentrated in Colorado, Washington, Oregon, and California, where cold-tolerant lines reduce season-length risk. United States Department of Agriculture Specialty Crop Block Grant funds in 2025 strengthen local trials and supply-chain upgrades, yet the strong United States dollar keeps imported products competitive [2]. Growth through 2031 will be moderate as processing capacity constraints offset relentless consumer demand for gluten-free and high-protein foods.
Prairie Canada Quinoa Seeds Market
Canada commands a smaller but steady share, with acreage clustered in Saskatchewan and Alberta. Agriculture and Agri-Food Canada (AAFC) cost-share funding supports organic transitions and on-farm trials, while long summer daylight hours aid photosynthesis. Frost risk and limited cleaning infrastructure remain hurdles. Exports to Japan and South Korea offer price premiums tied to traceability, and domestic demand rises in metro centers such as Toronto and Vancouver.
Northern and Western Mexico Quinoa Seeds Market
Mexico is the fastest-growing geography, set for a 7.4% CAGR to 2031. A 23.4% Mexican peso depreciation in 2024 locked in cost advantages for Andean imports but also stirred interest among Mexican processors in local sourcing to hedge exchange risk. Manufacturers in Monterrey and Guadalajara blend quinoa into tortillas, cereals, and snack bars, appealing to middle-class consumers who link the grain with premium nutrition and indigenous heritage. Future momentum depends on building domestic processing assets and stable seed supply as phytosanitary checks and currency shifts complicate imports.
Regulatory Landscape
In the United States, quinoa entering commerce as a grain raw agricultural commodity is covered by the Food Safety Modernization Act (FSMA) framework, including the Foreign Supplier Verification Program (FSVP) for importers. This places documented supplier verification and hazard-control accountability on importers. For planting material, USDA APHIS import requirements under 7 CFR 319.37 govern permits and phytosanitary conditions for seeds and other plants for planting, which shapes how Andean-origin quinoa seed lots move into North American production channels.
In Canada, pedigreed quinoa seed production and varietal purity management are anchored in the Seeds Regulations and the Canadian Seed Growers Association (CSGA) Circular 6 standards for quinoa, including specified isolation distances (Foundation: 200 m; Registered/Certified: 100 m) that affect field layout and contracting. Import and domestic handling also intersect with the Safe Food for Canadians Regulations (SFCR) and Canadian Food Inspection Agency (CFIA) oversight for food business activities and food import steps, while plant protection requirements condition cross-border movement of seed and grain based on pest and soil risks.
Value Chain Analysis
The North America quinoa seeds value chain combines a sizable import channel with a smaller but expanding domestic production base in the United States (notably Colorado, Washington, Oregon, and California) and Canada (Saskatchewan and Alberta). Upstream inputs include pedigreed seed, agronomy support from universities and extension programs, and crop protection choices that reflect organic positioning. Farm-level output then routes to cleaning, color sorting, and desaponification, a critical midstream step where limited dedicated capacity in the Pacific Northwest and Prairie provinces forces long-haul moves and increases the risk of quality loss or organic co-mingling.
Downstream, product moves through ingredient distributors, branded packers, natural and conventional retail, food service, and fast-growing online bulk-grain marketplaces that support identity-preserved lots (red, black, tri-color) and smaller shipment sizes. Importers and larger handlers carry the compliance burden for food safety and documentation (FSMA/FSVP in the United States and CFIA/SFCR process controls in Canada). Trade data continues to reflect reliance on external supply, with the United States importing about USD 103 million of quinoa in 2025, led by Peru and Bolivia. Value capture and bottlenecking concentrate in processing and assurance, including traceability, organic integrity, and pathogen/pest risk management, where investment in dedicated lines and testing capability supports higher realized prices and more stable contracting for growers.
Competitive Landscape
The North America Quinoa Seeds Market exhibits fragmented competition. Employee-owned Bob’s Red Mill retains strong brand equity and direct-to-consumer reach in quinoa-based ingredients, while diversified grain platform Ardent Mills continues to scale through vertical integration. Seed specialists such as Territorial Seed Company and Adaptive Seeds focus on varietal innovation for organic growers, guarding niche footholds outside heavy processing.
Investment white-space centers on processing hubs in Washington, Oregon, Saskatchewan, and Alberta. Facilities equipped for cleaning, color sorting, and desaponification could capture toll-processing revenue and secure long-term contracts with growers anxious to avoid cross-contamination. Online bulk-grain marketplaces disrupt legacy distribution by directly connecting growers to artisan bakers, meal-kit firms, and natural-foods retailers. Precision-agriculture tools lower production risk, and genomic platforms accelerate trait stacking for disease tolerance.
United States–Mexico–Canada Agreement (USMCA) tariff-free treatment of quinoa enables seamless regional trade, but exchange-rate shifts and phytosanitary protocols favor processors that maintain dual sourcing from North American growers and Andean exporters. Strategic seed-manufacturer partnerships with food companies are emerging, delivering proprietary varieties optimized for extrusion snacks or gluten-free baking mixes. Consolidation will continue to advance as larger entities purchase regional mills and seed firms, while niche operators defend positions through varietal uniqueness, sustainability certifications, and direct-to-consumer storytelling.
Market Opportunities and Future Outlook
Processing and identity-preserved handling remain the clearest investment whitespace across Washington, Oregon, Saskatchewan, and Alberta. Dedicated cleaning and desaponification capacity is scarce relative to grower interest and premium retail and ingredient demand. As a result, toll-processing, contract cleaning, and certified organic segregation represent near-term opportunities for regional operators that can serve both domestic growers and import flows that require consistent saponin removal and specification control.
On the supply side, public research and grant-backed programs are expanding the production toolbox for North American growers, linking opportunity to capability-building rather than only demand pull. In 2026, North Carolina A&T State University launched a USDA-funded project applying drone and sensor-based monitoring and precision nutrient approaches to improve quinoa yield and quality, and it also received a USDA grant to provide practical production guidance for farmers. In parallel, USDA-led work on rapid genetic diagnostics for downy mildew strengthens seed and field screening, supporting breeding and quality assurance pathways that reduce crop-loss risk in humid and disease-prone zones. Together, these initiatives support commercialization pathways for locally adapted varieties and more predictable domestic supply lots that can be marketed into gluten-free, plant-based, and premium-traceability channels alongside continued reliance on Peru and Bolivia for base volumes.
Recent Industry Developments in North America Quinoa Seeds Market
- May 2026: North Carolina A&T State University received a USD 600,000 USDA grant to provide practical guidance for North Carolina farmers interested in quinoa production. The program expands extension-style support into a new US geography for quinoa, improving the pipeline for trial acreage, on-farm learning, and standardized production practices.
- March 2026: NorQuin opened contracting for the 2026 season quinoa production across Western Canada. Earlier and broader contracting supports acreage planning and aggregation in Saskatchewan and Alberta, helping stabilize supply for processors and food manufacturers seeking regional sourcing options.
- August 2024: Saco Foods completed the acquisition of Quinoa Corporation, including the Ancient Harvest brand. The deal strengthened a larger food platform in quinoa-based and gluten-free offerings, increasing the importance of scale procurement, packaging, and brand distribution capabilities in the regional quinoa value chain.
North America Quinoa Seeds Market Report Scope and Research Methodology
Market Definition and Coverage
For this study, the market covers the sales value of quinoa seeds across North America, counted when quinoa is traded and sold as seed for food use through retail, foodservice, and ingredient supply chains.
Scope exclusions: Quinoa-based processed foods (such as snacks, cereals, and ready meals) are excluded when they are priced and sold as finished products rather than as quinoa seed.
Segments Covered in This Report
- By Geography
- United States
- Production Analysis (Area Harvested, Yield, and Production Volume)
- Consumption Analysis (Consumption Value and Volume)
- Import Market Analysis (Import Value, Volume, and Key Supplying Markets)
- Export Market Analysis (Export Value, Volume, and Key Destination Markets)
- Wholesale Price Trend Analysis and Forecast
- Regulatory Framework
- List of Key Players
- Logistics and Infrastructure
- Seasonality Analysis
- Canada
- Production Analysis (Area Harvested, Yield, and Production Volume)
- Consumption Analysis (Consumption Value and Volume)
- Import Market Analysis (Import Value, Volume, and Key Supplying Markets)
- Export Market Analysis (Export Value, Volume, and Key Destination Markets)
- Wholesale Price Trend Analysis and Forecast
- Regulatory Framework
- List of Key Players
- Logistics and Infrastructure
- Seasonality Analysis
- Mexico
- Production Analysis (Area Harvested, Yield, and Production Volume)
- Consumption Analysis (Consumption Value and Volume)
- Import Market Analysis (Import Value, Volume, and Key Supplying Markets)
- Export Market Analysis (Export Value, Volume, and Key Destination Markets)
- Wholesale Price Trend Analysis and Forecast
- Regulatory Framework
- List of Key Players
- Logistics and Infrastructure
- Seasonality Analysis
- United States
Data Sources, Market Sizing, and Validation
Desk Research
Desk research was used to set the demand and supply context and to keep assumptions realistic before we moved to interviews. We referenced public sources such as USDA and Statistics Canada releases, Mexico trade and agriculture bulletins where available, UN Comtrade-style customs statistics, and FAO datasets to understand production, import dependence, and trade flows.
We also reviewed company filings and investor presentations from seed and packaged food participants, along with association websites and trusted food and agriculture press to track pricing direction, new product activity, and distribution changes. In a few cases, subscription databases were used for company financials and structured news tracking, and an import-export shipment-level database was used selectively to sanity-check trade patterns. These examples are illustrative rather than exhaustive, and many other sources were also used for data collection, validation, and clarification.
Primary Interviews and Surveys
Primary work focused on interviews and structured questionnaires with quinoa seed suppliers, importers and distributors, ingredient buyers, and retail and foodservice channel participants across the United States, Canada, and Mexico. Inputs were used to confirm use-case splits, typical contract terms, and realistic price bands, and then to pressure-test assumptions taken from public statistics, especially where trade and pricing data lag.
Responses were also used to align the model on what is counted as quinoa seed versus adjacent products (for example, blended grains), and to validate short-term demand shifts linked to health positioning, private label activity, and supply seasonality.
Distribution of primary research fieldwork respondents
| Company type | Respondent position |
|---|---|
| Top tier: 36% | CXOs: 17% |
| Mid tier: 44% | Functional/Unit leaders: 27% |
| Smaller Players: 20% | Managers: 56% |
Market-Sizing & Forecasting
Sizing starts from a top-down build where production, import-export flows, and apparent consumption signals are used to reconstruct the quinoa seed demand pool for North America, and then allocated by the most observed buying routes. That view is then corroborated with selective bottom-up approximations using sampled supplier revenue checks and volume times average selling price (ASP) math, which helps correct for reporting lags and informal trade.
Key inputs that shaped the model included import volumes and values, domestic cultivation and yield signals, retail and ingredient demand indicators, observed pack and bulk price spreads, and channel mix shifts between direct seed consumption and processing demand. Since prices move differently across organic versus conventional and across bulk versus packaged seed, ASPs were normalized to a consistent unit and time window before totals were finalized.
Forecasts were built using scenario analysis supported by short historical trend lines, then adjusted based on interview feedback around acreage intentions, expected import availability, and price pass-through limits. Where bottom-up data points were missing for smaller routes to market, gaps were handled by using conservative channel shares and cross-checking the implied per capita consumption against trade-based totals.
Data Validation & Update Cycle
Model outputs were checked against independent signals like trade value progression, implied average prices, and changes in cultivation activity, and then reviewed for variances that did not match what interviewees were seeing on the ground. When outliers were found, assumptions were revisited, the calculations were rerun, and follow-up calls were triggered to confirm whether the move was a one-off event or a sustained shift.
A multi-step internal review is followed before sign-off so that definitions, units, and currency conversions stay consistent across years. The report is refreshed annually, and interim updates are made when a material event affects supply, trade rules, or pricing. Before delivery, an analyst performs a fresh pass so clients receive the latest updated view rather than an older snapshot.
Mordor Intelligence's North America Quinoa Seeds Market Sizing Compared With Other Published Estimates
Published numbers for this market often look far apart because teams do not always use the same year timing, price basis, and product boundary when they convert volumes into value. Even within North America, the split between bulk ingredient demand and retail packs can change the implied ASP a lot, which then changes the final market total.
The biggest gap drivers usually come from refresh cadence and currency timing, followed by how ASPs are formed (spot prices versus blended contract pricing) and whether trade values are cleaned for re-exports and mixed grain shipments. When inputs are updated to a consistent calendar and then checked against channel pricing, the spread tightens, which is where the annual refresh and validation cadence applied by Mordor Intelligence shows up in the final number.
Benchmark comparison
| Source | Market Size | Gaps in Research Methodology |
|---|---|---|
| Mordor Intelligence | USD 0.36 B (2025) | |
| Trade Publisher A | USD 0.11 B (2023) | Uses an earlier base year and a narrower revenue view that appears to emphasize direct seed consumption, which lowers the ASP-weighted total versus a broader seed sales boundary. |
| Industry Analyst B | USD 0.38 B (2026) | Anchors the estimate on a forward year and applies a long-range low-growth view, and the pricing build is not clearly normalized across bulk and retail packs, which shifts the value outcome. |
Taken together, the spread is mainly explained by timing and price construction, not by a disagreement that quinoa seed demand exists. Our approach stays transparent by keeping units consistent, normalizing ASPs to a clear period, and then cross-checking results with trade and channel feedback so the final number can be replicated step by step.
Key Questions Answered in the Report
What is the current value of the North America quinoa seed market?
The market is valued at USD 380 million in 2026 and is forecast to reach USD 495 million by 2031.
Which country holds the largest share of North American quinoa demand?
The United States controls 72% of regional market value, driven by its sizable consumer base and extensive retail and food-service networks.
What is the fastest-growing geography for quinoa in North America?
Mexico is projected to expand at a 7.4% CAGR through 2031 as rising middle-class incomes and urbanization boost demand for functional grains.
Why are imports still critical to North America quinoa supply?
Limited domestic cleaning and de-saponification capacity, combined with favorable currency moves, keeps imports from Peru and Bolivia cost-competitive.