Market Overview
| Study Period | 2017 - 2030 |
|---|---|
| Base Year For Estimation | 2024 |
| Forecast Data Period | 2025 - 2030 |
| Market Size (2025) | USD 8.36 Billion |
| Market Size (2030) | USD 10.41 Billion |
| Growth Rate (2025 - 2030) | 4.48% CAGR |
| Market Concentration | Low |
Major Players*Disclaimer: Major Players sorted in no particular order Image © Mordor Intelligence. Reuse requires attribution under CC BY 4.0. |
|

North America Protein Market Analysis by Mordor Intelligence
The North America Protein Market size is estimated at 8.36 billion USD in 2025, and is expected to reach 10.41 billion USD by 2030, growing at a CAGR of 4.48% during the forecast period (2025-2030).
The North American protein market continues to be shaped by evolving consumer preferences and dietary patterns, with traditional animal-based proteins maintaining a strong presence alongside growing plant protein alternatives. Recent consumer studies indicate that approximately 80% of U.S. adult consumers in 2022 still preferred conventional protein sources like pork, beef, poultry, and fish as their primary protein sources. This preference coexists with an increasing openness to protein diversification, particularly among younger demographics who are embracing flexitarian diets that combine both animal and plant-based proteins. The market's dynamics reflect this dual trend, with manufacturers expanding their protein portfolios to cater to both traditional preferences and emerging dietary patterns.
Innovation in protein sources and processing technologies is driving significant market developments, with companies investing heavily in research and development to improve protein functionality and application versatility. In 2024, Roquette demonstrated this trend by introducing NUTRALYS® Fava S900M, a novel fava bean protein isolate, marking a significant advancement in plant-based protein alternatives. Similarly, Arla Foods Ingredients secured FDA approval for their whey protein hydrolysates in infant formula applications, showcasing the industry's commitment to expanding protein applications in specialized nutrition segments. These innovations are particularly focused on enhancing functional protein solubility, taste profiles, and nutritional value to meet evolving consumer expectations.
Industry collaboration and sustainability initiatives are becoming increasingly prominent in shaping the market landscape. A notable example is the 2024 strategic investment by Protein Industries Canada in collaboration with Roquette, Prairie Fava, BioNeutra, and Plant Up, aimed at improving the efficiency of food products and developing innovative protein ingredients. The animal feed sector has also embraced sustainable practices, with North America leading global compound feed production at approximately 261 million tons in 2022, representing a 20.6% share of global production. These collaborative efforts are driving improvements in protein extraction efficiency, reducing environmental impact, and developing more sustainable protein sources.
The market is witnessing expanded applications across various sectors, with particularly strong growth in personal care and cosmetics applications. The presence of 6.8 million Americans suffering from hair-related conditions such as alopecia areata has driven increased demand for collagen protein-based personal care products, especially those containing collagen peptides and other specialized protein derivatives. This trend has led to the development of innovative protein-enriched formulations in hair care, skincare, and cosmetic products, demonstrating the versatility of protein applications beyond traditional food and feed markets. Manufacturers are responding by developing specialized protein ingredients that cater to these emerging applications while maintaining focus on functionality and efficacy.
North America Protein Market Trends and Insights
The consumption growth of animal protein is fueling opportunities for key players in the ingredients segment
- Despite the rising vegan population, the demand for animal protein has been steady in the United States. The majority of protein in the American diet comes from beef and poultry, followed by dairy. In 2022, 80% of US adult consumers preferred pork, beef, poultry, and fish as their main protein sources. Due to its water-binding properties, the market is majorly driven by the growing usage of gelatin in the functional food industry.
- Consumers continue to demand traditional protein options, but they are signaling an expectation of the animal protein industry to do more to address environmental concerns. With a wide range of applications and consumer preferences toward a healthy lifestyle, many US ingredient manufacturers are trying to enter the collagen market, which is the major reason for the increase in per capita consumption patterns. From 2019 to 2021, the unadjusted prevalence of doctor-diagnosed arthritis in the United States was 24.2% among women and 17.9% among men. Owing to the prevalence of arthritis in the region, there is an increasing demand for collagen-based supplements for bone and joint health.
- Value-added dairy products drive the per capita consumption of milk protein in Canada. Fluid milk, cheese, cream, and yogurt are the dairy products mainly consumed in the country. In 2022, domestic cow milk consumption amounted to 10,243 thousand MT. The marketing year 2022-2023 sales data indicated that Canadians spent more on whole milk (3.25 % butterfat), less skim milk (0% butterfat), and reduced-fat milk. Canadians eat a moderate amount of red meat. Per capita consumption of beef and poultry is high in Canada compared to pig meat and sheep meat.

Understand The Key Trends Shaping This Market
Download PDF
Meat and milk production contribute majorly as raw materials for animal protein ingredients
- The graph given depicts the production data for raw materials such as meat of cattle, pigs, and chicken (with bone, fresh or chilled), raw milk from cattle and goats, skim milk from cows, and dry whey powder. In 2023, 2,408,7 pounds of milk was produced per cow, an increase of 1.30% from 23,777 pounds in 2020. As of 2022, the average number of milk cows in the United States was 9,402. Milk is usually separated through various processes into components and processed into fluid beverage milk or the manufacture of other dairy products.
- The United States is the world's largest producer of chicken meat and accounted for a 20% share of global chicken meat production in 2023. Cattle meat is one of the most common sources of collagen, providing a significant amount of this unique protein. With the largest fed-cattle industry in the world, the United States is also the world's largest producer of cattle meat, primarily high-quality, grain-fed cattle meat for domestic and export use.
- Nearly 70% of Canada’s milk production is concentrated in Quebec and Ontario. Milk produced in Canada supplies two markets: the fluid milk market, which includes fluid milk for direct consumption, creams, and flavored milk, and the industrial milk market. FAS/Canada forecasts total milk production to reach 10.310 million metric tons (MMT) in 2024, a modest increase from the 2023 estimate of 10.265 MMT. Canada’s meat processing companies manufacture a wide variety of meat products, ranging from fresh and frozen meat to processed, smoked, canned, and cooked meats. About 70% of processed meats in Canada, such as sausages or cold cuts, are made with pork.

Understand The Key Trends Shaping This Market
Download PDF
OTHER KEY INDUSTRY TRENDS COVERED IN THE REPORT
- Organic baby food is expected to drive the market in the future
- Fortified beverages are expected to witness a rise in sales during the forecast period
- An increase in the demand for single-serve packets may augment production
- Dairy alternatives are expected to witness a significant growth rate
- Great opportunities for meat alternative products
- Key players are focusing more on healthy ingredients post the COVID-19 pandemic
- Steady demand from the United States to support market growth
- Plant protein consumption growth fuels opportunities for key players in the ingredients industry
- Large commercial players lead the growth of the bakery industry
- Consumer shift toward low-carb diets poses a threat to market growth
- Key players are expected to focus on fortification and nutritional enrichment
- The emphasis on awareness and innovation is one of the major growth drivers of the elderly nutrition market
- E-commerce is expected to emerge as one of the most preferred channels
- Sport/performance nutrition to witness significant growth during the forecast period
- The cosmetic industry to be driven by synergy of innovation and social media influence
- Soy, wheat, and rice production contribute majorly as raw materials for plant protein ingredient manufacturers
Segment Analysis: Source
Plant Protein Segment in North America Protein Market
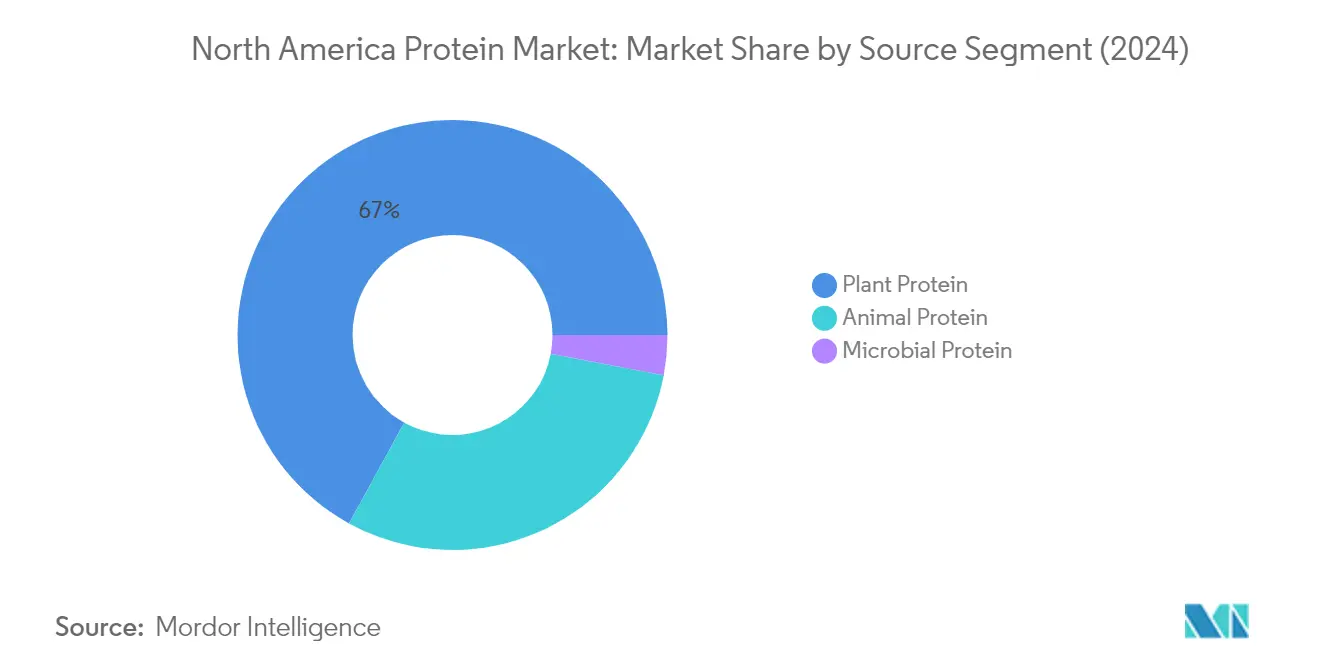
Plant proteins continue to dominate the North American protein market, commanding approximately 67% market share in 2024. This significant market position is primarily driven by the abundant availability and functionality of key plant protein sources like soy protein, wheat, and pea protein. The segment's leadership is further strengthened by growing consumer preference for vegan protein sources, with manufacturers increasingly incorporating plant proteins into various food and beverage applications. The rising awareness about sustainability, health consciousness, and animal welfare has led to a progressive shift toward plant-based diets in the region. Major food manufacturers are responding to this trend by expanding their plant protein portfolios and developing innovative plant-based products to meet evolving consumer preferences.
Microbial Protein Segment in North America Protein Market
The microbial protein segment is emerging as the most dynamic category in the North American protein market, projected to grow at approximately 7% during 2024-2029. This remarkable growth is primarily driven by increasing demand from the supplements segment, particularly for algae protein products. The segment's expansion is supported by continuous innovation in production technologies and new market entrants introducing novel microbial protein solutions. Manufacturers are investing in research and development to improve the functionality and application scope of microbial proteins, particularly in sports nutrition and specialty food products. The segment is also benefiting from growing consumer acceptance of alternative protein sources and increasing awareness about the sustainability benefits of microbial proteins.
Remaining Segments in Source Segmentation
The animal protein segment maintains a significant presence in the North American protein market, serving as a traditional protein source across various applications. This segment encompasses a diverse range of products including whey protein, casein, collagen, gelatin, and egg protein, each serving specific functional and nutritional requirements in different applications. The segment's stability is supported by its well-established supply chain and widespread acceptance in conventional food processing applications. Animal proteins continue to be particularly important in sports nutrition, infant formula, and specialized dietary applications, where specific amino acid profiles and functional properties are required.
Segment Analysis: End User
Food & Beverages Segment in North America Protein Market
The Food & Beverages segment continues to dominate the North American protein market, commanding approximately 52% market share in 2024. This substantial market position is primarily driven by the meat and meat alternatives sub-segment, along with the growing beverage and bakery sectors. The segment's prominence is further reinforced by increasing consumer demand for protein-fortified foods and beverages, particularly in categories like dairy alternatives, sports nutrition products, and functional foods. Manufacturers are actively responding to this demand by introducing innovative protein-enriched products across various food categories, including snacks, beverages, and bakery items. The segment's growth is also supported by the rising trend of clean-label products and plant-based alternatives in the food and beverage industry.
Personal Care & Cosmetics Segment in North America Protein Market
The Personal Care & Cosmetics segment is emerging as the fastest-growing segment in the North American protein market, projected to expand at a CAGR of approximately 7% during 2024-2029. This remarkable growth is primarily attributed to the increasing incorporation of protein-based ingredients in skincare, haircare, and cosmetic products. The segment's expansion is driven by growing consumer awareness about the benefits of protein-enriched personal care products, particularly those containing collagen and other specialized protein ingredients. Manufacturers are increasingly focusing on developing innovative protein-based formulations that cater to specific cosmetic applications, while also addressing the rising demand for natural and sustainable beauty solutions.
Remaining Segments in End User Segmentation
The Animal Feed and Supplements segments represent significant portions of the North American protein market, each contributing uniquely to the overall market dynamics. The Animal Feed segment maintains a strong presence due to the continuous demand from livestock and aquaculture industries, while the Supplements segment is driven by increasing health consciousness and sports nutrition trends. Both segments are experiencing notable developments in terms of product innovation and formulation improvements, particularly in areas such as specialized feed solutions and targeted nutritional supplements. These segments continue to evolve with changing consumer preferences and increasing focus on quality and sustainability in protein ingredients.
North America Protein Market Geography Segment Analysis
North America Protein Market in United States
The United States dominates the North American protein market, commanding approximately 83% of the total market volume in 2024. The country's market leadership is driven by high product consolidation and an active competitive landscape, where companies are continuously strengthening their presence through strategic acquisitions, production capacity expansions, and portfolio diversification. The market is particularly influenced by evolving consumer preferences and changing dietary patterns stemming from increased health consciousness. A notable trend is the growing emphasis on protein-fortified foods, with manufacturers innovating across various product categories, including cookies, brownies, chips, and other snack items. The market's robust growth is further supported by substantial research and development investments, particularly in emerging protein ingredients and processing technologies. Additionally, the country's well-established distribution networks and advanced manufacturing capabilities continue to attract both domestic and international protein ingredient manufacturers, fostering a highly competitive and innovative market environment.
North America Protein Market in Mexico
Mexico emerges as the most dynamic market in the region, projected to achieve a remarkable CAGR of approximately 7% from 2024 to 2029. The country's protein market is experiencing a significant transformation driven by changing consumer preferences and increasing awareness about food safety, environmental sustainability, and animal welfare. The market shows particular strength in plant protein, with manufacturers actively developing innovative products to meet growing demand. Mexican consumers are increasingly embracing alternative protein sources, reflecting a broader shift in dietary preferences and health consciousness. The country's food processing industry is rapidly adapting to these changes by incorporating new protein ingredients into traditional Mexican food products. Local manufacturers are also benefiting from increased foreign investment and technological transfers, enabling them to produce higher quality protein ingredients. The government's supportive policies toward food industry modernization and sustainability initiatives are further catalyzing market growth.
North America Protein Market in Canada
Canada's protein market demonstrates remarkable dynamism, driven by consumers' increasing push for diversification of protein sources. The country has established itself as a hub for plant protein innovation, with substantial investments in research and development of alternative protein sources. Canadian consumers are actively seeking protein-enriched products, particularly those derived from sustainable and locally sourced ingredients. The market benefits from strong government support, including significant investments in protein processing infrastructure and research facilities. The country's robust agricultural sector, combined with advanced food processing capabilities, positions it favorably in the protein ingredients market. Canadian manufacturers are particularly successful in developing innovative protein applications across various food categories, from dairy alternatives to meat substitutes. The market also benefits from the country's strict quality standards and food safety regulations, which have helped establish Canadian protein products as premium offerings in both domestic and international markets.
North America Protein Market in Other Countries
The protein market in other North American countries, including Jamaica, Cuba, Panama, Costa Rica, the Dominican Republic, and Guatemala, represents an emerging opportunity within the region. These markets are characterized by growing awareness of protein-enriched products and increasing demand for both traditional and alternative protein sources. The food and beverage industry in these countries shows particular interest in meat alternatives and plant protein, reflecting changing consumer preferences across the region. Local manufacturers are gradually adopting new technologies and processes to enhance their protein processing capabilities. While these markets are currently smaller compared to the major North American countries, they demonstrate significant potential for growth, particularly in specialized protein ingredients for specific applications. The increasing presence of international protein manufacturers and rising investment in local production facilities are helping to develop these markets, while also introducing innovative protein solutions that cater to local tastes and preferences.
Get Analysis on Important Geographic Markets
Download PDF
Competitive Landscape
Top Companies in North America Protein Market
The North American protein market features prominent players like Archer Daniels Midland Company, International Flavors & Fragrances, CHS Inc., Bunge Limited, and Kerry Group PLC leading the industry through various strategic initiatives. Companies are heavily investing in product innovations, particularly in plant protein and specialized nutritional solutions, to meet evolving consumer preferences and dietary requirements. Operational agility is demonstrated through the establishment of state-of-the-art manufacturing facilities and R&D centers, enabling rapid response to market demands and efficient scaling of production. Strategic moves predominantly focus on strengthening distribution networks and forming partnerships with regional players to enhance market penetration. Geographic expansion strategies include building new production facilities, especially in key markets like the United States and Canada, while also investing in emerging segments like alternative protein and specialized nutritional solutions.
Consolidated Market with Strong Regional Players
The North American protein market exhibits a moderately fragmented structure, characterized by a mix of global conglomerates and specialized regional players. Large multinational corporations like ADM and IFF leverage their extensive research capabilities and global supply chains to maintain market leadership, while regional specialists such as Milk Specialties Global and Farbest-Tallman Foods Corporation carve out niches through specialized product offerings and local market expertise. The market demonstrates active consolidation through mergers and acquisitions, with companies seeking to expand their product portfolios and strengthen their market positions.
The competitive landscape is marked by significant vertical integration, with many players controlling multiple aspects of the value chain from raw material sourcing to end-product distribution. Companies are increasingly pursuing strategic partnerships and joint ventures to access new technologies, expand their geographic reach, and enhance their production capabilities. The market also sees continuous entry of innovative startups, particularly in the plant-based and alternative protein segments, leading to increased competition and market dynamism.
Innovation and Sustainability Drive Future Growth
For incumbent players to maintain and expand their market share, focus on sustainable sourcing practices and investment in next-generation protein technologies is crucial. Companies need to strengthen their research and development capabilities to create innovative protein ingredients solutions that address specific nutritional needs and consumer preferences. Building strong relationships with raw material suppliers, investing in advanced processing technologies, and developing efficient distribution networks are essential strategies for market success. Additionally, establishing strategic partnerships with food manufacturers and maintaining regulatory compliance will be critical for long-term growth.
New entrants and challenger brands can gain ground by focusing on specialized market segments and developing unique value propositions. Success factors include investing in novel protein sources, particularly plant-based and alternative proteins, while ensuring product quality and competitive pricing. Companies must also consider potential regulatory changes regarding protein sourcing and labeling requirements, while building strong relationships with end-users in growing segments like sports nutrition and functional foods. The ability to adapt to changing consumer preferences and maintain operational flexibility will be crucial for sustained market presence.
North America Protein Industry Leaders
-
Archer Daniels Midland Company
-
Bunge Limited
-
CHS Inc.
-
International Flavors & Fragrances, Inc.
-
Kerry Group PLC
- *Disclaimer: Major Players sorted in no particular order

Need More Details on Market Players and Competitors?
Download PDF
Recent Industry Developments
- August 2024: Global dairy co-operative Fonterra and natural ingredient manufacturer Superbrewed Food have teamed up to boost sustainable food production. The partnership combines Superbrewed’s biomass protein platform with Fonterra’s dairy processing, ingredients, and application expertise to develop additional nutrient-rich, functional biomass protein.
- July 2024: Arla Foods Ingredients has secured US Food & Drug Administration approval for the use of whey protein hydrolysates that support allergy management and gut comfort in infant formula. The FDA agreed that four ingredients in the company’s Peptigen® and Lacprodan® ranges meet the definition of peptones in the US Code of Federal Regulations and are permitted for use in early-life nutrition.
- May 2024: Roquette introduced NUTRALYS® Fava S900M, a fava bean protein isolate, in Europe and North America. The company added this product to its NUTRALYS® plant protein range, marking it as the first protein isolate derived from fava beans in its lineup.
North America Protein Market Report Scope
Animal, Microbial, Plant are covered as segments by Source. Animal Feed, Food and Beverages, Personal Care and Cosmetics, Supplements are covered as segments by End User. Canada, Mexico, United States are covered as segments by Country.
Source
| Animal | By Protein Type | Casein and Caseinates |
| Collagen | ||
| Egg Protein | ||
| Gelatin | ||
| Insect Protein | ||
| Milk Protein | ||
| Whey Protein | ||
| Other Animal Protein | ||
| Microbial | By Protein Type | Algae Protein |
| Mycoprotein | ||
| Plant | By Protein Type | Hemp Protein |
| Pea Protein | ||
| Potato Protein | ||
| Rice Protein | ||
| Soy Protein | ||
| Wheat Protein | ||
| Other Plant Protein |
End User
| Animal Feed | ||
| Food and Beverages | By Sub End User | Bakery |
| Beverages | ||
| Breakfast Cereals | ||
| Condiments/Sauces | ||
| Confectionery | ||
| Dairy and Dairy Alternative Products | ||
| Meat/Poultry/Seafood and Meat Alternative Products | ||
| RTE/RTC Food Products | ||
| Snacks | ||
| Personal Care and Cosmetics | ||
| Supplements | By Sub End User | Baby Food and Infant Formula |
| Elderly Nutrition and Medical Nutrition | ||
| Sport/Performance Nutrition | ||
Country
| Canada |
| Mexico |
| United States |
| Rest of North America |
| Source | Animal | By Protein Type | Casein and Caseinates |
| Collagen | |||
| Egg Protein | |||
| Gelatin | |||
| Insect Protein | |||
| Milk Protein | |||
| Whey Protein | |||
| Other Animal Protein | |||
| Microbial | By Protein Type | Algae Protein | |
| Mycoprotein | |||
| Plant | By Protein Type | Hemp Protein | |
| Pea Protein | |||
| Potato Protein | |||
| Rice Protein | |||
| Soy Protein | |||
| Wheat Protein | |||
| Other Plant Protein | |||
| End User | Animal Feed | ||
| Food and Beverages | By Sub End User | Bakery | |
| Beverages | |||
| Breakfast Cereals | |||
| Condiments/Sauces | |||
| Confectionery | |||
| Dairy and Dairy Alternative Products | |||
| Meat/Poultry/Seafood and Meat Alternative Products | |||
| RTE/RTC Food Products | |||
| Snacks | |||
| Personal Care and Cosmetics | |||
| Supplements | By Sub End User | Baby Food and Infant Formula | |
| Elderly Nutrition and Medical Nutrition | |||
| Sport/Performance Nutrition | |||
| Country | Canada | ||
| Mexico | |||
| United States | |||
| Rest of North America | |||
Need A Different Region or Segment?
Customize Now
Market Definition
- End User - The Protein Ingredients Market operates on a B2B basis. Food, Beverages, Supplements, Animal Feed, and Personal Care & Cosmetic manufacturers are considered to be end-consumers in the market studied. The scope excludes manufacturers buying liquid/dry whey to be used for application as a binding agent or thickener or other non-protein applications.
- Penetration Rate - Penetration Rate is defined as the percentage of Protein-Fortified End User Market Volume in the Overall End User Market Volume.
- Average Protein Content - Average protein content is the average protein content present per 100 g of product manufactured by all end-user companies considered under the scope of this report.
- End User Market Volume - End-user market volume is the consolidated volume of all types and forms of end-user products in the country or region.
| Keyword | Definition |
|---|---|
| Alpha-lactalbumin (α-Lactalbumin) | It is a protein that regulates the production of lactose in the milk of almost all mammalian species. |
| Amino acid | It is an organic compound that contains both amino and carboxylic acid functional groups, which are required for the synthesis of body protein and other important nitrogen-containing compounds, such as creatine, peptide hormones, and some neurotransmitters. |
| Blanching | It is the process of briefly heating vegetables with steam or boiling water. |
| BRC | British Retail Consortium |
| Bread improver | It is a flour-based blend of several components with specific functional properties designed to modify dough characteristics and give quality attributes to bread. |
| BSF | Black Soldier Fly |
| Caseinate | It is a substance produced by adding an alkali to acid casein, a derivative of casein. |
| Celiac disease | Celiac disease is an immune reaction to eating gluten, a protein found in wheat, barley, and rye. |
| Colostrum | It is a milky fluid that’s released by mammals that have recently given birth before breast milk production begins. |
| Concentrate | It is the least processed form of protein and has a protein content ranging from 40-90% by weight. |
| Dry protein basis | It refers to the percentage of "pure protein" present in a supplement after the water in it is completely removed through heat. |
| Dry whey | It is the product resulting from drying fresh whey which has been pasteurized and to which nothing has been added as a preservative. |
| Egg protein | It is a mixture of individual proteins, including ovalbumin, ovomucoid, ovoglobulin, conalbumin, vitellin, and vitellenin. |
| Emulsifier | It is a food additive that facilitates the blending of foods that are immiscible with one another, such as oil and water. |
| Enrichment | It is the process of addition of micronutrients that are lost during the processing of the product. |
| ERS | Economic Research Service of the USDA |
| Extrusion | It is the process of forcing soft mixed ingredients through an opening in a perforated plate or die designed to produce the required shape. The extruded food is then cut to a specific size by blades. |
| Fava | Also known as Faba, it is another word for yellow split beans. |
| FDA | Food and Drug Administration |
| Flaking | It is a process in which typically a cereal grain (like corn, wheat, or rice) is broken down into grits, cooked with flavors and syrups, and then pressed into flakes between cooled rollers. |
| Foaming agent | It is a food ingredient that makes it possible to form or maintain a uniform dispersion of a gaseous phase in a liquid or solid food. |
| Foodservice | It refers to the part of the food industry which includes businesses, institutions, and companies which prepare meals outside the home. It includes restaurants, school and hospital cafeterias, catering operations, and many other formats. |
| Fortification | It is the deliberate addition of micronutrients that are not found in them naturally or which are lost during processing, to improve a food product's nutritional value. |
| FSANZ | Food Standards Australia New Zealand |
| FSIS | Food Safety and Inspection Service |
| FSSAI | Food Safety and Standards Authority of India |
| Gelling agent | It is an ingredient that functions as a stabilizer and thickener to provide thickening without stiffness through the formation of gel. |
| GHG | Greenhouse Gas |
| Gluten | It is a family of proteins found in grains, including wheat, rye, spelt, and barley. |
| Hemp | It is a botanical class of Cannabis sativa cultivars grown specifically for industrial or medicinal use. |
| Hydrolysate | It is a form of protein manufactured by exposing the protein to enzymes that can partially break the bonds between the protein's amino acids and break down large, complicated proteins into smaller pieces. Its processing makes it easier and quicker to digest. |
| Hypoallergenic | It refers to a substance that causes fewer allergic reactions. |
| Isolate | It is the purest and most processed form of protein which has undergone separation to obtain a pure protein fraction. It typically contains ≥ 90% of protein by weight. |
| Keratin | It is a protein that helps form hair, nails, and the outer layer of skin. |
| Lactalbumin | It is the albumin contained in milk and obtained from whey. |
| Lactoferrin | It is an iron‑binding glycoprotein that is present in the milk of most mammals. |
| Lupin | It is the yellow legume seeds of the genus Lupinus. |
| Millenial | Also known as Generation Y or Gen Y, it refers to the people born from 1981 to 1996. |
| Monogastric | It refers to an animal with a single-compartmented stomach. Examples of monogastric include humans, poultry, pigs, horses, rabbits, dogs, and cats. Most monogastric are generally unable to digest much cellulose food materials such as grasses. |
| MPC | Milk protein concentrate |
| MPI | Milk protein isolate |
| MSPI | Methylated soy protein isolate |
| Mycoprotein | Mycoprotein is a form of single-cell protein, also known as fungal protein, derived from fungi for human consumption. |
| Nutricosmetics | It is a category of products and ingredients that act as nutritional supplements to care for skin, nails, and hair natural beauty. |
| Osteoporosis | It is a medical condition in which the bones become brittle and fragile from loss of tissue, typically as a result of hormonal changes, or deficiency of calcium or vitamin D. |
| PDCAAS | Protein digestibility-corrected amino acid score (PDCAAS) is a method of evaluating the quality of a protein based on both the amino acid requirements of humans and their ability to digest it. |
| Per-capita consumption of animal protein | It is the average amount of animal protein (such as milk, whey, gelatin, collagen, and egg proteins) that is readily available for consumption by each person in an actual population. |
| Per-capita consumption of plant protein | It is the average amount of plant protein (such as soy, wheat, pea, oat, and hemp proteins) that is readily available for consumption by each person in an actual population. |
| Quorn | It is a microbial protein manufactured using mycoprotein as an ingredient, in which the fungus culture is dried and mixed with egg albumen or potato protein, which acts as a binder, and then is adjusted in texture and pressed into various forms. |
| Ready-to-Cook (RTC) | It refers to food products that include all of the ingredients, where some preparation or cooking is required through a process that is given on the package. |
| Ready-to-Eat (RTE) | It refers to a food product prepared or cooked in advance, with no further cooking or preparation required before being eaten. |
| RTD | Ready-to-Drink |
| RTS | Ready-to-Serve |
| Saturated fat | It is a type of fat in which the fatty acid chains have all single bonds. It is generally considered unhealthy. |
| Sausage | It is a meat product made of finely chopped and seasoned meat, which may be fresh, smoked, or pickled and which is then usually stuffed into a casing. |
| Seitan | It is a plant-based meat substitute made out of wheat gluten. |
| Softgel | It is a gelatin-based capsule with a liquid fill. |
| SPC | Soy protein concentrate |
| SPI | Soy protein isolate |
| Spirulina | It is a biomass of cyanobacteria that can be consumed by humans and animals. |
| Stabilizer | It is an ingredient added to food products to help maintain or enhance their original texture, and physical and chemical characteristics. |
| Supplementation | It is the consumption or provision of concentrated sources of nutrients or other substances that are intended to supplement nutrients in the diet and is intended to correct nutritional deficiencies. |
| Texturant | It is a specific type of food ingredient that is used to control and alter the mouthfeel and texture of food and beverage products. |
| Thickener | It is an ingredient that is used to increase the viscosity of a liquid or dough and make it thicker, without substantially changing its other properties. |
| Trans fat | Also called trans-unsaturated fatty acids or trans fatty acids, it is a type of unsaturated fat that naturally occurs in small amounts in meat. |
| TSP | Textured soy protein |
| TVP | Textured vegetable protein |
| WPC | Whey protein concentrate |
| WPI | Whey protein isolate |
Need More Details on Market Definition?
Ask a Question
Research Methodology
Mordor Intelligence follows a four-step methodology in all our reports.
- Step-1: Identify Key Variables: The quantifiable key variables (industry and extraneous) pertaining to the specific product segment and country are selected from a group of relevant variables & factors based on desk research & literature review; along with primary expert inputs. These variables are further confirmed through regression modeling (wherever required).
- Step-2: Build a Market Model: In order to build a robust forecasting methodology, the variables and factors identified in Step-1 are tested against available historical market numbers. Through an iterative process, the variables required for market forecast are set and the model is built on the basis of these variables.
- Step-3: Validate and Finalize: In this important step, all market numbers, variables and analyst calls are validated through an extensive network of primary research experts from the market studied. The respondents are selected across levels and functions to generate a holistic picture of the market studied.
- Step-4: Research Outputs: Syndicated Reports, Custom Consulting Assignments, Databases & Subscription Platforms

Get More Details On Research Methodology
Download PDF


