
Market Overview
| Study Period | 2020 - 2031 |
|---|---|
| Forecast Data Period | 2026 - 2031 |
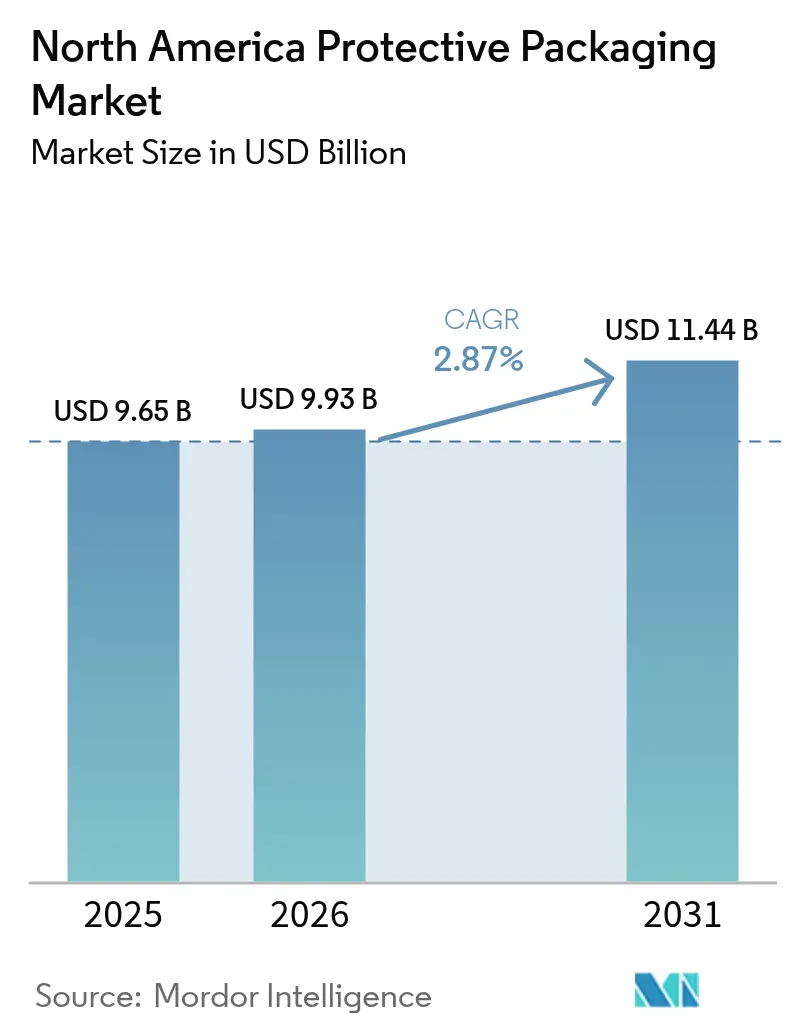
| Base Year Market Size (2025) | USD 9.65 Billion |
| Market Size (2026) | USD 9.93 Billion |
| Market Size (2031) | USD 11.44 Billion |
| Growth Rate (2026 - 2031) | 2.87 % |
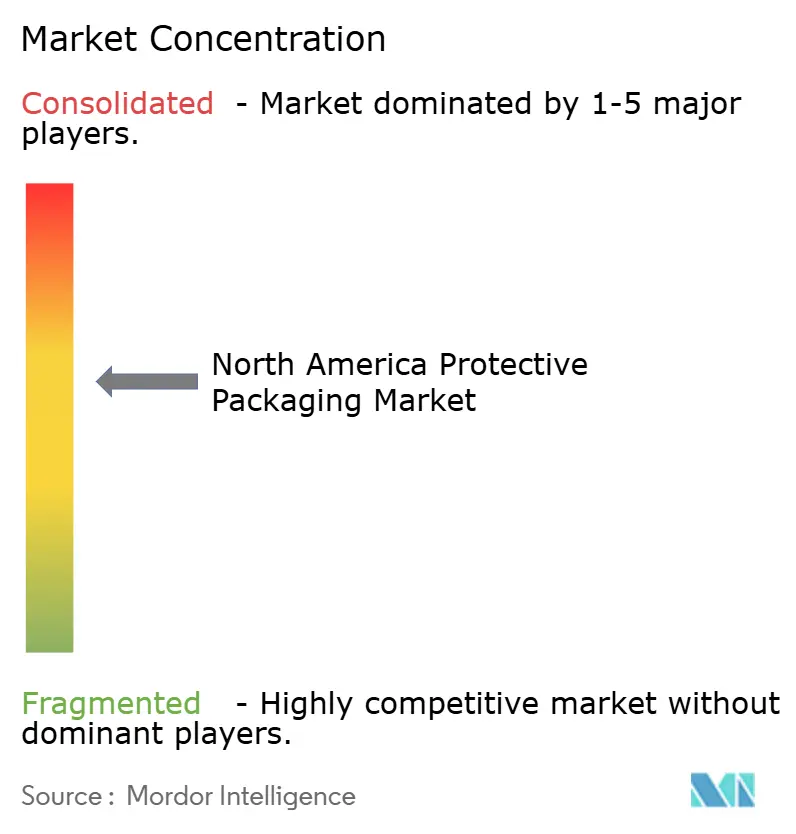
| Market Concentration | Medium |
Major Players *Disclaimer: Major Players sorted in no particular order Image © Mordor Intelligence. Reuse requires attribution under CC BY 4.0. | |
North America Protective Packaging Market Analysis by Mordor Intelligence
The North America protective packaging market size is expected to grow from USD 9.65 billion in 2025 to USD 9.93 billion in 2026 and is forecast to reach USD 11.44 billion by 2031 at 2.87% CAGR over 2026-2031. This trajectory reflects a landscape where dimensional-weight freight rules, e-commerce fulfillment automation, and sustainability mandates each pull demand in different directions. Flexible formats gain favor as carriers price by volume and parcel hubs automate cube optimization, while cold-chain expansion in food and pharmaceuticals unlocks premium opportunities for insulated and foam solutions. At the same time, volatile resin prices and stringent single-use plastics bans temper growth, forcing suppliers to recalibrate material portfolios and pricing strategies. M&A activity continues as scale proves critical for absorbing cost spikes, funding R&D in bio-based substrates, and meeting retailer requirements for end-to-end packaging automation.
Key Report Takeaways
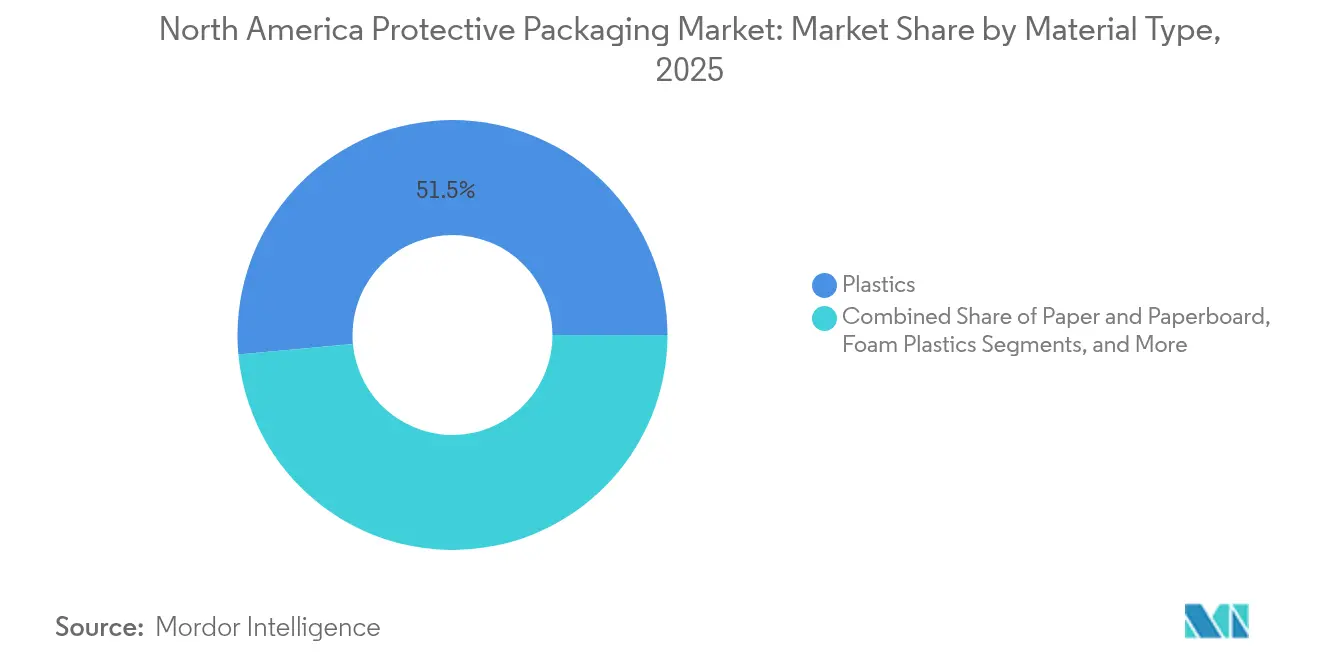
- By material type, plastics led with 51.45% of the North America protective packaging market share in 2025, while bio-based and compostable materials are projected to grow at a 5.49% CAGR through 2031.
- By product type, flexible formats held 46.12% of the North America protective packaging market size in 2025; foam products are set to expand at a 4.38% CAGR to 2031.
- By functionality, cushioning commanded 39.25% share of the North America protective packaging market size in 2025, and insulation is advancing at a 4.79% CAGR through 2031.
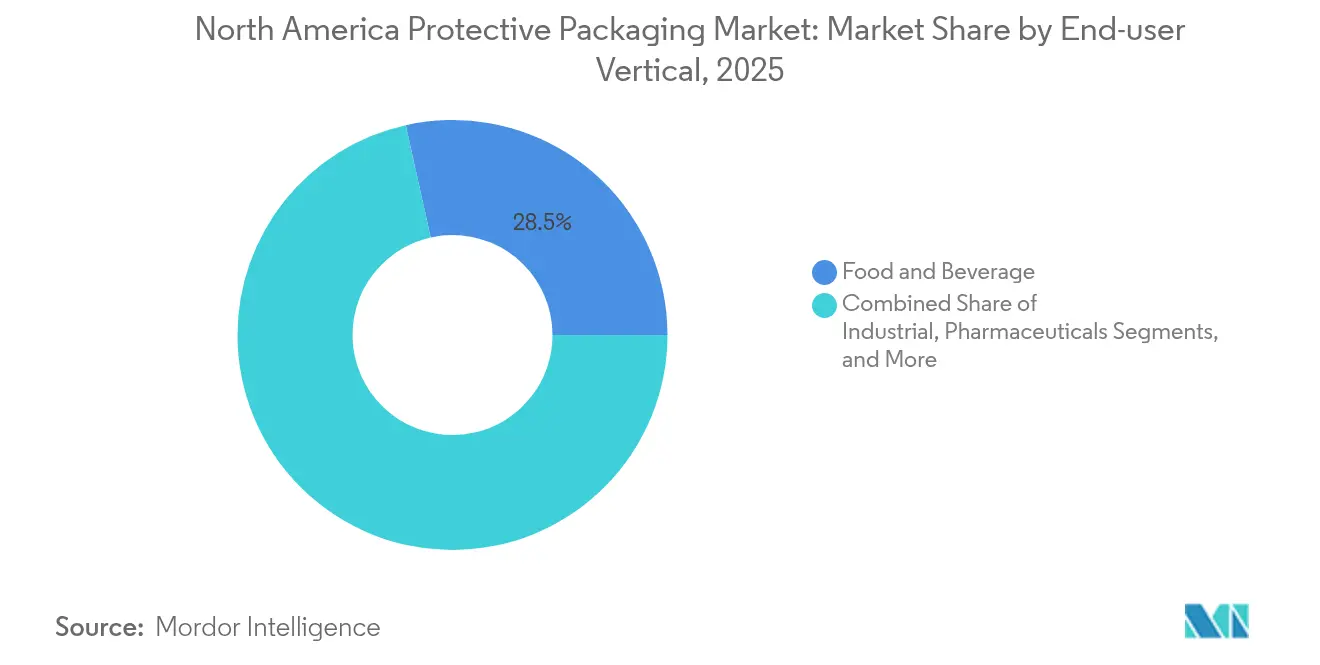
- By end-user vertical, pharmaceuticals are on track to record the fastest CAGR of 4.86% during 2026-2031, whereas food and beverage remained the largest revenue contributor with 28.49% share in 2025.
- By country, the United States retained a 71.65% share of the North America protective packaging market size in 2025, while Mexico is forecast to post a 4.97% CAGR to 2031.
Note: Market size and forecast figures in this report are generated using Mordor Intelligence’s proprietary estimation framework, updated with the latest available data and insights as of 2026.
North America Protective Packaging Market Trends and Insights
Drivers Impact Analysis*
| Driver | (~) % Impact on CAGR Forecast | Geographic Relevance | Impact Timeline |
|---|---|---|---|
| E-commerce boom and parcel-volume growth | +1.2% | Global, concentrated in U.S. urban centers | Short term (≤ 2 years) |
| Shift toward sustainable and recycled materials | +0.8% | North America regulatory zones, Canada federal mandate | Medium term (2-4 years) |
| Cold-chain expansion in food and pharma | +0.6% | U.S. pharmaceutical corridors, Mexico food processing | Medium term (2-4 years) |
| Dim-weight freight rules favoring light flexible formats | +0.4% | U.S. and Canada freight networks | Short term (≤ 2 years) |
| Reverse-logistics uptick demanding reusable protection | +0.3% | E-commerce dense regions in U.S. | Long term (≥ 4 years) |
| On-site AI-driven packaging automation at fulfillment hubs | +0.2% | Major U.S. distribution centers | Medium term (2-4 years) |
| Source: Mordor Intelligence | |||


E-commerce boom and parcel-volume growth
Surging parcel volumes continue to redefine protective packaging market requirements. Automated fulfillment centers rely on pre-formed mailers and air pillows that cut packing time by up to 40%, keeping pace with same-day delivery promises. Sealed Air reported robust e-commerce sales in 2024, attributing growth to automation-ready solutions that integrate seamlessly with high-speed lines.[1]Sealed Air Corporation, “2024 Annual Report,” sealedair.com Retailers, however, increasingly deploy cube-optimization software that trims excess void, reducing material intensity even as shipment counts climb. This duality sustains volume growth for automation-compatible formats while capping runaway tonnage gains for traditional void-fill.
Shift toward sustainable and recycled materials
Sustainability commitments from multinationals accelerate the adoption of fiber-based and compostable solutions despite cost premiums. Nestlé earmarked EUR 1.5 billion (USD 1.6 billion) for sustainable packaging through 2025, funneling funds toward bio-based cushioning and molded-pulp inserts. Health Canada’s single-use plastics prohibition, effective December 2024, eliminates several fossil-based formats, prompting rapid material substitution across North American supply chains. Despite 20–25% cost premiums, brand-owner ESG targets and consumer preference shifts underpin a steady pipeline of plant-derived films, starch loose-fill, and mycelium cushioning.
Cold-chain expansion in food and pharma
Personalized medicines, biologics, and meal-kit delivery are widening the protective packaging market for insulated shippers. Pfizer invested USD 2 billion in cold-chain infrastructure during 2024 to safeguard mRNA vaccines, driving demand for phase-change panels, EPS molded containers, and data-logging liners. Moderna’s ultra-low-temperature requirements (-70 °C) further stretch insulation performance thresholds. Food processors echo this trajectory as fresh-produce exports and omnichannel grocery expand, requiring thermal packaging that maintains quality through last-mile delivery.
Dim-weight freight rules favoring light flexible formats
FedEx and UPS dimensional-weight formulas charge by volume as much as mass, rewarding shippers that minimize cubic footprint. This pricing logic propels inflatable air pillows, paper void-fill, and film-based mailers that collapse to reduce volumetric penalties. Shippers report 10–15% freight savings after switching from molded foam to lightweight flexibles, supporting continued penetration of air-cell cushioning and honeycomb paperboard that deliver comparable protection at lower cube.
Restraints Impact Analysis*
| Restraint | (~) % Impact on CAGR Forecast | Geographic Relevance | Impact Timeline |
|---|---|---|---|
| Stringent regulations on single-use plastics and degradability | -0.7% | Canada federal regulations, U.S. state initiatives | Medium term (2-4 years) |
| Volatile resin and fiber prices | -0.5% | Global supply chains, petrochemical regions | Short term (≤ 2 years) |
| Warehouse cube-optimization reducing void-fill volumes | -0.4% | U.S. e-commerce fulfillment networks | Short term (≤ 2 years) |
| High CAPEX for smart-packaging machinery | -0.3% | Manufacturing facilities needing automation upgrades | Medium term (2-4 years) |
| Source: Mordor Intelligence | |||
Stringent regulations on single-use plastics and degradability
Health Canada’s prohibition eliminates checkout bags, cutlery, and defined packaging types, forcing rapid reformulation and significant R&D outlays for converters. Simultaneously, the U.S. EPA proposed limits on PFAS in food-contact coatings, removing conventional fluoropolymer barriers from the protective packaging toolbox. Compliance spending already absorbs 8–12% of development budgets, and uncertainty over enforcement timelines postpones investment in alternative chemistries.
Volatile resin and fiber prices
Dow reported polyethylene price swings of 20–25% in 2024 tied to feedstock disruptions, while International Paper cited 12–15% kraft cost hikes as mill outages collided with e-commerce demand. These gyrations squeeze converter margins, especially for small and mid-sized firms lacking long-term feedstock contracts or financial hedges. List-price adjustments trail raw-material spikes, pressuring cash flows and slowing capex plans.
*Our forecasts treat driver/restraint impacts as directional, not additive. The impact forecasts reflect baseline growth, mix effects, and variable interactions.
Segment Analysis
By Material Type: Bio-based innovation accelerates despite plastic dominance
Plastics secured 51.45% of 2025 revenue and remain indispensable for moisture and puncture barriers in the protective packaging market. However, the bio-based segment advances at a 5.49% CAGR, reflecting regulatory pressure and corporate ESG targets. The protective packaging industry logged a 35% rise in USPTO patent filings for PHA films and mycelium foams, signaling R&D momentum. Producers channel capex toward scalable compostable resins even as price premiums persist.
Paper and molded-fiber alternatives benefit from recyclability perceptions, though fiber price volatility narrows cost advantages. Foam plastics face scrutiny for disposal challenges yet retain irreplaceable insulation properties for fragile or temperature-sensitive loads. The protective packaging market is increasingly split into high-performance polymer applications and sustainability-driven fiber or compostable niches, with converters like Sealed Air earmarking USD 150 million for circular-material development.


By Product Type: Flexible formats lead amid foam resurgence
Flexible mailers, bubble wrap, and air pillows captured 46.12% of 2025 revenue as e-commerce shippers chase lightweight, automation-friendly options. Dim-weight freight economics amplify this edge, reinforcing demand for low-cube solutions. Foam regained momentum through pharmaceutical cold-chain expansion, registering the highest 4.38% CAGR outlook to 2031. Pfizer’s USD 2 billion cold-chain push underscores durable insulation demand for biologics.
Rigid corrugated inserts persist in industrial supply chains, while molded pulp gains share in electronics as OEMs swap EPS for fiber to meet recycling mandates. The protective packaging market sees discretionary upgrades toward smart variants embedding temperature sensors, QR tracking, and tamper evidence, enabling converters to upsell performance without proportionate material increases.
By Functionality: Cushioning dominates while insulation surges
Cushioning held 39.25% of 2025 spending, anchored by high-frequency outbound parcels in electronics and consumer goods. Yet, insulation is forecast to log a 4.79% CAGR as biologics, meal kits, and fresh grocery sales in North America. Moderna’s -70 °C distribution tests performance boundaries, elevating demand for vacuum-insulated panels and phase-change materials.
Void-fill experiences downward pressure from cube-optimization software, nudging suppliers toward higher-density, multi-use solutions that justify their footprint. Blocking and bracing remains resilient in heavy industrial shipments where the welfare costs of damage exceed marginal packaging savings. Overall, the protective packaging market balances cost-per-ship with risk tolerance and regulatory oversight, particularly where temperature excursions trigger write-offs.
By End-user Vertical: Food leads while pharma accelerates
Food and beverage retained 28.49% of 2025 revenue, supported by omnichannel grocery and export-grade fresh produce. Nestlé’s EUR 1.5 billion (USD 1.76 billion) commitment to sustainable packaging channels volume toward recyclable paper sleeves and compostable cushioning. Pharmaceuticals register the strongest 4.86% CAGR through 2031, driven by cell therapies and mRNA platforms requiring validated, temperature-controlled shippers.
Industrial manufacturing holds steady demand for blocking, bracing, and heavy-duty wraps, while consumer electronics favor low-static, high-clarity protective films to minimize returns. E-commerce acts as a horizontal force, influencing packaging design requirements across every vertical in the protective packaging market.
By Packaging Technology: Inflatable systems lead innovation wave
Inflatable formats commanded 32.78% revenue in 2025, reflecting their synergies with automated fulfillment and ease of storage. Insulated shipping containers deliver the fastest 4.31% CAGR as cold-chain intensifies across healthcare and perishables. Pregis’ pharma-grade inflatable with integrated temp monitoring highlights convergence between cushioning and analytics.
Molded pulp and honeycomb paperboard earn traction where single-use plastics restrictions tighten. Suspension and retention solutions cater to high-value electronics, securing lenses and glass panels during long-haul transit. Smart integration-RFID, NFC, or printed circuitry-emerges as a differentiator, letting shippers verify integrity without opening containers.
Geography Analysis
The United States generated 71.65% of 2025 revenue, anchored by a vast e-commerce engine and sophisticated fulfillment infrastructure. Sealed Air’s USD 5.5 billion sales underscore the protective packaging market heft available to suppliers that align with automation platforms and cold-chain standards. Advanced cartonization algorithms now trim void space, moderating material tonnage even as parcel volumes climb. Consolidation, such as Smurfit WestRock’s EUR 22.2 billion revenue scale, further concentrates bargaining power and fuels investments in bio-based R&D.
Canada represents a regulatory pressure cooker driving sustainable adoption. Health Canada’s plastics ban forces rapid material shifts, elevating fiber-based and compostable options along with reusable tote pilots. The pharmaceutical cold-chain remains a pocket of premium growth given climatic extremes and remote communities that heighten spoilage risk. Forest-products supply chains underpin steady demand for heavy-duty industrial protection despite pulp price swings.
Mexico posts a 4.97% CAGR through 2031 as nearshoring relocates electronics and automotive assembly southward. USMCA provisions streamline cross-border flows, yet tropical climate and infrastructure gaps demand robust thermal and moisture barriers. Investments in regional distribution hubs create fresh orders for fit-to-size equipment and recyclable cushioning as OEMs export finished goods back to U.S. consumers. Local converters partner with multinationals to certify plants under GFSI and ISO-9001, aligning quality benchmarks with North American retail expectations.
Regulatory Landscape
Regulation across North America is increasingly shaped by EPR and plastics controls that feed into protective packaging material selection and compliance reporting. In Canada, the Federal Court of Appeal upheld in January 2026 the federal Order adding plastic manufactured items to Schedule 1 of the Canadian Environmental Protection Act, 1999 (CEPA), reinforcing the policy foundation behind measures such as Health Canada’s single-use plastics prohibition, which took effect in December 2024.
In the United States, packaging compliance remains fragmented at the state level, with California a key reference point for national brands. CalRecycle finalized SB 54 regulations in May 2026, followed by a June 2026 producer registration and initial data submission milestone under the SB 54 program framework, increasing demand for packaging specifications aligned with recyclability or compostability requirements and for stronger packaging-data governance across multi-state distribution networks.
Value Chain Analysis
The North America protective packaging value chain starts with feedstocks and substrates (polyolefin resins, pulp and recovered fiber, and energy), then moves through film extrusion and converting, paper converting and molded-fiber forming, foam processing, and assembly of protective systems (mailers, air pillows, paper pads, insulated shippers, and blocking and bracing). Volatility in resin and fiber inputs and exposure to trade and logistics disruptions have increased the emphasis on dual sourcing and regional manufacturing footprints, particularly for high-volume e-commerce formats where delivery lead times and line uptime shape supplier selection.
Downstream, protective packaging is sold through direct contracts to brand owners and retailers, via packaging distributors, and increasingly as part of integrated automation offerings at fulfillment sites (fit-to-size, bagging, and on-demand cushioning). Trade associations such as the Industrial Packaging Alliance of North America (IPANA), the Fibre Box Association (FBA), and the National Wooden Pallet and Container Association (Woodpack Global) influence standards and advocacy, while manufacturers highlight North America-based production and circular-design alignment, as reflected by PAC by ProAmpac’s US Plastics Pact-linked direction for protective mailers in June 2026.
Competitive Landscape
North America’s protective packaging market shows moderate consolidation. The top five suppliers control roughly 55-60% of revenue, led by Sealed Air at USD 5.5 billion and Smurfit WestRock at USD 24.0 billion in 2024. Scale lets these firms hedge resin volatility, fund smart-factory upgrades, and win multi-year contracts with big-box retailers. Patent data reveal a 35% uptick in filings during 2024, signifying an arms race in bio-based materials and sensor-enabled packaging.
Strategic moves include Sealed Air’s USD 150 million sustainability investment and International Paper’s launch of automation-friendly kraft grades tailored to fit-to-size erectors.[3] International Paper Company, “Investor Presentation 2024,” internationalpaper.com Pregis and Ranpak intensify focus on paper-based inflatables and void-fill systems to capitalize on plastics bans, while Amcor spends USD 75 million to add North American capacity for pharmaceutical liners. Smaller specialists carve niches in reusable totes or ultra-low-temperature shippers, leveraging domain expertise to sidestep scale disadvantages.
Technology defines competitive advantage: vendors offering IoT-ready inserts, RFID-embedded mailers, or AI-compatible substrates gain pricing power. Sustainability credentials also influence bid awards as retailers publish supplier scorecards on recyclability, CO₂ footprint, and chemical safety. As M&A persists, integration of digital tools with material science will likely separate market leaders from commodity suppliers.
North America Protective Packaging Industry Leaders
Sealed Air Corporation
Pregis LLC
Sonoco Products Company
Intertape Polymer Group Inc.
Smurfit WestRock
- *Disclaimer: Major Players sorted in no particular order

Market Opportunities and Future Outlook
EPR-driven redesign and data reporting are opening a practical whitespace for protective formats that can be used across multi-state and cross-border networks without frequent material changes. California’s SB 54 program advanced through CalRecycle’s approval of regulations in May 2026 and a June 2026 producer registration and packaging-data milestone, which pushes brand owners and converters to accelerate transitions toward recyclable, compostable, and recycled-content protective solutions and to formalize packaging material inventories.
On the product side, opportunities focus on automation-compatible sustainable materials and drop-in replacements that limit costly line retrofits. Intertape Polymer Group’s July 2026 launch of PCR Air Pillow Film with 50% recycled content for existing AirSpace inflation systems illustrates how suppliers can leverage installed bases for recycled-content adoption, while Specialized Packaging Group’s May 2026 EcoFlex molded pulp concept targets faster turnaround by reducing reliance on traditional tooling. In cold-chain and higher-value shipments, performance-led innovation continues to support insulated and cushioning upgrades, including bio-based foaming materials such as TotalEnergies Corbion’s commercialized Luminy Foam 50F (July 2026), positioned as an extrusion-foaming alternative to polystyrene-type applications.
Recent Industry Developments
- July 2026: Intertape Polymer Group launched PCR Air Pillow Film with 50% total recycled content (35% post-consumer and 15% post-industrial) designed to run on existing AirSpace inflation systems. The film was manufactured at a TRUE Zero Waste certified facility in the United States, supporting customers seeking recycled-content performance without changing packaging equipment.
- September 2025: Sealed Air launched the AUTOBAG 850HB Hybrid Bagging Machine designed to run both paper and poly mailers on the same platform. This expands ship-from-store and fulfillment flexibility as shippers balance curbside-recyclable paper options with poly mailers for moisture resistance and operational throughput.
- December 2024: Health Canada implemented the Single-use Plastics Prohibition Regulations, restricting several single-use plastic items and accelerating material substitution in packaging procurement. The policy increased the urgency for fiber-based, compostable, and redesigned protective formats that fit retailer sustainability scorecards and compliance expectations.


Research Methodology Framework and Report Scope
Market Definition and Coverage
For this study, the market covers protective packaging used in North America to reduce damage during handling, storage, and shipment, across rigid, flexible, and foam-based formats used around the product.
Scope exclusions: It excludes tertiary transport packaging that is mainly for palletization or unitization, such as stretch wrap and strapping, when it is not used for product-level protection.
Segmentation Overview
- By Material Type
- Paper and Paperboard
- Plastics
- Foam Plastics
- Bio-based and Compostable Materials
- By Product Type
- Rigid
- Corrugated Paperboard Protectors
- Molded Pulp
- Insulated Shipping Containers
- Flexible
- Protective Mailers
- Bubble Wraps
- Air Pillows/Air Bags
- Paper Fill
- Foam
- Molded Foam
- Foam-in-Place (FIP)
- Loose Fill
- Foam Rolls/Sheets
- Rigid
- By Functionality
- Cushioning
- Blocking and Bracing
- Void Fill
- Insulation
- Wrapping and Surface Protection
- Other Functionalities
- By End-user Vertical
- Food and Beverage
- Industrial
- Pharmaceuticals
- Consumer Electronics
- Cosmetics and Home Care
- E-commerce and Logistics
- Other End-user Verticals
- By Packaging Technology
- Inflatable Packaging Systems
- Molded Pulp and Fiber-based Systems
- Suspension and Retention Packaging
- Insulated Shipping Containers
- Dunnage and Layer Pads
- Honeycomb Paper Solutions
- By Country
- United States
- Canada
- Mexico
Data Sources, Market Sizing, and Validation
Desk Research
Desk work started with building a clean view of demand drivers that typically move protective packaging spend in the US, Canada, and Mexico. We referenced public sources such as the US Census Bureau and Statistics Canada for shipment and industry output indicators, the US International Trade Commission data for trade signals on key materials, and US EPA materials and waste publications to understand sustainability direction.
After that, the same dataset was supported with company annual reports, investor presentations, product catalogs, and credible press coverage to map product mixes and pricing direction (especially for foam, paper-based cushioning, and mailers). Where a public trail was thin, we used paid subscriptions for company financials and news intelligence, import-export shipment level checks, and patent databases to confirm what is scaling and what is being substituted. The desk sources listed here are illustrative only, and many other public and paid references were also used for cross-checks and clarification.
Primary Interviews and Surveys
Primary work was used to pressure-test the model assumptions with converters, material suppliers, packaging distributors, and large end users in areas like e-commerce fulfillment, electronics, and healthcare shipping. We asked focused questions on mix shifts between foam and fiber, typical price pass-through timing, and where automation is changing protective packaging consumption per shipment, and then we re-checked any outlier answers through follow-up calls.
We also ensured the coverage reflects North America by speaking with participants tied to the US and Canada market flow, and selective Mexico-linked supply chains, so the final view is aligned to how packaging is actually bought and used in the region.
Distribution of primary research fieldwork respondents
| Company type | Respondent position |
|---|---|
| Top tier: 35% | CXOs: 20% |
| Mid tier: 43% | Functional/Unit leaders: 25% |
| Smaller Players: 22% | Managers: 55% |
Market-Sizing & Forecasting
Sizing was built using a top-down demand pool reconstruction, where shipment intensity, warehousing activity, and e-commerce parcel growth were translated into protective packaging consumption, and then converted into value using format-level pricing. In parallel, selective bottom-up checks were run using sampled supplier revenue splits, channel discussions on category shares, and a volume times average selling price approximation for a few common items, which helped keep totals realistic.
Key inputs that shaped the model included parcel and freight shipping trends, dimensional-weight related packaging behavior, resin and paper price direction, adoption of paper-based void fill, and the penetration of automation-ready protective formats in fulfillment lines. Forecasts were developed using scenario analysis with a base case tied to macro activity and packaging substitution signals, and the scenario ranges were tuned using what interviewees expect on pricing and material switching over the next few years. When bottom-up signals had gaps (for example, limited visibility in small regional converters), we used conservative share bands and validated them through distributor checks before locking the final market value.
Data Validation & Update Cycle
Outputs were validated through triangulation across desk indicators, interview feedback, and consistency checks between material trends and the implied protective packaging mix. If the model showed a sharp jump that did not match known signals like freight activity or input price movements, the assumptions were reopened and reviewed by another analyst before sign-off.
The study is refreshed on an annual cycle, and interim updates are triggered when material events occur, such as major regulatory changes on single-use plastics, large input price shocks, or supply disruptions. Before delivery, a final review pass is completed so the numbers reflect the most recent public releases and the latest expert confirmations.
Mordor Intelligence's North America Protective Packaging Market Size Compared With Other Published Estimates
Published market sizes for protective packaging in North America can look different because the line between product-level protection and broader transport packaging is not drawn the same way, and because some studies use different base years and pricing timing.
Stretch wrap and strapping are kept outside Mordor Intelligence's scope here, and that scope cut alone can move reported totals when other sources fold those items into protective packaging spend alongside cushioning and mailers.
Benchmark comparison
| Source | Market Size | Gaps in Research Methodology |
|---|---|---|
| Mordor Intelligence | USD 9.65 B (2025) | |
| Global Consultancy A | USD 12.85 B (2025) | Uses a broader definition that can bundle protective packaging with adjacent transport and service elements, and it typically applies a higher growth path from e-commerce and temperature-controlled use cases. |
| Trade Publisher B | USD 9.36 B (2024) | Uses an earlier base year and can lag current pricing resets for resins and paper, which affects value sizing when inflation and mix shifts occur within the year. |
Overall, the spread is mainly explained by scope width, base-year selection, and how quickly pricing and mix shifts are refreshed into the model. By keeping the calculation tied to shipment and handling needs, and then checking the implied value against format-level pricing and adoption signals, the final number stays traceable to simple inputs that can be re-tested each update cycle.


Key Questions Answered in the Report
What is the forecast value of the North American protective packaging market by 2031?
The market is expected to reach USD 11.44 billion by 2031.
Which material segment is growing fastest in protective packaging?
Bio-based and compostable materials are projected to grow at a 5.49% CAGR through 2031.
How are dimensional-weight freight rules influencing packaging choices?
They incentivize lightweight, flexible formats that reduce cubic volume, leading to freight savings of up to 15%.
Which end-user vertical is set to record the highest CAGR?
Pharmaceuticals are forecast to expand at a 4.86% CAGR during 2026-2031 due to cold-chain needs.
Why is Mexico’s protective packaging demand accelerating?
Nearshoring of manufacturing and investment in regional distribution hubs push market growth to a 4.97% CAGR.
How are suppliers addressing resin price volatility?
Larger players leverage long-term contracts, hedging, and R&D into alternative materials to cushion margin impact.
Page last updated on:


 Your data is secure and never sold or shared.


