
Market Overview
| Study Period | 2020 - 2031 |
|---|---|
| Forecast Data Period | 2026 - 2031 |
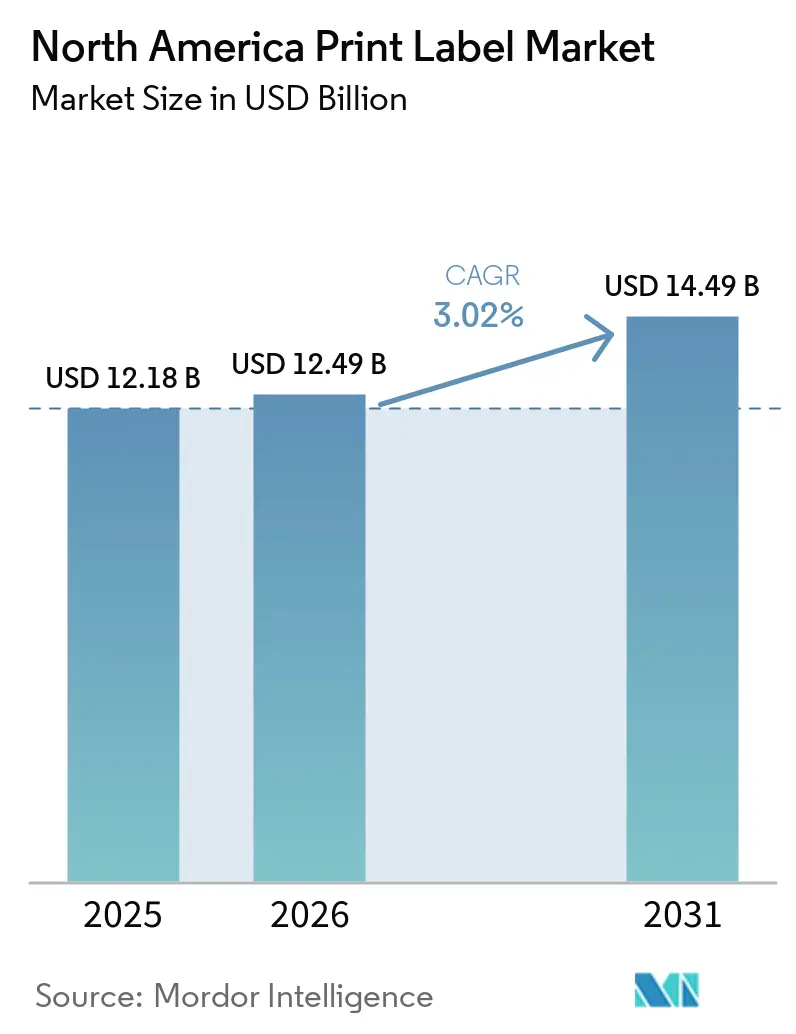
| Base Year Market Size (2025) | USD 12.18 Billion |
| Market Size (2026) | USD 12.49 Billion |
| Market Size (2031) | USD 14.49 Billion |
| Growth Rate (2026 - 2031) | 3.02 % |
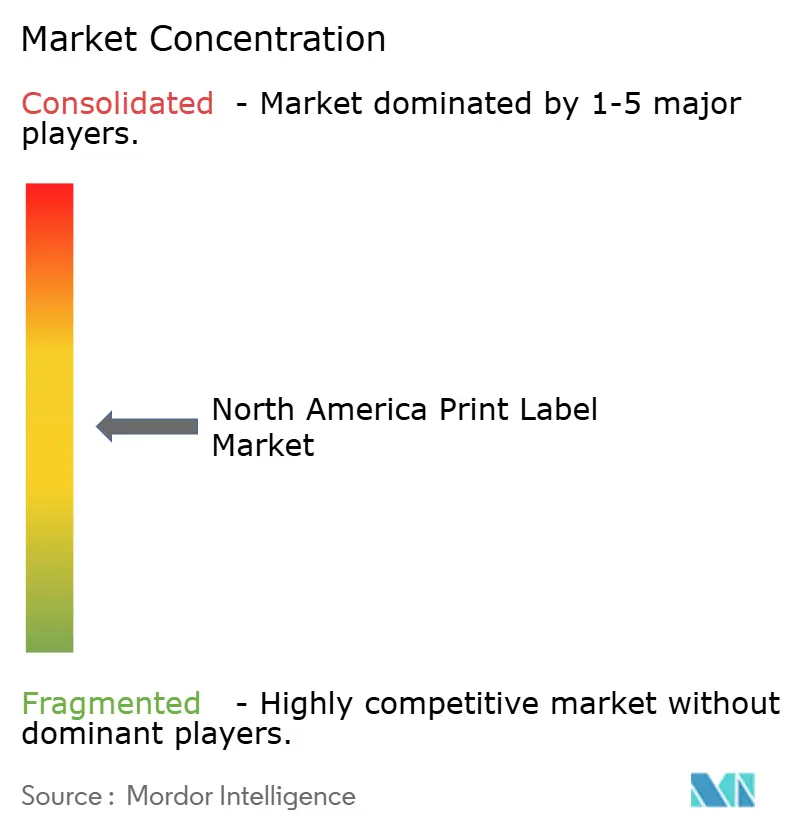
| Market Concentration | Medium |
Major Players *Disclaimer: Major Players sorted in no particular order Image © Mordor Intelligence. Reuse requires attribution under CC BY 4.0. | |
North America Print Label Market Analysis by Mordor Intelligence
The North America print label market size is expected to increase from USD 12.18 billion in 2025 to USD 12.49 billion in 2026 and reach USD 14.49 billion by 2031, growing at a CAGR of 3.02% over 2026-2031. The outlook reflects stable replacement demand from packaged food and beverage lines, coupled with rising variable-data orders tied to e-commerce shipping labels. Converters are investing in digital presses that shorten changeover time and eliminate plate costs, a shift reinforced by brand owners that refresh SKUs every quarter to remain visible on omnichannel shelves. Regulatory pressure is steering ink systems toward water-based and ultraviolet-curable chemistries that meet tighter volatile organic compound limits, while healthcare mandates for unique device identification are lifting demand for serialized, tamper-evident constructions. Despite expanding volumes, mid-tier converters face margin compression when raw-material prices spike, prompting further consolidation among regional players that lack purchasing leverage.
Key Report Takeaways
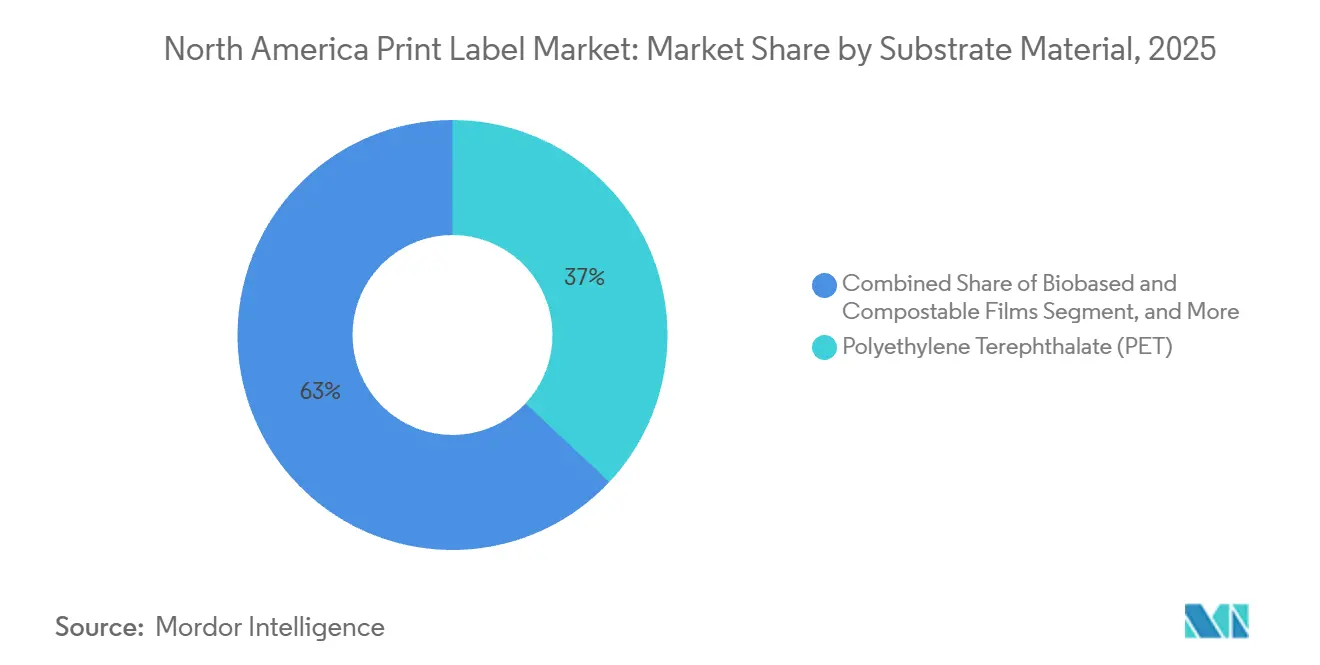
- By substrate material, polyethylene terephthalate held the largest 36.98% North America print label market share in 2025, while biobased and compostable films are projected to register the fastest 4.56% CAGR through 2031.
- By print technology, flexography accounted for 44.96% of market share in 2025, whereas digital printing is forecast to post the highest 4.32% CAGR over 2026-2031.
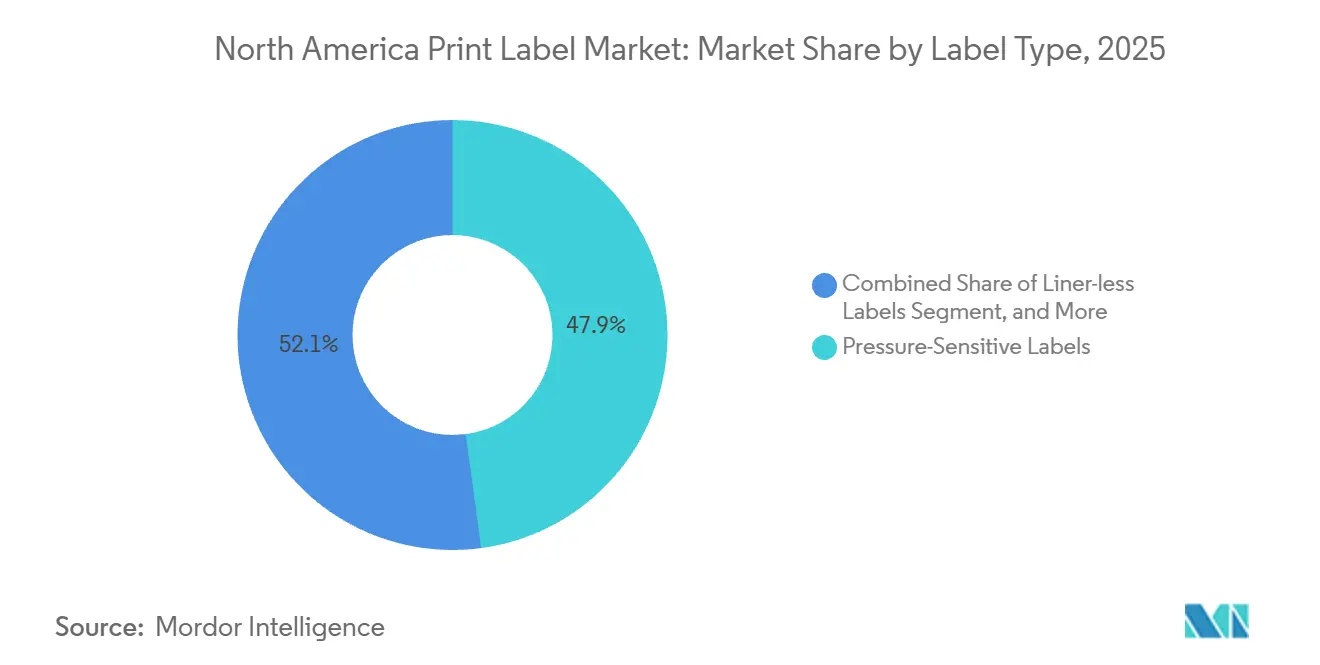
- By label type, pressure-sensitive constructions commanded 47.87% of market share in 2025, yet liner-less formats are expected to advance at the quickest 4.48% CAGR during the forecast period.
- By end-user industry, food applications led with a 29.79% share in 2025; healthcare and pharmaceuticals represent the fastest-growing vertical, projected at a 4.71% CAGR to 2031.
- By geography, the United States dominated with 75.16% of market share in 2025, while Mexico is anticipated to expand at the region’s strongest 5.01% CAGR through 2031.
Note: Market size and forecast figures in this report are generated using Mordor Intelligence’s proprietary estimation framework, updated with the latest available data and insights as of 2026.
Market Trends and Insights
Drivers Impact Analysis of North America Print Label Market*
| Driver | (~) % Impact on CAGR Forecast | Geographic Relevance | Impact Timeline |
|---|---|---|---|
| Growing Demand for Digital Print Technologies | +0.8% | United States and Canada | Medium term (2-4 years) |
| Surge In Variable Data Printing for E-Commerce Logistics | +0.7% | United States fulfillment hubs | Short term (≤ 2 years) |
| Sustainability-Driven Switch to Liner-Less and Shrink-Sleeve Formats | +0.6% | North America, led by California and select Canadian provinces | Long term (≥ 4 years) |
| Healthcare UDI-Labeling Mandates | +0.5% | United States with spill-over to Mexican exporters | Medium term (2-4 years) |
| AI-Enabled Print Workflow Automation | +0.4% | Multi-site converters across North America | Long term (≥ 4 years) |
| Brand Protection and Anti-Counterfeit Features Integration | +0.3% | Pharmaceuticals, spirits, cosmetics across the region | Medium term (2-4 years) |
| Source: Mordor Intelligence | |||
Growing Demand for Digital Print Technologies
Digital presses are changing the economics of the North America print label market by making runs under 5 000 linear feet financially viable. RR Donnelley installed an HP Indigo 120K press in June 2025, pairing it with robotic material handling to streamline short-run production.[1] Cimpress committed in May 2025 to add up to 20 more HP Indigo units across its network, signaling confidence in personalized packaging demand through 2027.[2] Taylor Corporation’s in-house data pegs the digital break-even point versus flexography at roughly 3 000 feet, down from 8 000 feet five years ago. These economics allow smaller converters to compete on 48-hour turnaround times that national retailers increasingly expect. The flexibility of digital platforms also supports serialization, unique QR codes, and augmented-reality triggers that are impractical on analog lines.
Surge in Variable Data Printing for E-commerce Logistics
Rapid expansion of online retail has multiplied the number of shipping labels that require unique barcodes, return data, and branded messaging. Major U.S. third-party logistics operators now specify radio-frequency identification (RFID)- enabled labels to automate pallet sortation, a requirement accelerated by Amazon’s mandate that inbound pallets carry RFID tags from 2025. Avery Dennison’s APR-recognized mono-material RFID label, introduced in June 2025, demonstrates how converters are merging sustainability with smart-label functionality. The boom in serialized labels obliges converters to deploy digital front-end software capable of ingesting high-volume data streams directly from customer enterprise systems. In parallel, fulfillment centers prefer liner-less formats that reduce waste on high-speed applicators, reinforcing volume growth for direct-wound constructions.
Sustainability-Driven Switch to Liner-Less and Shrink-Sleeve Formats
Brand owners are pivoting toward formats that reduce waste and simplify recycling, a trend especially visible in jurisdictions with extended producer responsibility laws. California’s SB 54 imposes escalating fees on packaging components that cannot enter established recycling streams, thereby penalizing silicone-coated release liners.[3] UPM Raflatac’s liner-less range eliminates the liner entirely and lowers packaging mass up to 50% per unit, gaining adoption in fresh produce and meat channels. Shrink sleeves, now produced in polyethylene terephthalate glycol-modified formulations that pass compatibility tests in PET recycling, offer 360-degree graphics without compromising post-consumer processing. Compostable substrates from TIPA, certified under ASTM D6400 and EN 13432, attract premium organic food brands even though resin costs remain higher than petroleum-based films. Transition costs include specialized applicators and heat-tunnel upgrades that can deter smaller bottlers, yet life-cycle assessments increasingly justify the capital outlay.
Healthcare UDI-Labeling Mandates
Full enforcement of U.S. Food and Drug Administration unique device identification rules under 21 CFR Part 801 is stimulating advanced label specifications. Medical device firms must now apply GS1-compliant barcodes linking each package to the Global UDI Database, driving demand for high-resolution digital printing that accommodates frequent lot changes. Biogen disclosed a USD 12 million spend on serialization infrastructure in its 2024 annual report, covering label-verification cameras and data-management software. Pharmaceutical producers handling biologics stored at −80 °C also require adhesives with glass-transition points below −40 °C, favoring acrylic-based systems recommended by RxSource technical guidance. Converters that certify materials under good manufacturing practice protocols gain a pricing premium, which offsets the higher cost of cryogenic-grade facestocks.
Restraints Impact Analysis of North America Print Label Market*
| Restraint | (~) % Impact on CAGR Forecast | Geographic Relevance | Impact Timeline |
|---|---|---|---|
| Inadequate Durability in Extreme Cold-Chain Applications | -0.4% | United States and Canada, focused on biologics distribution | Medium term (2-4 years) |
| Supply Volatility of Specialty Label-Stock Papers | -0.5% | Region-wide shortages in release-liner grades | Short term (≤ 2 years) |
| Capital-Intensive Transition from Analog to Digital Presses | -0.3% | Mid-tier converters across the United States and Canada | Medium term (2-4 years) |
| Stringent VOC and Ink-Migration Regulations Tightening in 2026 | -0.4% | United States, especially California and northeastern states | Short term (≤ 2 years) |
| Source: Mordor Intelligence | |||
Inadequate Durability in Extreme Cold-Chain Applications
Messenger RNA vaccines and cell therapies shipped at ultra-low temperatures have exposed adhesive and facestock failures within the North America print label market. RxSource identified delamination and barcode fading during freeze-thaw cycles and recommends acrylic systems with sub-40 °C glass-transition points plus polypropylene facestocks that resist embrittlement. FDA good manufacturing practice rules obligate labels to remain legible throughout shelf life, elevating converters’ liability when materials fail. Biogen validates labels through 10 accelerated freeze-thaw tests at −80 °C, a protocol spreading across biotech customers. Reformulating adhesives increases material cost by up to 25%, squeezing margins on contracts already tendered at tight pricing. Niche converters able to certify cryogenic constructions capture a share in this specialized pocket of demand.
Supply Volatility of Specialty Label-Stock Papers
Closure of Pixelle Specialty Solutions’ Spring Grove, Pennsylvania mill in 2024 removed roughly 200 000 tons of coated base stock, tightening availability of wine and premium food label paper. Earlier labor action at UPM’s Finnish operations also disrupted global release-liner supply, and inventory normalization extended into 2025. North American converters scrambled to qualify alternate mills, often accepting longer lead times that complicate just-in-time production. ATP Adhesive Systems responded with a USD 50 million expansion in Kentucky to localize silicone-coated liner capacity. Even so, restricted supply enables upstream mills to quickly pass through price increases, a cost challenge that small and medium converters struggle to offset with customers.
*Our forecasts treat driver/restraint impacts as directional, not additive. The impact forecasts reflect baseline growth, mix effects, and variable interactions.
North America Print Label Market Segment Analysis
By Substrate Material:
Biobased Films Gain Traction Amid PET DominancePolyethylene terephthalate maintained a 36.98% share of the North America print label market in 2025, supported by its toughness, transparency, and suitability for high-speed bottling. Brand owners pursuing circular-economy goals are adding biobased and compostable films that are advancing at a 4.56% CAGR, though current cost premiums confine adoption to premium organic and wellness lines. The industrial labels market is seeing growing interest in fiber-based materials as brand owners pursue recyclable packaging solutions and lower environmental impact. Paper retains relevance for wine and artisanal food where a natural look matters, while polypropylene dominates squeezable packaging that demands conformability. Polyvinyl chloride continues to retreat under environmental scrutiny, yet it persists in industrial chemicals where its solvent resistance remains unmatched. Association of Plastic Recyclers design protocols now influence specification sheets, encouraging converters to avoid facestocks that contaminate polyethylene recycling streams.
Supply shocks exacerbate substrate decisions. Pixelle’s mill shutdown left converters scrambling for specialty coated papers, pushing some wine brands to test textured polypropylene facestocks that mimic paper aesthetics without supply-chain risk. UPM’s expansion in North Carolina added release-liner output that partly offsets lost European tonnage, but market anxiety lingers. Beontag invested USD 40 million to install a specialty line in Ohio that localizes high-end self-adhesive materials. Smart-label growth is another driver, as RFID antennas demand substrates that limit signal attenuation; Avery Dennison’s mono-material polyethylene construction meets this need while aligning with recycler acceptance criteria.

By Print Technology:
Digital Platforms Erode Flexography’s Long-Run AdvantageFlexography held 44.96% of the market share in 2025, thanks to its productivity on runs exceeding 10,000 feet and its compatibility with low-VOC water-based inks. Digital systems, led by HP Indigo, Xeikon, and inkjet hybrids, are expanding at 4.32% across 2026-2031 as converters chase orders for regional craft beer, limited-edition cosmetics, and direct-to-consumer replenishment packs. RR Donnelley’s Georgia facility integrates a new HP Indigo 120K with automated finishing, an illustration of analog and digital coexistence at scale. Cimpress’s planned fleet expansion confirms sustained appetite for personalized prints, especially across mass-customization web portals.
Offset and screen retain niche roles where metallic inks or heavy lay-downs are critical. Meanwhile, the U.S. Environmental Protection Agency will tighten 40 CFR Part 60 Subpart RR limits in 2026, pushing converters reliant on solvent inks toward UV-curable or aqueous systems. California air districts have already enacted stricter thresholds, effectively accelerating the pivot to lower-emission platforms that naturally align with digital presses. Capital remains a barrier: entry-level inkjet models cost near USD 500 000 and high-volume toner lines exceed USD 1 million, driving mergers among printers seeking economies of scale.
By Label Type:
Liner-Less Constructions Challenge Pressure-Sensitive HegemonyPressure-sensitive designs represented 47.87% of market share in 2025, favored for their versatility on high-speed bottling and pharmaceutical lines. Liner-less alternatives are forecast to climb at 4.48% CAGR as retailers remove release-liner waste to satisfy provincial extended producer responsibility rules. UPM Raflatac’s direct-wound tapes lower per-unit packaging mass by half and meet throughput targets on rotary applicators. Shrink sleeves, which use PET-G formulations that can be recycled alongside clear PET bottles, are growing in personal care because full-body graphics stand out on crowded shelves.
Wet-glue labels linger on legacy beer lines optimized for cold glue, yet breweries upgrading equipment opt for pressure-sensitive solutions that simplify SKU proliferation. In-mold labels embed decoration during container formation, saving a secondary step and enhancing tamper evidence in dairy tubs. Multi-part tracking labels, crucial in logistics and clinical trials, leverage digital printing to embed unique IDs in tear-off slips. As RFID and near-field communication migrate into mainstream packaging, the functional divide between label genres blurs further, encouraging converters to master multiple constructions within a single workflow.
By End-User Industry:
Pharmaceutical Serialization Outpaces Food DemandFood retained 29.79% of overall market share in 2025, anchored by mandatory nutrition disclosures under 21 CFR Part 101. Healthcare labels, propelled by serialization and tamper-evident requirements, are on track for a 4.71% CAGR through 2031. Biogen’s multimillion-dollar serialization rollout exemplifies biopharma’s capital commitment to traceability. Demand also stems from cold-chain biologics that require cryogenic adhesives certified to good manufacturing practice standards. Beverage labels support frequent seasonal releases from craft brewers, which favor digitally printed pressure-sensitive stocks for flexibility.
Cosmetics testers compete on shelf impact, pushing for holographic foils and metallic spot colors that translate into premium unit pricing. Industrial users prioritize durability and Globally Harmonized System pictogram compliance, often specifying chemical-resistant screen or flexo inks. Logistics labels represent a fast-moving niche where every parcel requires a unique identifier, aligning naturally with digital workflows that print serialized barcodes in real time. Growing interest in connected packaging enabling refill reminders or authenticity validation further amplifies healthcare and premium cosmetics orders.
Geography Analysis
United States Print Label Market
The United States generated 75.16% of the market share in 2025, reflecting its large consumer-goods base, advanced pharmaceutical manufacturing, and dense e-commerce fulfillment infrastructure. National converters operate multi-site networks that balance flexographic mass production with digital short-runs, and many sites are adding AI-driven scheduling systems that cut makeready waste. State-level regulation shapes substrate decisions, most notably in California, where extended producer responsibility fees accelerate the adoption of liner-less formats and recyclable PET-G shrink sleeves. Volatile organic compound rules in the Northeast further push converters toward ultraviolet-curable and water-based chemistries.
Canada Print Label Market
Canada maintains a smaller but sophisticated market characterized by mandatory bilingual labeling under the Consumer Packaging and Labelling Act. Provincial extended producer responsibility schemes reward recyclable substrates, and pressure-sensitive stocks that pair polyethylene facestocks with removable wash-off adhesives are gaining share in beverage applications. Domestic converters increasingly pursue liner-less investments to comply with waste-reduction benchmarks set in Ontario and British Columbia. Importantly, U.S. and Canadian food brands often print unified art that meets both English and French text requirements, so digital presses that accommodate micro-lot production minimize inventory risk.
Mexico Print Label Market
Mexico, while a smaller share contributor today, records the region’s briskest percentage growth as nearshoring places automotive, consumer electronics, and personal-care assembly closer to North American buyers. Industrial parks in cities such as Tijuana and Monterrey recruit local label converters to supply just-in-sequence parts identification and compliance stickers. Avery Dennison opened an RFID facility in Querétaro in 2024, exceeding USD 100 million, adding regional capacity for intelligent labels serving both cross-border and South American exports. Mexican plants also print serialized barcodes for apparel bound for U.S. fulfillment centers, leveraging duty-free flows under the United States-Mexico-Canada Agreement.
Regulatory Landscape
In the United States, print label compliance is anchored by the Federal Food, Drug, and Cosmetic Act (FD&C Act) and the Fair Packaging and Labeling Act (FPLA), with FDA guidance shaping mandatory content and format for food labels. A near-term planning anchor is the FDA uniform compliance date of January 1, 2028, for food labeling regulations issued between January 1, 2025, and December 31, 2026, which tightens change-management cycles for label redesigns and validation.
In Canada, the Consumer Packaging and Labelling Act and associated Consumer Packaging and Labelling Regulations govern prepackaged product labeling, including core declarations such as product identity, net quantity, and dealer identification, and often require bilingual presentation (English and French). The Competition Bureau provides enforcement guidance for non-food labeling claims, and converters serving cross-border brands typically align artwork and substantiation files to meet both federal frameworks while monitoring state or provincial requirements that can go beyond national baselines.
Value Chain Analysis
The value chain begins with raw-material suppliers for facestocks (paper, PET, PP), adhesives, release liners, inks and coatings, and RFID inlays, then moves through prepress and artwork management into printing (flexography, digital, and offset or screen niches) and finishing (die-cutting, lamination, inspection, rewinding). Converters supply finished rolls or cut-and-stack labels to brand owners, co-packers, 3PLs, and healthcare manufacturers, where application equipment and verification systems (barcode grading and serialization cameras) complete the downstream link.
Recent supply-side actions show how upstream volatility can flow into labeling inputs and service levels. In 2026, containerboard and linerboard market tightening, along with inventory prioritization by Packaging Corporation of America, highlighted packaging-material cost sensitivity that can also pressure label stock, liners, and freight budgets, reinforcing procurement hedging and multi-sourcing. On capability building, UPM Adhesive Materials announced investment in proprietary coating technology at its Mills River, North Carolina facility (July 2025) to add capacity for advanced label materials. Separately, Yerecic Label connected multi-site operations through an eProductivity Software platform (October 2025), reflecting continued shifts toward digital workflows that improve visibility, batching, and turnaround when margins are under pressure.
Competitive Landscape
The North America print label market is moderately fragmented with players like Avery Dennison Corporation, CCL Industries Inc, and others. CCL Industries completed nine acquisitions between 2023-2025, most recently the October 2025 purchase of IDESCO Holding for CAD 19.0 million (USD 13.6 million) that expands its pharmaceutical and nutraceutical footprint. Large groups exploit procurement leverage to secure long-term film and liner contracts at stable pricing, an advantage unavailable to independent printers.
Below the tier-one firms, hundreds of regional converters have carved niches by combining digital presses, rapid art-to-press workflows, and value-added embellishments such as augmented-reality codes. Many quote 48-hour turnaround for runs under 5 000 linear feet, courting craft brewers and direct-to-consumer brands that need frequent SKU changes. Multi-Color Corporation, Brady Corporation, and WestRock Company compete chiefly on end-market specialization; for example, Brady dominates industrial durables while WestRock cross-sells labels with corrugated and folding carton programs.
Technology is an emerging wedge. World Wide Technology documented a 30% cut in setup time at a converter that deployed machine-learning algorithms for color management. HiFlow Solutions’ software automates job batching and raw-material allocation, producing 20% higher first-pass yield across pilot plants. Domino Printing’s AI-driven inspection heads verify every barcode at line speed and link quality data directly to regulatory documentation, especially valuable on healthcare lines that cannot tolerate mis-prints. Competitive intensity is poised to rise as private-equity platforms consolidate smaller shops to build regional super-networks capable of national service levels.
North America Print Label Industry Leaders
-
Avery Dennison Corporation
-
Ahlstrom-Munksjö Oyj
-
Brady Corporation
-
Cenveo Worldwide Limited
-
Mondi plc
- *Disclaimer: Major Players sorted in no particular order
North America Print Label Market Companies Covered in this Report
- Avery Dennison Corporation
- CCL Industries Inc.
- Multi-Color Corporation
- Brady Corporation
- Smurfit Westrock
- Mondi plc
- Ahlstrom-Munksjö Oyj
- Cenveo Worldwide Limited
- Resource Label Group, LLC
- Blue Label Packaging Company
- OMNI Systems Inc.
- Inovar Packaging Group
- Fort Dearborn Company
- RR Donnelley and Sons Company
- Fortis Solutions Group, LLC
- Traco Manufacturing, Inc.
- UPM-Raflatac Oy
- Brook + Whittle Holdings, LLC
- Lux Global Label Company
- Consolidated Label Co.
Market Opportunities and Future Outlook
Whitespace is widening around intelligent and data-rich labels that balance sustainability requirements with automation needs in logistics and regulated end uses. Amazon's 2025 inbound pallet RFID requirement and the market move toward RFID-enabled sortation create opportunities for converters that can integrate inlays, validate performance, and run high-mix variable data at speed, supported by material advances such as Avery Dennison’s APR-recognized mono-material RFID constructions (introduced in June 2025). In healthcare, enforcement of FDA unique device identification requirements under 21 CFR Part 801 continues to drive demand for serialized, tamper-evident constructions and inspection-ready workflows, favoring converters with GMP-aligned material qualification and end-to-end data handling.
Regional capacity additions and supply chain reconfiguration also create concrete opportunities for North American converters and material suppliers. SIG announced an expansion plan for its Querétaro, Mexico plant (April 2026) to increase carton-pack supply into North America, supporting nearshored packaged-goods throughput that typically increases label volumes and SKU churn across food and beverage lines. On the converter side, investment and consolidation activity, such as ePac Flexible Packaging signing a multi-year agreement with HP to add digital presses across its network (March 2026) and Labelink acquiring Litho Quebec (April 2026), points to continued demand for short-run, high-graphics work and bundled offerings that combine labels with adjacent printed packaging.
Recent Industry Developments in North America Print Label Market
- April 2026: Brady Corporation entered into a definitive agreement to acquire Honeywell’s Productivity Solutions and Services (PSS) business for USD 1.4 billion, adding mobile computers, barcode scanners, and workflow tools alongside printing solutions. The acquisition strengthens Brady’s position in identification systems adjacent to industrial and compliance label demand, and it supports more integrated print-and-data capture deployments for end users.
- April 2026: Avery Dennison announced a USD 75 million strategic minority investment in Wiliot to scale Physical AI, expanding collaboration around connected products and digital identities. The investment supports Avery Dennison’s Intelligent Labels platform and reinforces adoption of sensor-enabled, data-rich labeling in retail and logistics workflows.
- October 2025: CCL Industries completed the acquisition of IDESCO Holding for CAD 19.0 million (USD 13.6 million), broadening its specialty pharmaceutical and nutraceutical labeling footprint. The acquisition adds capacity and capabilities in regulated applications where traceability, security features, and validation requirements raise switching costs and tend to favor scaled converter networks.
North America Print Label Market Report Scope and Research Methodology
Market Definition and Coverage
For this study, the market covers printed labels sold in North America for identification, branding, logistics, and regulatory information on packaged and industrial goods, counted in revenue terms at the point of label conversion and printing.
Scope exclusions: We exclude label applicator machinery, standalone inks and coatings sold for non-label uses, and purely digital software services that do not result in printed label output.
Segments Covered in This Report
- By Substrate Material
- Paper and Paperboard
- Polyethylene Terephthalate (PET)
- Polypropylene (PP and BOPP)
- Polyvinyl Chloride (PVC)
- Biobased and Compostable Films
- Other Substrate Materials
- By Print Technology
- Offset
- Flexography
- Screen
- Digital Printing
- Other Print Technologies
- By Label Type
- Wet-glued Labels
- Pressure-Sensitive Labels
- Liner-less Labels
- In-mold Labels
- Shrink Sleeve Labels
- Other Label Types
- By End-user Industry
- Food
- Beverage
- Healthcare and Pharmaceutical
- Cosmetics and Personal Care
- Industrial
- Other End-user Industries
- By Country
- United States
- Canada
- Mexico
Data Sources, Market Sizing, and Validation
Desk Research
Desk research was used to set the market boundary and to anchor the demand drivers that ultimately move label volumes and pricing. We relied on public packaging and manufacturing indicators, and on trade and regulatory signals that influence labeling needs across the United States, Canada, and Mexico.
Common source types included, such as US Census Bureau manufacturing data, US International Trade Commission trade statistics, Bureau of Labor Statistics producer price series, Statistics Canada manufacturing releases, and customs and tariff schedules that clarify labeling and materials movement. We also reviewed company filings and investor presentations, association websites, and reputed press for capacity additions, material shifts, and technology adoption commentary, then used a paid subscription for company financials and a patent database to cross-check innovation activity. This list is illustrative, and many other sources were also referenced for data collection, validation, and clarification during the work.
Primary Interviews and Surveys
Primary work focused on interviews and structured surveys with converters, raw material participants, printing equipment ecosystem experts, and major label buyers in packaged goods and healthcare, so we could validate demand patterns and realistic pricing behavior. Coverage was balanced across North America to confirm what is truly regional versus what is driven by one country, and to pressure test assumptions that were not fully visible in public data.
Distribution of primary research fieldwork respondents
| Company type | Respondent position |
|---|---|
| Top tier: 35% | CXOs: 14% |
| Mid tier: 50% | Functional/Unit leaders: 39% |
| Smaller Players: 15% | Managers: 47% |
Market-Sizing & Forecasting
Sizing started with a top-down build where packaging output, industry-level labeled unit intensity, and trade-linked shipment flows were used to reconstruct a realistic demand pool for printed labels in North America. Once that ceiling was established, we ran selective bottom-up checks using sampled converter revenue disclosures, channel checks on average selling price ranges, and volume-to-value bridges by label format to adjust totals where gaps appeared.
Key inputs used in the model included packaged food and beverage production trends, pharmaceutical and personal care labeling requirements, material mix shifts (paper versus film), printing technology adoption affecting run length economics, and observable input-cost movement that influences pricing resets. Where bottom-up visibility was limited for smaller converters, we handled the gap by using a coverage factor calibrated from interview feedback and then tested sensitivity to avoid overstating the long tail.
For forecasting, we used scenario analysis supported by short-cycle trend signals, with demand drivers and pricing assumptions reviewed with industry respondents before finalizing the trajectory. The forecast was kept practical by linking growth to end-use activity and to replacement cycles in labeling, rather than assuming step changes that cannot be verified from public indicators.
Data Validation & Update Cycle
Validation was done through multiple passes that compared the modeled total against independent signals, including packaging output direction, trade movement, and observable pricing behavior in label materials and conversion services. When unusual year-to-year jumps appeared, we re-checked the underlying assumptions, and triggered follow-up calls to confirm whether the change came from volume, mix, or price.
Before sign-off, the model and key assumptions go through analyst cross-review so calculation logic, currency handling, and scope boundaries remain consistent across years. Reports are refreshed annually, and interim updates are made when material events occur, such as major capacity additions, regulation changes tied to labeling, or abrupt raw material price shifts. Right before delivery, a final freshness check is performed so clients receive the latest updated view.
Mordor Intelligence's North America Print Label Market Size Compared With Other Published Estimates
It is normal to see different market sizes for print labels because publishers do not always count the same products, they may apply different pricing logic, and they may anchor demand to different end-use pools. Timing can also matter because label pricing can reset after input-cost swings, which changes a value-based market even if volumes stay steady.
By tracking label-type boundaries and refreshing price and mix assumptions with interview checks, Mordor Intelligence keeps the total tied to printed label conversion revenue in North America, instead of blending in adjacent packaging label categories or broader label materials. Differences also come from whether shrink sleeves and in-mold formats are fully included, whether Mexico and Canada are modeled with the same depth as the United States, and whether currency timing and inflation adjustments are applied consistently for the same reference year.
Benchmark comparison
| Source | Market Size | Gaps in Research Methodology |
|---|---|---|
| Mordor Intelligence | USD 12.18 B (2025) | |
| Trade Journal A | USD 16.53 B (2024) | Uses a broader printed labels framing that can pull in adjacent packaging-label activity, and it is anchored to a different year, which can inflate value when pricing is rising. |
| Industry Reseller B | USD 10.17 B (2025) | Appears to use a narrower count that leans toward select label formats and end uses, which can undercount film-based formats and specialty applications when compared with a full print label scope. |
The spread in values is mainly explained by what gets counted as a print label, how pricing is carried into the base year, and whether all three North American countries are modeled with consistent depth. With the approach used here, the market total is traceable to clear demand drivers, format-level mix, and repeatable checks that make the estimate easier to reconcile over time.
Key Questions Answered in the Report
How large will North America print labels spending be by 2031?
It is forecast to reach USD 14.49 billion, rising at a 3.02% CAGR over 2026-2031.
Which substrate leads current demand?
Polyethylene terephthalate holds 36.98% share because it balances clarity, strength, and application speed.
What technology is growing fastest?
Digital presses, expanding at 4.32% CAGR, outpace all other print methods as converters chase short-run personalization.
Why are liner-less labels gaining momentum?
They eliminate silicone-coated release liners, reduce unit weight up to 50%, and help brand owners meet extended producer responsibility rules.
How are healthcare regulations influencing label design?
FDA serialization and unique device identification mandates drive demand for serialized barcodes, tamper evidence, and cold-chain compliant adhesives.