
Market Overview
| Study Period | 2020 - 2031 |
|---|---|
| Forecast Data Period | 2026 - 2031 |
| Base Year Market Size (2025) | USD 87.88 Billion |
| Market Size (2026) | USD 88.8 Billion |
| Market Size (2031) | USD 93.56 Billion |
| Growth Rate (2026 - 2031) | 1.05 % |
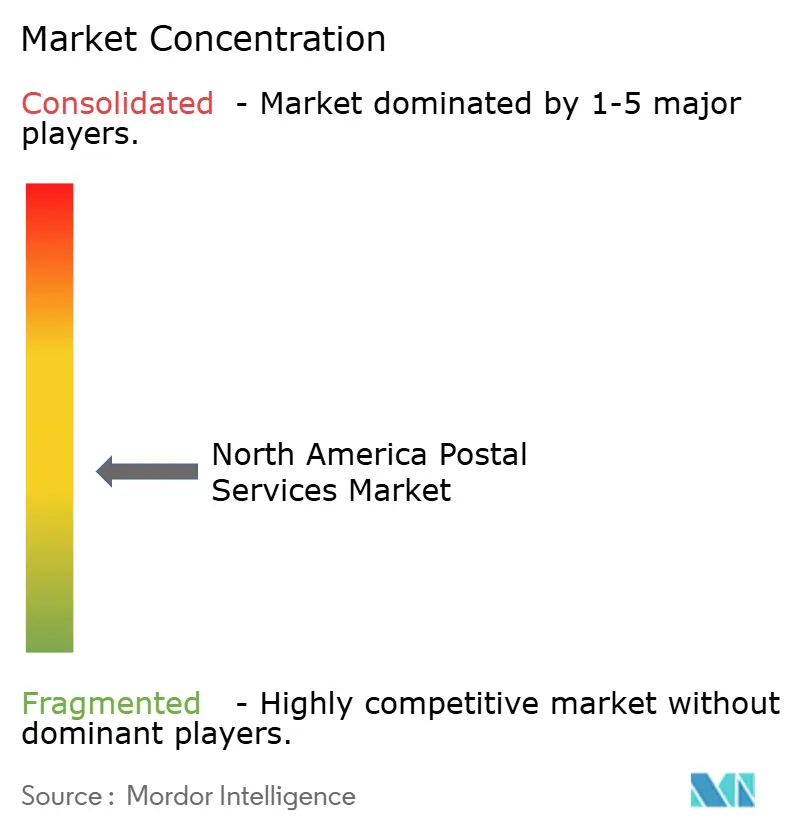
| Market Concentration | Medium |
Major Players *Disclaimer: Major Players sorted in no particular order Image © Mordor Intelligence. Reuse requires attribution under CC BY 4.0. | |
North America Postal Services Market Analysis by Mordor Intelligence
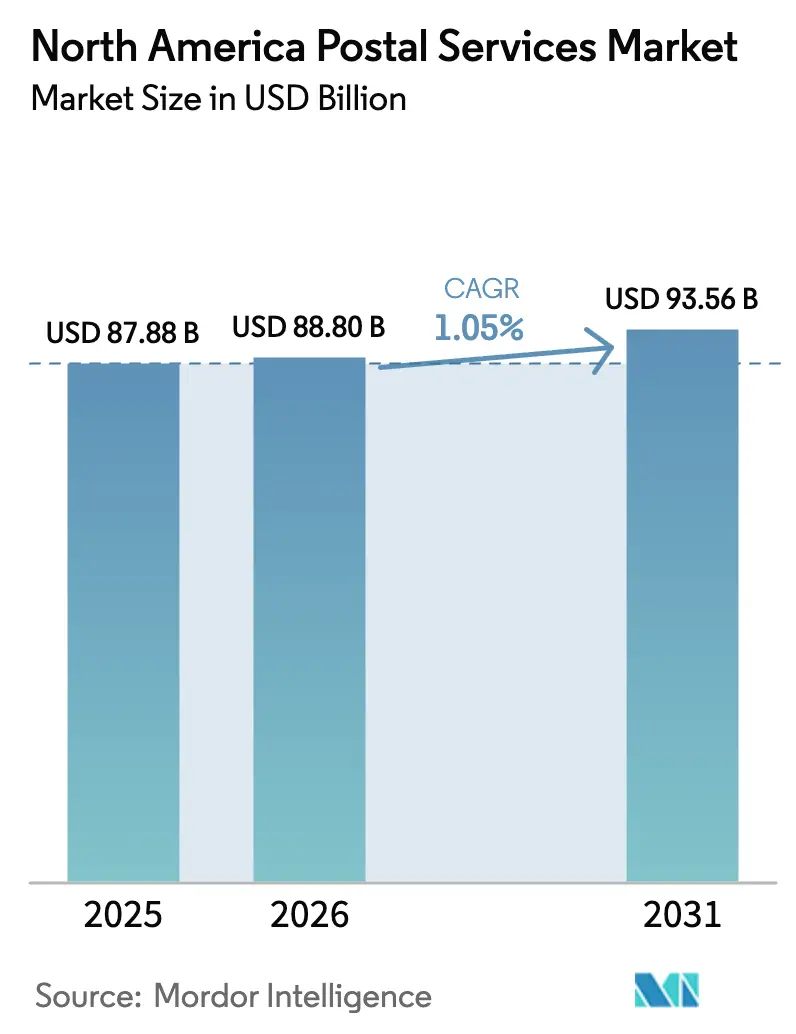
North America Postal Services Market size market size in 2026 is estimated at USD 88.8 billion, growing from 2025 value of USD 87.88 billion with 2031 projections showing USD 93.56 billion, growing at 1.05% CAGR over 2026-2031.
Growth appears modest, yet the numbers hide sweeping structural change. Traditional First-Class Mail volumes continue to fall, while parcels have become the revenue engine as e-commerce deepens its hold on consumer behaviour. Major operators are modernising processing assets, electrifying fleets, and integrating digital APIs to improve service reliability and cost control. Competition is intensifying because Amazon Logistics has leap-frogged UPS in parcel volume, regional couriers are widening geographic reach, and crowdsourced delivery networks are moving into niche routes. These forces are encouraging postal incumbents to rework pricing, route density, and partner ecosystems to defend share. At the same time, near-shoring in Mexico, sustainability mandates in several U.S. states, and targeted capacity additions at Canadian hubs are reshaping the profit map across the region.
Key Report Takeaways
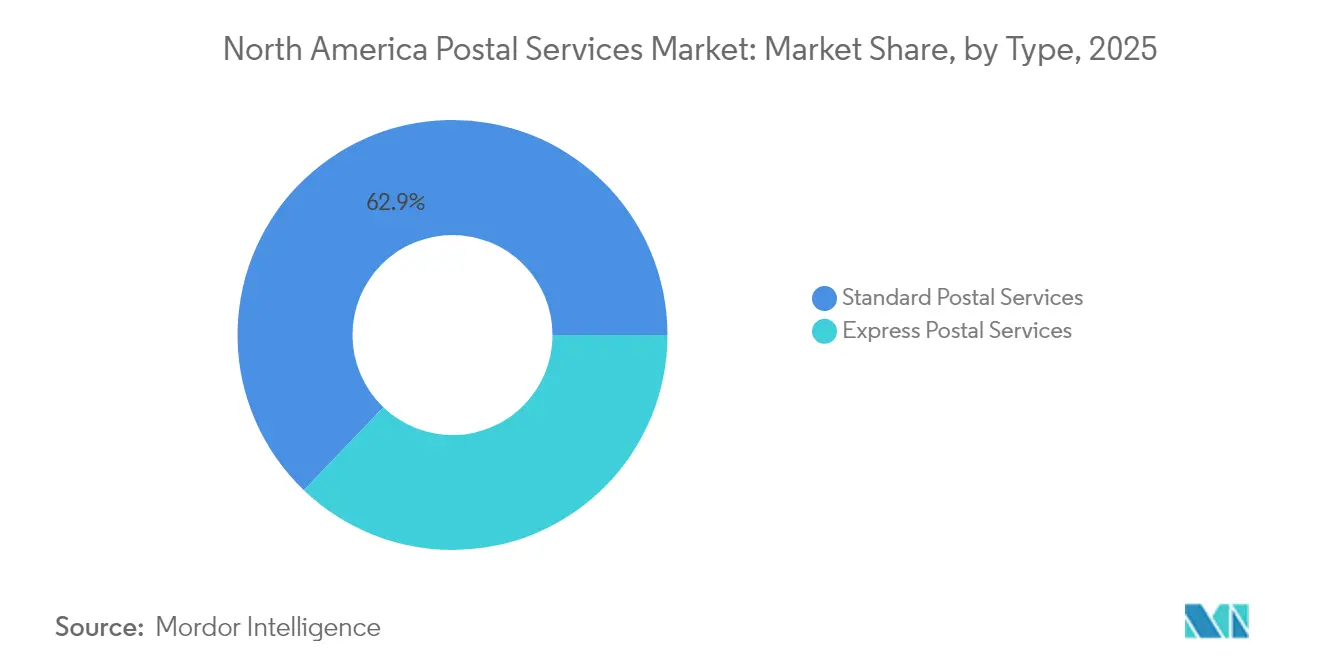
- By type, standard postal services claimed 62.85% of the North America postal services market share in 2025, while express services are forecast to grow the fastest at a 3.55% CAGR through 2031.
- By item, parcels led with 58.05% of the North America postal services market size in 2025; letter mail continues to contract, but parcels are projected to expand at a 3.65% CAGR to 2031.
- By destination, domestic services accounted for 80.65% share of the North America postal services market size in 2025, whereas international services are set to rise at a 3.55% CAGR during 2026-2031.
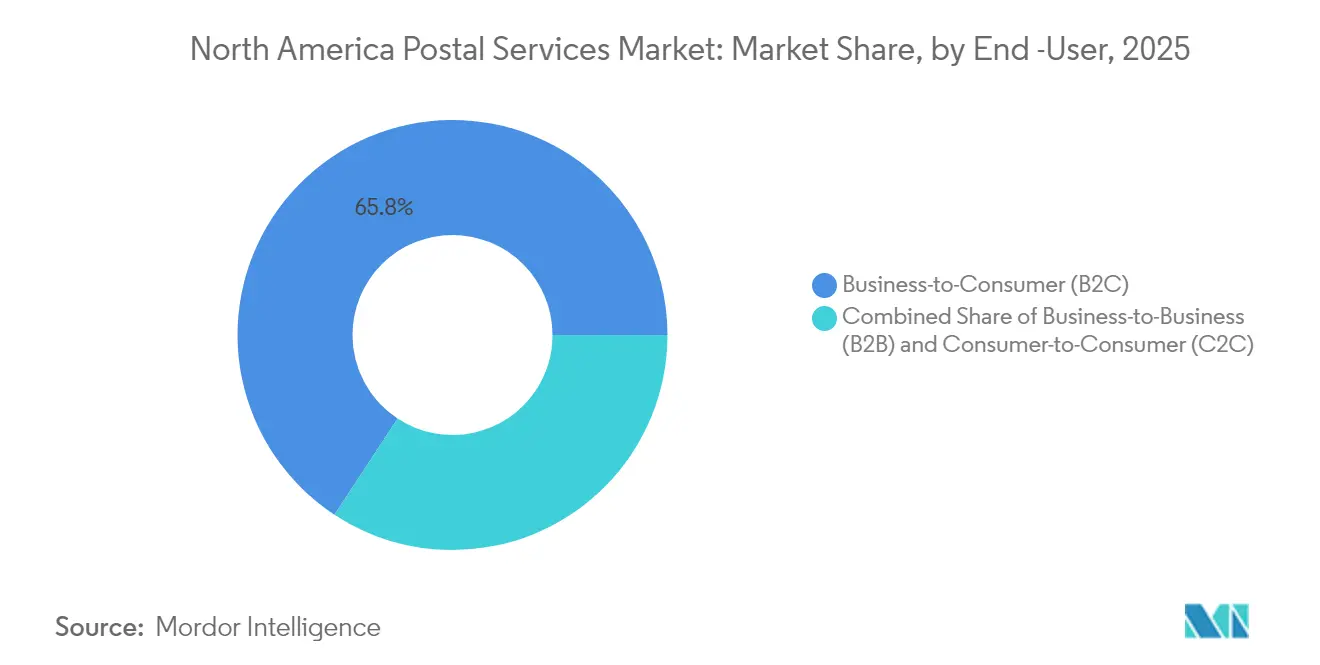
- By end-user, the B2C segment held 65.75% revenue share in 2025, while the C2C segment exhibits the highest projected CAGR at 4.1% to 2031.
- By delivery mode, road transport dominated with 72.05% share of the North America postal services market size in 2025; air transport shows the quickest expansion at a 2.95% CAGR over the forecast window.
- By geography, the United States represented 85.80% of the North America postal services market share in 2025, whereas Mexico is expected to post the fastest regional CAGR of 3.05% between 2026 and 2031.
Note: Market size and forecast figures in this report are generated using Mordor Intelligence’s proprietary estimation framework, updated with the latest available data and insights as of 2026.
North America Postal Services Market Trends and Insights
Drivers Impact Analysis*
| Driver | (~) % Impact on CAGR Forecast | Geographic Relevance | Impact Timeline |
|---|---|---|---|
| E-commerce parcel volume boom driven by same-day delivery demands | +0.6% | United States, Canada, Mexico | Medium term (2-4 years) |
| SMB adoption of hybrid mail & fulfilment APIs | +0.3% | United States, spillover to Canada | Medium term (2-4 years) |
| U.S. Postal Service network modernization | +0.4% | United States | Long term (≥ 4 years) |
| Canada Post parcel expansion hubs | +0.2% | Canada, U.S. border regions | Medium term (2-4 years) |
| Mexico logistics-park near-shoring surge | +0.3% | Mexico, U.S. border states | Long term (≥ 4 years) |
| State-level sustainability mandates accelerating fleet electrification | +0.1% | California, New York, Massachusetts | Long term (≥ 4 years) |
| Source: Mordor Intelligence | |||
E-commerce Parcel Volume Boom Driven by Same-Day Delivery Demands
Parcel traffic reached 21.7 billion pieces in the United States during 2023 and is projected to climb toward 29 billion by 2029, adding pressure on postal operators to prioritise parcel capacity over letter routes. Operators are now favouring predictable two-to-three-day windows over ultra-fast promises because reliability has become the key buying criterion for online shoppers. USPS upgraded seasonal processing to about 60 million parcels per day for the 2024 holiday peak, reflecting a permanent shift toward parcel-centric networks.
SMB Adoption of Hybrid Mail & Fulfilment APIs in the United States
Small and midsize businesses now contribute 28.9% of total U.S. postal volume, catalysed by easy-to-integrate shipping APIs offered by USPS and private carriers. Web Tools updates released during 2024 add end-to-end tracking and harmonised customs data, enabling even micro-merchants to print compliant labels directly from e-commerce dashboards. This digital bridge is democratising enterprise-grade logistics capabilities and sustaining higher-margin traffic across the network.
U.S. Postal Service's Network Modernization Increasing Processing Capacity
The USD 40 billion “Delivering for America” roadmap earmarks USD 17.3 billion for replacing legacy plants with regional processing and distribution centres and over 60 sorting and delivery centres[1]United States Postal Service, “Delivering for America Plan,” usps.com. By consolidating mail flow, the plan should lift daily parcel handling capacity from 47 million to 77 million by 2030. Despite regulatory concerns about service downgrades for rural areas, USPS expects annual cost savings of roughly USD 3.6-3.7 billion and improved on-time scores[2]Postal Regulatory Commission, “Advisory Opinion on Network Consolidation,” prc.gov.
Canada Post's Parcel Expansion Hubs Enhancing Cross-Border Reach
Canada Post opened the Albert Jackson Processing Centre in Toronto with 1 million-parcel daily throughput and is enlarging the Pacific Processing Centre at Vancouver International Airport to reinforce service to Asia-Pacific lanes. Both sites meet the Canada Green Building Council’s Zero-Carbon standard, signalling a dual focus on capacity and sustainability. The move is vital as the operator’s market share slid to 29% in 2024 after a prolonged strike.
Restraints Impact Analysis*
| Restraint | (~) % Impact on CAGR Forecast | Geographic Relevance | Impact Timeline |
|---|---|---|---|
| First-Class Mail volume decline from digital substitution in U.S. government agencies | -0.5% | United States | Long term (≥ 4 years) |
| Chronic labor shortages & rising union wage pressures | -0.3% | United States, Canada | Medium term (2-4 years) |
| Airport & border capacity bottlenecks | -0.2% | U.S.-Canada & U.S.-Mexico borders | Short term (≤ 2 years) |
| Mexican rural addressing gaps increasing last-mile costs | -0.1% | Mexico | Long term (≥ 4 years) |
| Source: Mordor Intelligence | |||
First-Class Mail Volume Decline from Digital Substitution in U.S. Government Agencies
First-Class Mail fell by 50% between FY 2008 and FY 2023, eroding one of USPS’s most profitable revenue streams. Government bodies that once mailed tax notices and benefits statements are now defaulting to digital delivery, deepening revenue pressure. Even with higher parcel income, USPS posted a USD 6.5 billion net loss in FY 2023, and further declines in physical correspondence threaten funding for universal-service mandates.
Chronic Labor Shortages & Rising Union Wage Pressures at National Posts
A 32-day Canada Post strike in late 2024 snarled holiday deliveries and pushed several retailers to switch carriers, magnifying the corporation’s quarterly loss to USD 315 million before tax. Contract talks remain tense, with another walkout possible in 2025. In the United States, letter carrier wage discussions are also proving complex, underscoring workforce fragility in a tight labour market
*Our forecasts treat driver/restraint impacts as directional, not additive. The impact forecasts reflect baseline growth, mix effects, and variable interactions.
Segment Analysis
By Type: Express Services Outpace Standard Mail
Express services recorded a 3.55% CAGR for 2026-2031, surpassing overall market momentum. The benefits from premium pricing as businesses pay for predictable arrival windows. Continuous Producer Price Index gains for couriers confirm sustained demand, and major operators bolster time-definite lanes with later cut-offs and earlier clearances.
Standard services, although covering the broadest addressable base, wrestle with secular mail decline. Yet they still commanded 62.85% of the North America postal services market share in 2025 due to universal-service obligations that entrench nationwide delivery networks. USPS is recalibrating standards so 75% of First-Class Mail maintains a 1-5-day window and 14% gains faster service, aligning commitments with real-world transport flows.


By Item: Parcels Dominate Amid Letter Decline
Parcels held 58.05% share in 2025, generating the lion’s share of revenue for the North America postal services market. Operators expanded mechanised sortation and shifted labour from letter plants to parcel lanes, enabling single-piece handling rates as low as 20 seconds per unit during peak periods. The North America postal services market size tied to parcel business is forecast to grow at 3.65% CAGR on the back of expanding e-commerce categories such as oversized home goods and temperature-controlled groceries.
Letter volumes, in contrast, continue their downtrend. Between 2008 and 2023, First-Class Mail halved, and the North America postal services market share for letters slipped accordingly. Still, legal documents, voter materials, and direct-mail marketing keep a rump demand that supports selective investments in high-speed letter sorting technology meant to safeguard remaining profitability.
By Destination: International Shipments Outpace Domestic Growth
Domestic traffic retained an 80.65% hold over the North America postal services market in 2025, serving 167 million U.S. addresses and millions more in Canada and Mexico every delivery day. High fixed-route density aids cost absorption, and operators layer parcels atop mail rounds to maximise last-mile productivity.
International services, though smaller, exhibit a 3.55% CAGR because of cross-border e-commerce and near-shoring tailwinds. Harmonised customs codes, electronic advance data, and new trade configurations under USMCA spur volume even as tariff shifts create temporary volatility. USPS revised customs forms in April 2024, mandating HS codes to accelerate clearance in 30+ nations, improving customer satisfaction scores on outbound parcels.
By End-User: C2C Segment Shows Surprising Strength
C2C consignments, driven by peer-to-peer resale platforms and social-commerce gifting, are forecast to grow 4.1% annually to 2031. Lightweight parcels, prepaid return labels, and kiosk drop-offs fuel the segment’s low-touch model. Meanwhile, B2C retains 65.75% share of the North America postal services market thanks to large-scale retail operations shipping daily to urban and rural addresses alike.
B2B flows remain essential for warranty parts, financial documentation, and regulated samples. Nevertheless, their growth has tempered as enterprises adopt digital document workflows. Operators advertise chain-of-custody tracking and dedicated account teams to keep B2B churn low, especially in medical devices and aerospace verticals that still prize paper originals.
By Delivery Mode: Air Transport Gains Altitude
Road networks dominate with 72.05% share, offering the only economically viable option for dense last-mile distribution across sprawling suburbia. Fleet electrification, improved telematics, and unified sort-to-route models are expected to sustain road’s central role. The North America postal services market size linked to road modes is projected to inch along near the headline CAGR.
Air transport, however, charts a 2.95% CAGR, its role amplified by cross-border priority parcels and return-to-origin logistics for high-value goods. UPS now lifts most USPS air consignments, integrating postal volumes into its own cargo aircraft schedules for higher load factors. Capacity expansions at secondary airports and automated air-freight sorters will help carriers meet two-day national delivery promises even into remote ZIP codes.
Geography Analysis
The United States anchors the North America postal services market with 85.80% share in 2025. USPS alone handled 6.6 billion parcels last year, yet its revenue share was only 16% because private couriers charge higher average yields. The agency’s USD 40 billion transformation plan seeks to reverse negative cash flow through processing consolidation, fleet modernisation, and broader parcel pricing tiers. Amazon Logistics surpassed UPS by delivering 5.9 billion parcels in 2024, illustrating the groundswell of in-house retailer networks.
Canada faces mounting margin pressure as labour unrest and new entrants dilute Canada Post’s foothold. Market share slipped to 29% in 2024, down from 62% pre-pandemic, after a 32-day strike pushed shippers toward Purolator, FedEx, and regional specialists. In response, the Crown corporation is pouring capital into low-carbon hubs, robotic sorters, and parcel lockers to reclaim customer confidence.
Mexico shows the fastest expansion, with a 3.05% CAGR driven by near-shoring and industrial park buildouts. Cross-border flows benefit from USMCA incentives, though rural address deficits inflate last-mile costs. Niche providers have launched geocoding apps that assign plus-codes to unnumbered dwellings, bridging the gap and unlocking growth in interior states tied to manufacturing ecosystems.
Regulatory Landscape
In the United States, the Postal Regulatory Commission (PRC) continues to govern market-dominant products and related price filings, with USPS implementing market-dominant price adjustments effective July 12, 2026 under PRC Docket R2026-1. These changes include replacing ADC/AADC rate categories with 3-Digit rates and restructuring Periodicals pricing. Cross-border postal flows faced additional compliance change when U.S. Customs and Border Protection (CBP) issued an interim final rule effective July 24, 2026 that suspended the de minimis administrative exemption for imports valued at USD 800 or less arriving through the international postal network. The rule introduced a new postal informal entry process, increasing data and clearance rigor for low-value inbound parcels.
In Canada, Canada Post operates under the Canada Post Corporation Act with oversight from the Minister responsible for public services and procurement. The model balances a universal-service obligation with a requirement to remain financially self-sustaining. Canada Post’s 2026-2030 corporate planning and modernization agenda highlights reforms such as updating the rate-setting process and right-sizing elements of the network, including revisiting the moratorium on rural post office closures. These choices shape service design, pricing flexibility, and cost-to-serve in parcel-heavy routes.
Value Chain Analysis
The North America postal services value chain typically runs from merchant or consumer induction (retail counters, scheduled pickups, drop boxes, lockers, and e-commerce label APIs) through upstream acceptance, verification, and data capture. It then moves into automated sortation and linehaul before ending with last-mile delivery to homes, community mailboxes, or pickup points. USPS network modernization programs, including transportation and processing reconfiguration, are reshaping the midstream portion of this chain by changing how volume moves between processing facilities and delivery units to improve synchronization and reduce handling steps.
Private integrators and consolidators increasingly operate hybrid chains that combine their own pickup, sortation, and linehaul with postal last-mile density. DHL eCommerce is one example of this structure, running nationwide pickup, sortation across 19 automated hubs, and linehaul before tendering pre-sorted containers to USPS for last-mile delivery, effectively splitting the value chain at the delivery-unit interface. This model concentrates private investment in induction and hub automation while monetizing the postal operator’s universal-service reach, with cross-border compliance (customs data and clearance processes) becoming a more influential constraint on international mail and parcel handoffs.
Competitive Landscape
Competition in the North America postal services market is fragmenting as nimble players capture route niches. Amazon Logistics, USPS, UPS, FedEx, Purolator, and regional couriers such as LSO and Dicom now contest volume and mindshare. USPS still leads on total pieces moved, but Amazon’s integrated retail-to-doorway chain gives it an agility edge for same-day metropolitan service.
Strategic investment is centred on automation and electrification. USPS will add 106,000 new delivery vehicles by 2028, including at least 66,000 EVs uspsoig.gov. UPS has converted Atlanta and Louisville ground hubs to RFID-based parcel tracking, lifting sort accuracy above 99.5%. Canada Post’s air-cargo alliance with Cargojet expands transborder overnight capacity, countering growth from DHL and GLS.
Technology partnerships are multiplying. Pitney Bowes released ShipAccel, enabling desktop label generation and multi-carrier rating for SMBs. FedEx is piloting AI-driven dynamic route planning in 12 U.S. cities to shave fuel and overtime. These moves signal a pivot from asset-heavy models to platform-enabled ecosystems that monetise data and orchestration as much as physical carriage.
North America Postal Services Industry Leaders
USPS
Canada Post Corporation
UPS
DHL
FedEx
- *Disclaimer: Major Players sorted in no particular order

Market Opportunities and Future Outlook
Operators are creating whitespace in parcel economics by reengineering networks around fewer, higher-throughput nodes and standardized handoffs. USPS’s Delivering for America modernization agenda, including building out a regional processing backbone and expanding Sorting and Delivery Centers, supports opportunities for shippers and intermediaries to secure more consistent induction cutoffs, improved tracking events, and scalable returns programs as parcels remain the main volume engine. The May 2026 long-term, exclusive last-mile agreement between DHL eCommerce and USPS, valued at over USD 10 billion, also highlights how postal networks are being commercialized as last-mile platforms, giving consolidators and cross-border sellers a path to present pre-sorted, compliance-ready volume.
In Canada, Canada Post’s multi-year transformation actions, including retail-network modernization and converting remaining door-to-door delivery addresses to community mailboxes, support opportunity for parcel locker ecosystems, pickup-point partnerships, and route optimization services that reduce delivery cost per stop while preserving coverage. On the cross-border side, the July 2026 CBP change affecting de minimis treatment for inbound postal shipments elevates demand for electronic data quality, harmonized product classification, and brokerage-like support embedded in shipping workflows. That demand benefits carriers and software providers that can package compliant label generation, advance data, and predictable clearance into cross-border postal shipping.
Recent Industry Developments
- June 2026: USPS launched three new Regional Processing and Distribution Centers in Nashville, TN; Oklahoma City, OK; and Sacramento, CA. The expansion strengthens the parcel processing backbone to support growing volume and improves service reliability in key markets. The increased capacity helps defend share in the competitive North America parcel landscape.
- June 2026: Canada Post expanded community mailbox conversion program to reach 37 additional communities. The shift from door-to-door to centralized delivery assets enhances operating efficiency and reduces delivery costs in a multi-year transformation. The change supports long term sustainability of core delivery networks.
- May 2026: USPS and DHL eCommerce entered a multi-year exclusive last-mile parcel delivery agreement with DHL eCommerce (over USD 10 billion). The collaboration monetizes USPS last-mile network through third party integration and expands reach for cross border parcel flows. The arrangement strengthens financial self-sustainability through scale and strategic carrier partnerships.


Research Methodology Framework and Report Scope
Market Definition and Coverage
For this study, the market covers revenues earned from postal and mail delivery activities across North America, including letters and parcels moved through standard and express services for domestic and international destinations.
Scope exclusions: We do not treat pure warehousing, long-haul freight forwarding, or contract logistics that sits outside postal pickup-sort-transport-deliver workflows as part of this market.
Segmentation Overview
- By Type
- Standard Postal Services
- Express Postal Services
- By Item
- Letters
- Parcels
- By Destination
- Domestic
- International
- By End-User
- Business-to-Business (B2B)
- Business-to-Consumer (B2C)
- Consumer-to-Consumer (C2C)
- By Delivery Mode
- Road
- Air
- Sea
- Rail
- By Country
- United States
- Canada
- Mexico
Data Sources, Market Sizing, and Validation
Desk Research
Desk work starts with building the demand and supply context for mail and parcel movement, and then shaping a realistic revenue pool for the region. We refer to public sources such as USPS annual reports and service performance releases, Canada Post annual reports, Statistics Canada, and the US Bureau of Transportation Statistics to understand shipment direction, network intensity, and service mix shifts.
To make assumptions practical, we also review postal regulations and sector notes from bodies such as the Universal Postal Union and national communications regulators, along with customs and trade releases that explain cross-border parcel dynamics. Company filings, investor presentations, and reputable press are used to sanity-check pricing actions, surcharge behavior, and service product changes over the base year. Where needed, we use paid subscriptions for company financials and news, shipment-level trade flows, and patent coverage to cross-check operating scale and signal changes in automation and tracking. These examples are not exhaustive, and other public sources were used for data collection, validation, and clarification.
Primary Interviews and Surveys
Primary work focuses on confirming how operators and large shippers see letter decline, parcel growth, and service-level pricing in the United States, Canada, and Mexico. We speak with postal operators, courier managers, e-commerce shippers, cross-border consolidators, and industry experts so gaps in public reporting (for example, product-level revenue splits) can be filled in and then checked back against the model.
Distribution of primary research fieldwork respondents
| Company type | Respondent position |
|---|---|
| Top tier: 39% | CXOs: 12% |
| Mid tier: 41% | Functional/Unit leaders: 41% |
| Smaller Players: 20% | Managers: 47% |
Market-Sizing & Forecasting
Sizing begins with a top-down build where national postal and delivery revenue pools are reconstructed using reported operating metrics, country-level postal activity indicators, and service mix splits supported by public statements. The result is then corroborated with selective bottom-up approximations, such as sampled price per item times estimated volumes by item type, plus channel checks on enterprise shipping contracts, before totals are adjusted to remove double counting.
Key inputs we track include letter and parcel volume trends, domestic versus international share, the proportion of express services in the mix, average revenue per item (including fuel and peak surcharges where relevant), and network cost pressure signals that tend to trigger price resets. When public data is thin, we use gap-handling rules like proxying missing splits from comparable routes or adjacent years, and then validating those proxies through interviews.
For forecasting, we rely on scenario analysis supported by simple time-series smoothing on core indicators, and assumptions are aligned to expert views on e-commerce maturity, direct mail decline, and regulatory or service obligation constraints that shape pricing freedom. Each forecast step is kept traceable so we and clients can see which variable moved the outcome.
Data Validation & Update Cycle
Outputs are validated through triangulation across at least three angles, typically including operator financial direction, unit volume signals, and implied price realization. Outliers are flagged, and we rerun the calculations after checking for one-off items like contract timing, unusual surcharge periods, or accounting changes that can distort a single year.
Before sign-off, a second analyst reviews the assumptions and the calculation chain to ensure totals reconcile with independent indicators and that the narrative matches observed market behavior. The report is refreshed annually, and interim updates are made when material events occur, such as major tariff or postage changes, labor disruptions, or policy shifts. Right before delivery, we do a fresh pass so the final view reflects the latest public releases and confirmed primary feedback.
Mordor Intelligence's North America Postal Services Market Size Compared With Other Published Estimates
Published values for North America postal services often spread because the service bundle is not described in the same way by every publisher, and the base year differs by study. Currency timing, treatment of cross-border flows, and how price per item is trended also matter, especially when letter volumes are falling but parcel mix is rising.
Some external estimates fold in adjacent logistics revenue streams or broader courier and parcel activity that sits outside traditional postal operations. In Mordor Intelligence, revenue is counted only when it sits inside the postal pickup-sort-transport-deliver chain for letters and parcels across North America, which keeps the totals tied to reported postal activity and validated service mix assumptions.
Benchmark comparison
| Source | Market Size | Gaps in Research Methodology |
|---|---|---|
| Mordor Intelligence | USD 87.88 B (2025) | |
| Industry Publisher A | USD 131.40 B (2026) | Uses a broader service scope that appears to include non-postal courier and last-mile logistics revenues, and it is also anchored to a later year, which can lift the level before like-for-like adjustments are made. |
| Global Consultancy B | USD 202.40 B (2024) | This figure reflects the wider courier, express, and parcel market rather than postal services, so it captures private parcel networks and express activity that are not limited to postal operator workflows. |
The spread in the table mainly comes down to scope and year alignment, not just different math. When like-for-like definitions are applied (letters and parcels within postal service operations, with consistent currency timing), the market size becomes easier to trace back to volumes, service mix, and realized pricing, and it can be repeated as new public data is released.


Key Questions Answered in the Report
What is the current size of the North America postal services market?
The market is valued at USD 88.8 billion in 2026 and is forecast to reach USD 93.56 billion by 2031.
Which segment holds the largest share in the North America postal services market?
Parcels dominate with a 58.05% share in 2025, reflecting the region’s e-commerce boom.
Why is Mexico the fastest-growing country segment?
Near-shoring of manufacturing and the creation of 128 planned industrial parks are generating additional mailroom and cross-border parcel demand, driving a 3.05% CAGR.
How are sustainability mandates influencing postal fleets?
California and other states require phased adoption of zero-emission vehicles, prompting USPS to target 66,000 electric vans by 2028.
What are the main challenges facing postal operators in North America?
Digital substitution of First-Class Mail, labour disruptions, border bottlenecks, and rural addressing gaps are among the critical restraints suppressing growth.
Who is currently the largest parcel carrier by volume?
USPS remains the largest with 6.6 billion parcels handled in 2024, though Amazon Logistics surpassed UPS to claim second place.
Page last updated on:


 Your data is secure and never sold or shared.


