
Market Overview
| Study Period | 2020 - 2031 |
|---|---|
| Forecast Data Period | 2026 - 2031 |
| Base Year Market Size (2025) | USD 9.78 Billion |
| Market Size (2026) | USD 10.68 Billion |
| Market Size (2031) | USD 16.53 Billion |
| Growth Rate (2026 - 2031) | 9.18 % |
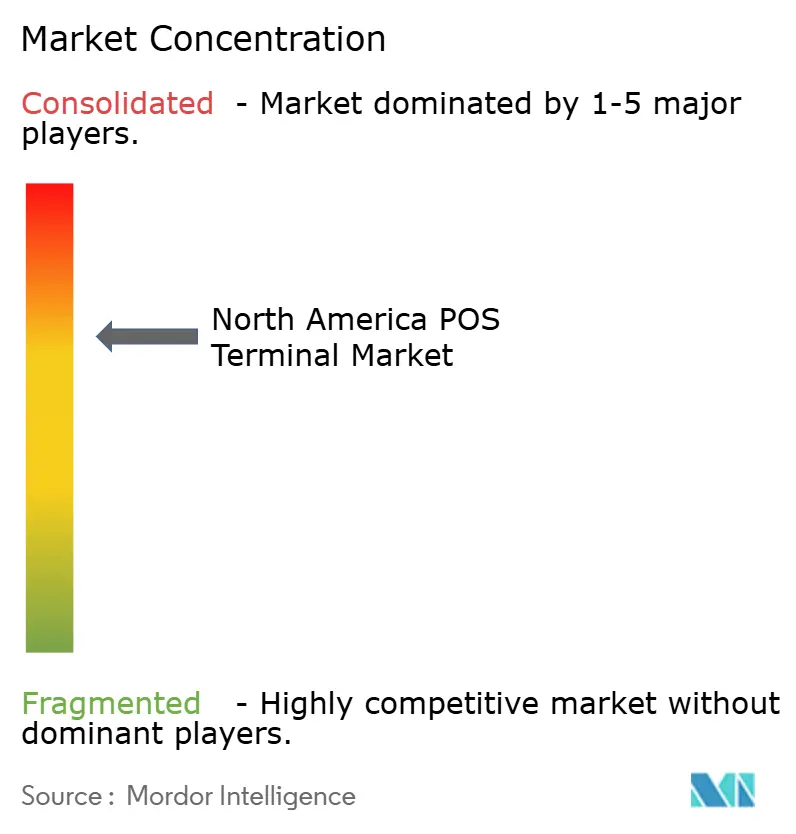
| Market Concentration | Medium |
Major Players *Disclaimer: Major Players sorted in no particular order Image © Mordor Intelligence. Reuse requires attribution under CC BY 4.0. | |
North America POS Terminal Market Analysis by Mordor Intelligence
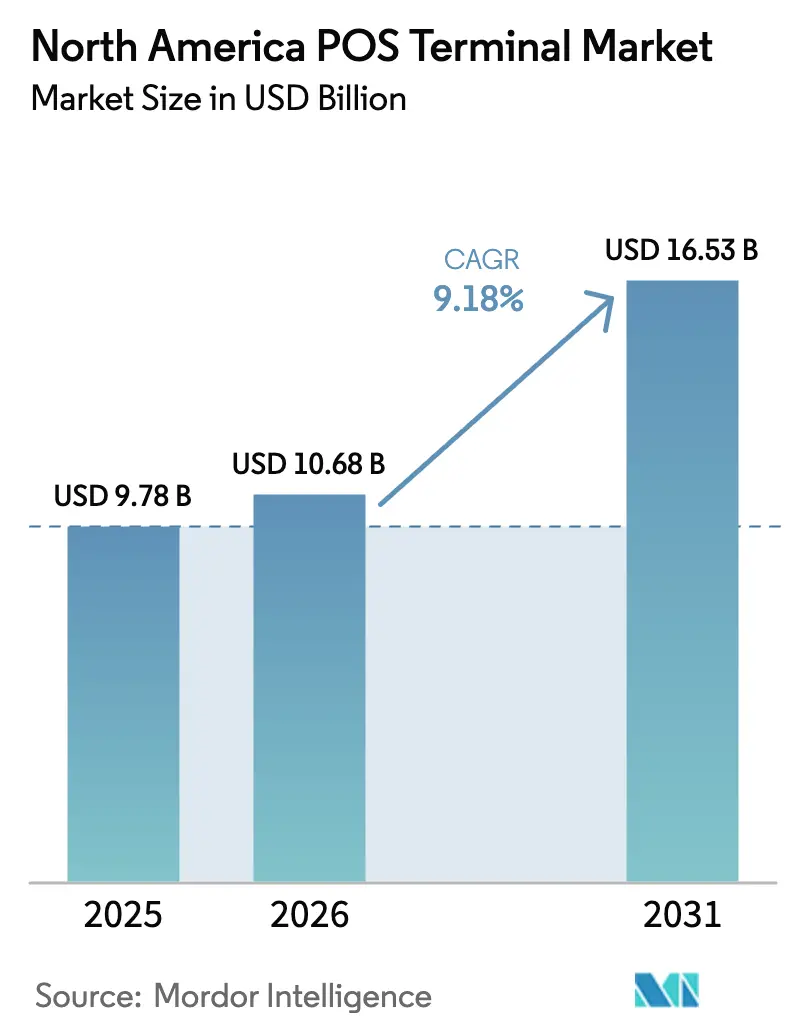
The North America POS terminal market size is expected to grow from USD 9.78 billion in 2025 to USD 10.68 billion in 2026 and is forecast to reach USD 16.53 billion by 2031 at 9.18% CAGR over 2026-2031. Retailers, fuel operators, and healthcare providers lead fresh hardware deployments as mandatory EMV re-issuance triggers renewed demand for dual-interface terminals that support both contact and contactless transactions.[1] Cloud-integrated systems that connect payments with inventory data widen adoption among small merchants after state funding programs lower upfront costs. Domestic chip production incentives under the CHIPS Act improve component availability and shorten refresh cycles after 2026.[2] Tourism rebound, especially into Canada, lifts multi-currency processing volumes, while rising SoftPOS penetration simultaneously pressures entry-level terminal prices.
Key Report Takeaways
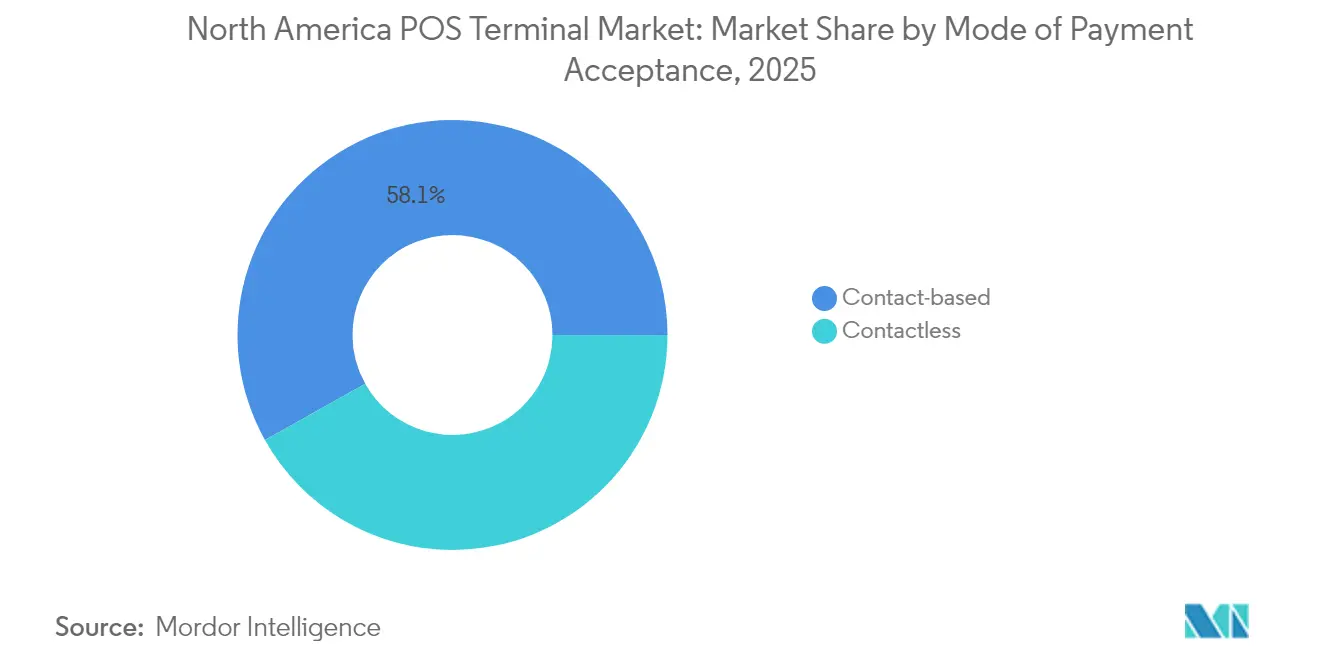
- By mode of payment acceptance, contact-based payment held 58.12% of the North America POS terminal market share in 2025, yet contactless transactions post a 9.08% CAGR through 2031.
- By POS type, fixed systems controlled 60.05% of the North America POS terminal market size in 2025, whereas mobile and portable devices advance at a 9.24% CAGR through 2031.
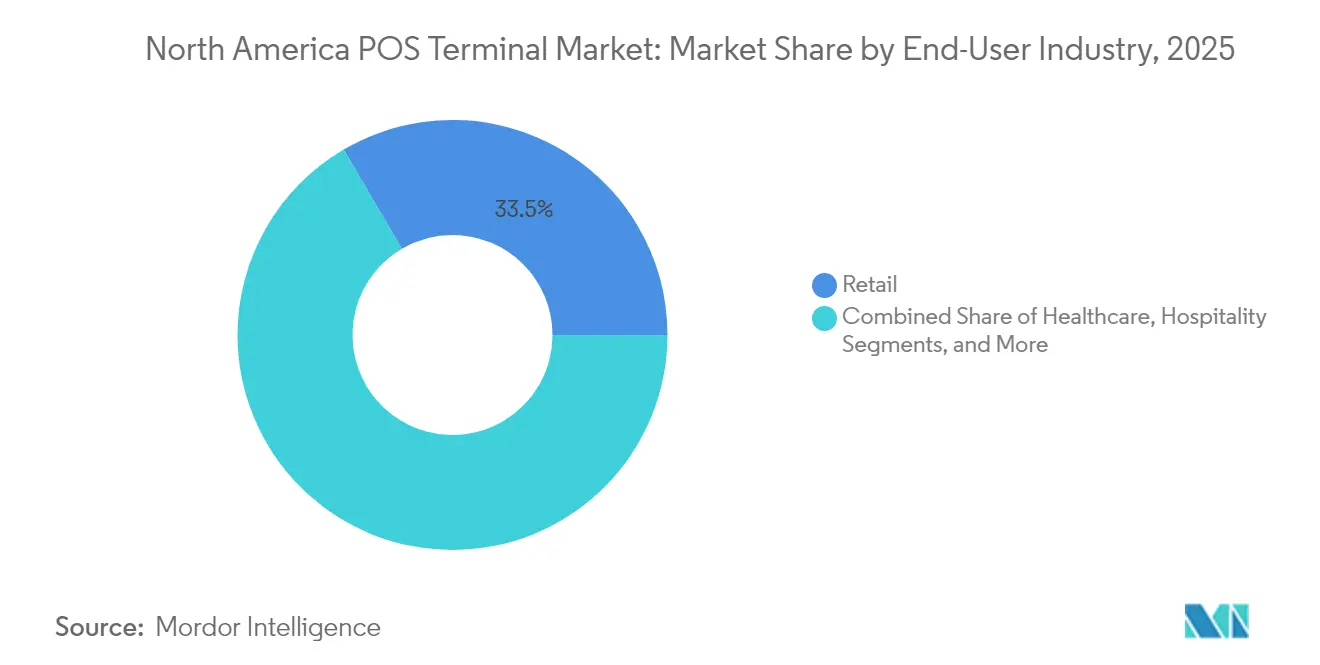
- By end-user, retail accounted for 33.45% of the North America POS terminal market revenue in 2025, while healthcare generates the fastest 8.42% CAGR to 2031
Note: Market size and forecast figures in this report are generated using Mordor Intelligence’s proprietary estimation framework, updated with the latest available data and insights as of 2026.
North America POS Terminal Market Trends and Insights
Drivers Impact Analysis*
| Driver | (~) % Impact on CAGR Forecast | Geographic Relevance | Impact Timeline |
|---|---|---|---|
| Explosion of contactless-card issuance post-2025 EMV re-issuance mandate | +1.2% | United States, Canada, Mexico | Medium term (2-4 years) |
| Retail cloud-POS refresh cycles driven by omnichannel inventory needs | +0.9% | United States, Canada | Short term (≤ 2 years) |
| Rise of AI-driven POS analytics for dynamic pricing and fraud detection | +0.8% | United States, Canada | Long term (≥ 4 years) |
| U.S. gas-station EMV upgrade deadline extending smart-POS roll-outs | +0.7% | United States | Medium term (2-4 years) |
| Cross-border tourism rebound boosting multi-currency POS demand | +0.5% | Canada, Mexico border regions | Short term (≤ 2 years) |
| State-level incentives for small-merchant digitalisation | +0.4% | California, New York, select states | Medium term (2-4 years) |
| Source: Mordor Intelligence | |||
Explosion of Contactless-Card Issuance Post-2025 EMV Re-Issuance Mandate
EMV liability shifts drive cascading re-issuance waves that place contactless cards into consumer hands at record volumes, compelling merchants to adopt dual-interface terminals that reduce tap-to-pay processing times. Roughly 10.8 billion EMV cards circulate worldwide, and 3 billion new units ship each year, creating consistent hardware pull through for certified readers. Fuel operators unable to meet dispenser upgrade deadlines face average fraud costs of USD 201,000 per store across seven years, reinforcing replacement urgency. Compliance with PCI-DSS v4.0 additionally requires tokenization and biometric-ready hardware that many legacy devices cannot support. Terminal manufacturers that bundle remote key injection and firmware management position themselves as preferred partners for acquirers seeking fleet-wide security uniformity.
Retail Cloud-POS Refresh Cycles Driven by Omnichannel Inventory Needs
Unified commerce strategies pressure retailers to synchronize inventory, pricing, and customer data across channels, prompting wholesale replacement of on-premise POS with cloud-native suites.[3] Shopify processed USD 235 billion in gross merchandise volume while supplying merchants with centralized dashboards that connect storefront and e-commerce stock counts, proving the model’s scalability. Lower capital expense owing to subscription software prices unlocks adoption among micro-merchants targeted by state stimulus grants. Real-time data capture enhances loyalty offers and reduces out-of-stock events, directly supporting revenue lift. Vendors that integrate open APIs for third-party loyalty, tax, and logistics modules accelerate ecosystem stickiness.
Rise of AI-Driven POS Analytics for Dynamic Pricing and Fraud Detection
Artificial intelligence embedded inside next-generation terminals shifts the device role from passive processor to real-time decision node.[4] Machine-learning models flag unusual spend patterns and shrink false declines by up to 40% versus rule-based filters, cutting chargeback risk for merchants. Dynamic pricing algorithms adjust shelf prices based on demand and competitor moves, yielding revenue gains of 2-5% at early adopters. Integration of computer vision and natural-language processing inside kiosks provides demographic insights that shape localized product assortments. As retailers add these functions, processor capacity and security overhead both rise, favoring premium terminal tiers.
U.S. Gas-Station EMV Upgrade Deadline Extending Smart-POS Roll-Outs
Fuel dispenser retrofits cost between USD 7,000 and USD 20,000 per pump, incentivizing station owners to choose modular smart POS units that consolidate dispenser control, back-office reporting, and payments. Chevron offers grants of up to USD 10,000 per location, underscoring oil-company urgency to mitigate fraud liabilities. Technician shortages and supply chain lags have pushed many deployments into 2025, stretching demand visibility well beyond initial forecasts. Outdoor-rated terminals require extra ingress protection and temperature tolerance, creating higher average selling prices. Service contracts for ongoing software updates add recurring revenue for integrators.
Restraints Impact Analysis*
| Restraint | (~) % Impact on CAGR Forecast | Geographic Relevance | Impact Timeline |
|---|---|---|---|
| Persistent cyber-attack vectors on Android smart-POS devices | -0.8% | United States, Canada, Mexico | Short term (≤ 2 years) |
| High TCO for PCI-DSS v4.0 compliance among SMBs | -0.6% | United States, Canada | Medium term (2-4 years) |
| SoftPOS cannibalising entry-level hardware sales | -0.5% | United States, Canada | Long term (≥ 4 years) |
| Chipset shortages delaying hardware refresh since 2024 | -0.4% | North America | Short term (≤ 2 years) |
| Source: Mordor Intelligence | |||
Persistent Cyber-Attack Vectors on Android Smart-POS Devices
The open architecture enabling third-party apps on Android terminals also widens attack surfaces, evidenced by high-profile breaches at PAX Technology that led to heightened oversight by payment card regulators. Frequent firmware updates and endpoint monitoring become mandatory, inflating merchant support costs. Enterprises with limited IT teams outsource security to acquirers or managed-service providers, adding subscription overhead. The threat climate nudges risk-averse retailers toward incumbents that embed hardware-based encryption and secure-boot modules. Consequently, newer entrants without proven security credentials struggle to convert large-volume chains.
High TCO for PCI-DSS v4.0 Compliance Among SMBs
Mandatory assessments, penetration testing, and multi-factor authentication elevate total yearly compliance spend to USD 399–200,000 depending on merchant complexity. Cash-flow-sensitive operators delay advanced terminal purchases or default to aggregator models with simplified scope. Vendors offering bundled compliance, remote software patching, and tokenization in a single fee gain traction. Yet price-sensitive micro-merchants remain on legacy mag-stripe readers, representing latent risk for the broader ecosystem. Industry associations lobby for phased timelines or tiered requirements to ease burden.
*Our forecasts treat driver/restraint impacts as directional, not additive. The impact forecasts reflect baseline growth, mix effects, and variable interactions.
Segment Analysis
By Mode of Payment Acceptance: Contactless Demand Rewires Device Design
The North America POS terminal market records contact-based systems with 58.12% share, but contactless readers outsell traditional units at a 9.08% CAGR to 2031 as tap-to-pay habits spread among U.S. consumers. Visa and Mastercard lift no-PIN limits, elevating average contactless ticket sizes and forcing merchants in electronics and jewelry to upgrade to dual-interface models that handle both modalities. Retailers adopting such units gain speed advantages, cutting checkout times by up to 15%. Healthcare operators embrace contactless for hygiene benefits and patient throughput, prompting pharmacy counters to retrofit signature pads with NFC modules. The North America POS terminal market remains split across verticals, yet contactless architectures steadily migrate into heavy-ticket segments once biometric verification stabilizes fraud performance at card networks.
Dual-interface hardware unlocks value-added services such as stored value reloads and commuter card top-ups, diversifying revenue streams for acquirers. Loyalty integration through tokenized card identifiers empowers real-time rewards issuance, raising customer retention metrics. Merchants still rely on contact-based fallback for high-value or chip-on-magstripe fallback events, preserving residual demand for EMV slots. Nevertheless, declining unit costs of NFC components narrow price gaps, shrinking resistance among budget-conscious owners. As a result, the North America POS terminal market size devoted to contactless-enabled form factors is projected to eclipse 70% of total shipments by the end of the decade.

By POS Type: Mobile Devices Embed Commerce Everywhere
Fixed registers accounted for 60.05% of the North America POS terminal market size in 2025, favored by grocery, mass merchant, and fuel segments that require high transaction throughput. Integrated scanners, cash drawers, and conveyor belts sustain their relevance where basket volumes are large. Yet portable readers grow at 9.24% CAGR due to restaurants moving toward table-side settlement, pop-up retail stalls, and curbside pickup lanes. Bluetooth and Wi-Fi-6 connectivity mitigate latency and disconnect risks, while 5G modems unlock deployment in parking lots, farmers markets, and delivery fleets.
Business owners leverage mobile dashboards to reconcile sales and labor costs on a single device, a convenience amplified by battery advances exceeding twelve-hour shift life. App stores curated by terminal providers let operators add payroll, inventory, or marketing modules without reinstalling hardware. Consequently, the North America POS terminal market witnesses a tilt toward hybrid ensembles where fixed hubs manage high-volume lanes and handhelds tackle line-busting or aisle checkout. Vendors bundle both under unified analytics portals, guaranteeing data consistency across device classes.
By End-User Industry: Healthcare Sets the Growth Pace
Retail outlets still contribute 33.45% of the North America POS terminal market share, buoyed by omnichannel inventory demands and cyclical store remodels. Apparel and specialty chains incorporate RFID readers within POS to enable inventory look-up, thus relying on freshly certified hardware. Meanwhile, healthcare facilities register the fastest 8.42% CAGR as insurers push patient-responsibility payments to the point of care. Terminals interfacing with electronic health record systems must meet HIPAA encryption standards, a feature set absent from many legacy devices, creating a clear upgrade window.
Hospitals adopt wall-mounted readers in ambulatory wings and mobile carts that traverse wards, broadening transactional touchpoints. Pharmacies integrate prescription-billing APIs, enabling split tender between insurance and co-pay within a single swipe. Beyond healthcare, hospitality and transportation also recover; airlines install self-service kiosks that embed secure EMV slots and NFC pads to expedite ancillary upselling. Municipal transit agencies deploy ruggedized terminals in ticket booths and handheld conductor tools, further widening the North America POS terminal market addressable footprint.
Geography Analysis
The United States anchors more than two-thirds of the North America POS terminal market because of its vast merchant base and aggressive regulatory timelines. Gas-station EMV retrofits alone involve roughly 120,000 sites, each budgeting up to USD 20,000 per dispenser for compliant readers. State incentives from New York and California funnel grants to small enterprises, elevating penetration in rural counties that previously relied on dial-up terminals. Domestic semiconductor subsidies stabilize supply, shortening lead times after 2026 and fueling fresh deployments in grocery and quick-service chains.
Canada captures share through cross-border tourist inflows that demand multi-currency capabilities. Merchants accepting dynamic currency conversion enjoy marginal revenue lift and lower chargeback risk, leading acquirers such as Moneris to bundle DCC with analytics dashboards. Bilingual interface requirements and Interac network support impose unique certification steps, positioning vendors with localized firmware advantage. Government adoption of contactless fare readers for urban transit, especially in Toronto and Vancouver, further broadens the North America POS terminal market reach within public sector budgets.
Mexico presents the highest organic growth curve, propelled by digital-wallet uptake and infrastructure modernization in travel corridors. Duty-free operators at Cancun and Los Cabos airports insist on terminals handling U.S. dollar and Mexican peso seamlessly, favoring devices with robust currency tables. Government tax reforms mandating electronic invoices accelerate adoption among SMEs, yet connectivity gaps persist in rural states. Acquirer partnerships offering satellite or 4G fallback remove some friction, although after-sales service availability still shapes vendor ranking. Across all three countries, latent demand tied to replacement of non-PCI-compliant readers keeps the North America POS terminal market expansion trajectory intact through 2030.
Regulatory Landscape
POS terminals in North America operate under a layered compliance stack centered on payment security and device certification. PCI Security Standards Council requirements, including PCI DSS v4.0 for merchant and acquirer environments and PCI PTS for PIN-accepting and secure reading devices, alongside EMVCo Level 1 and Level 2 approvals, shape hardware design, key management, and software maintenance cycles. For legacy fleets, this increases the compliance burden and makes secure boot, encryption, and remote update capability more relevant in purchasing decisions.
Terminal electronics also need to meet applicable radio and EMC rules, such as U.S. FCC Part 15 and Canada ISED requirements. Safety certification commonly aligns to UL 62368-1 for ICT equipment. Privacy and data-handling obligations further narrow acceptable architectures, including the California Consumer Privacy Act (CCPA) in the United States and PIPEDA in Canada, which reinforces tokenization and data-minimization practices across cloud-POS deployments and integrated gateway solutions.
Value Chain Analysis
The value chain runs from component suppliers (chipsets, NFC modules, secure elements) to terminal OEMs and ODMs, certification labs, and downstream channel partners. Acquirers, payment gateways, ISVs, and systems integrators deploy and maintain terminal fleets across retail, fuel, and healthcare. For new models, certification and testing for PCI and EMVCo pathways can cost about USD 200,000 to USD 700,000 per device family. That level of testing elevates barriers for smaller entrants and increases reliance on established vendors and platform partners to compress time-to-market.
After deployment, value capture increasingly shifts to services such as remote key injection, compliance updates, device management, and field maintenance contracts alongside payment acceptance and software subscriptions. Supply continuity also acts as a gating factor for refresh cycles; domestic chip production incentives under the U.S. CHIPS Act support component availability. As merchants move toward unified commerce, integration work grows for ISVs and cloud platforms that connect payments with inventory and analytics across fixed and mobile endpoints.
Competitive Landscape
The North America POS terminal market shows moderate concentration as a handful of established vendors hold the bulk of installed units while private-equity funding sparks portfolio reshuffles. Francisco Partners’ USD 3.4 billion take-private of VeriFone injects fresh capital into cloud software development and channel expansion. NCR Voyix pivots toward design-manufacture alliances with Ennoconn, outsourcing hardware to focus on recurring SaaS revenue. Ingenico upgrades its Android AXIUM line, embedding advanced biometrics and semi-integrated payment frameworks that appeal to enterprise retailers.
Disruptors leverage SoftPOS to undermine entry-tier terminals; yet certification complexity and merchant appetite for printed receipts slow absolute cannibalization. Hardware incumbents counter with hybrid offers bundling contactless readers and value-added apps such as loyalty, payroll, and inventory. AI-powered fraud analytics become a key differentiation lever, with Aptos and other software-first players pursuing strategic alliances to embed their engines.
Supply-chain resilience emerges as a competitive moat; GlobalFoundries’ chip fabrication boost under CHIPS Act funding ensures preferential access for domestic terminal builders. Vendors also sharpen service models to capture recurring revenue from compliance updates, remote key injection, and field maintenance. As market penetration deepens, strategic focus shifts toward vertical specializations, healthcare, fuel, and transportation, where certification barriers reduce competitive clutter and support premium pricing.
North America POS Terminal Industry Leaders
-
Castles Technology Co., Ltd.
-
VeriFone Systems, Inc.
-
BBPOS Limited
-
First Data Merchant Services LLC (Fiserv, Inc.)
-
Ingenico S.A.
- *Disclaimer: Major Players sorted in no particular order
Market Opportunities and Future Outlook
Opportunities concentrate in verticals where compliance and operating conditions raise the bar above entry-level card readers. Fuel and outdoor environments, including unattended and ruggedized use cases, continue to require modular, outdoor-rated terminals with stronger security and lifecycle management. In healthcare checkout and point-of-care collections, terminals also need to align with stricter data protection practices and fit into clinical workflows.
Platform-led partnerships provide another route to growth. Vendors are bundling Android POS hardware with software ecosystems and service coverage to reduce rollout complexity across dispersed merchant estates. Castles Technology, for instance, has emphasized a service-oriented strategy, including its February 2026 acquisition of MT Bilgi Teknolojileri to deepen regional service capabilities. This is supported by early-2026 partnerships focused on expanding Android-based acceptance in unattended services, EV charging, and retail. At the same time, SoftPOS is widening acceptance footprints for smaller merchants and line-busting scenarios, which increases demand for orchestration, security tooling, and semi-integrated architectures that help keep payment data scope manageable under PCI DSS v4.0.
Recent Industry Developments
- February 2026: Verifone expanded strategic partnership with Unzer to integrate advanced hardware and acquiring capabilities, initially available in Germany, Denmark, Norway, Sweden, and Finland. The expansion strengthens hardware software integration and multi-region acquiring presence for enterprise retailers.
- January 2026: Verifone expanded Victa device portfolio and new partnerships with Shopify, Bilt, and Aevi in NRF 2026. The expanded device offerings bolster NA market penetration. The enhancement reinforces cloud software ecosystem and merchant reach through partner ecosystem expansion.
- January 2026: Castles Technology partnered with Smart Payment Technologies to integrate hardware platforms with its payment technology ecosystem. The collaboration strengthens Castles' NA payments hardware ecosystem. The partnership supports broader deployment across sectors like EV charging and retail through open, partner-first platform.
Research Methodology Framework and Report Scope
Market Definition and Coverage
For this study, the market covers the revenues earned from point of sale (POS) terminal hardware used by merchants in North America to accept and process in person payments, including fixed countertop devices and mobile or portable terminals.
Scope exclusions: We exclude pure software POS subscriptions, gateway only processing services, and consumer devices used without dedicated POS terminal hardware.
Segmentation Overview
- By Mode of Payment Acceptance
- Contact-based
- Contactless
- By POS Type
- Fixed Point-of-Sale Systems
- Mobile / Portable Point-of-Sale Systems
- By End-User Industry
- Retail
- Hospitality
- Healthcare
- Transportation and Logistics
- Other End-User Industries
- By Country
- United States
- Canada
- Mexico
Data Sources, Market Sizing, and Validation
Desk Research
Desk research helped us set the boundaries of what counts as a POS terminal, and it also provided the steady data series needed to keep assumptions realistic. We referred to public sources such as the US Census Bureau (retail sales and business counts), Statistics Canada (merchant activity and payment trends), the Federal Reserve (payments studies and card usage), and EMVCo and regional payments forum publications for EMV and contactless adoption guidance. Where trade flows and supply signals were useful, we also checked official customs and tariff schedules and import statistics released by government portals.
To connect these signals to market value, we reviewed company filings, investor decks, product catalogs, and reputable press for device refresh cycles, feature shifts (contactless, dual interface), and channel patterns across retail, hospitality, and fuel. Select paid subscriptions were used only to speed up company financial comparisons, patent lookups, and shipment level trade checks when public disclosure was thin. These desk sources are not exhaustive, and we relied on additional public documents to validate and clarify individual data points during the analysis.
Primary Interviews and Surveys
Primary work focused on interviews and short surveys with payment ecosystem participants, including merchant acquiring teams, POS distributors, systems integrators, and large merchant operators. We used these conversations to confirm what merchants are actually buying now in North America, how price points move with contactless and dual interface upgrades, and where adoption is slower due to replacement timing or integration limits. Since this is a regional market, feedback was balanced across the US and Canada, with inputs weighted toward higher transaction density corridors and multi site merchants.
Distribution of primary research fieldwork respondents
| Company type | Respondent position |
|---|---|
| Top tier: 38% | CXOs: 16% |
| Mid tier: 44% | Functional/Unit leaders: 26% |
| Smaller Players: 18% | Managers: 58% |
Market-Sizing & Forecasting
Sizing started with a top down build where the demand pool is reconstructed from merchant counts, in store card and contactless usage, and typical terminal replacement cycles, which are then translated into annual unit needs and value using observed average selling prices. That total was then checked using selective bottom up approximations, mainly supplier and channel roll ups for a sample of terminal categories, along with ASP times volume calculations for key end user groups. When gaps appeared in the bottom up view, they were handled through conservative coverage factors that were later re tested in primary calls.
Key inputs used in the model included the share of contactless transactions in physical retail, EMV compliance driven upgrade timing (including fuel related replacement waves), the mix shift between fixed and mobile terminals, merchant openings and closures, and observed pricing differences between basic acceptance devices and feature rich terminals. Forecasts were built using scenario analysis. In the base case, we assumed steady card usage, gradual price pressure from lower cost acceptance options, and a measured refresh cadence. The final trajectory was adjusted based on consensus ranges shared by industry respondents.
Data Validation & Update Cycle
Outputs were validated through multiple checks, starting with internal consistency tests on units, pricing, and implied replacement rates by country and end use. We compared model totals against independent signals such as payment acceptance growth indicators, published payment trend studies, and directional revenue disclosures from relevant parts of vendor filings, and then investigated any sharp variances before sign off. If an assumption moved the market too strongly without support, we re contacted respondents to confirm whether the change was real or timing related.
Reports are refreshed annually, and interim updates are made when material events change demand, pricing, or supply availability. Before delivery, a final analyst pass is completed so the latest public releases and key market events are reflected in the narrative and numbers.
Mordor Intelligence's North America Pos Terminal Market Size Versus Other Published Estimates
Published market values for POS terminals in North America can differ because each publisher draws the line between hardware, software, and payment services in a slightly different way, and they also pick different base years and price assumptions.
The benchmark table shows a spread that is mainly explained by what is counted as terminal revenue and how replacement timing is treated. In Mordor Intelligence's model, the value tracks dedicated POS terminal hardware sales (fixed and mobile) while leaving out standalone software subscriptions even when they are sold as part of a broader merchant bundle.
Benchmark comparison
| Source | Market Size | Gaps in Research Methodology |
|---|---|---|
| Mordor Intelligence | USD 9.78 B (2025) | |
| Industry Association A | USD 8.92 B (2025) | Uses a narrower device definition that leans toward traditional countertop terminals and tends to undercount mobile or portable deployments used by small and seasonal merchants. |
| Trade Journal B | USD 11.21 B (2026) | Blends hardware with adjacent merchant enablement revenues and applies a higher upgrade pace assumption tied to contactless expansion, which lifts the value for the same region. |
Looking across the figures, the lower estimate is driven by a tighter hardware definition, while the higher one is pulled up by including adjacent revenue pools and faster refresh timing. By keeping scope rules explicit and tying forecasts to observable demand signals like replacement cadence, contactless share, and device mix, the final value stays traceable and repeatable for planning.
Key Questions Answered in the Report
What is the current value of the North America POS terminal market?
It is valued at at USD 10.68 Billion in 2026, and is expected to reach USD 16.53 Billion by 2031.
How fast are contactless payments growing in North America?
Contactless transactions through POS devices are expanding at a 9.08% CAGR between 2026 and 2031.
Which POS hardware type is expanding the quickest?
Mobile and portable POS devices register a 9.24% CAGR through 2031 as merchants seek flexibility.
Why is healthcare a key growth vertical for POS terminals?
Patient payment digitization and HIPAA-aligned security needs push healthcare POS demand at an 8.42% CAGR.
How do state incentives influence POS adoption?
Programs such as New York’s USD 1 billion fund reimburse technology costs, accelerating small-merchant upgrades.