Market Overview
| Study Period | 2017 - 2030 |
|---|---|
| Base Year For Estimation | 2024 |
| Forecast Data Period | 2025 - 2030 |
| Market Size (2025) | USD 5.62 Billion |
| Market Size (2030) | USD 6.9 Billion |
| Growth Rate (2025 - 2030) | 4.19% CAGR |
| Market Concentration | Medium |
Major Players*Disclaimer: Major Players sorted in no particular order Image © Mordor Intelligence. Reuse requires attribution under CC BY 4.0. | |

North America Plant Protein Ingredients Market Analysis by Mordor Intelligence
The North America Plant Protein Ingredients Market size is estimated at 5.62 billion USD in 2025, and is expected to reach 6.9 billion USD by 2030, growing at a CAGR of 4.19% during the forecast period (2025-2030).
The North American plant protein ingredients market is experiencing a fundamental shift in consumer preferences, driven by increasing health consciousness and environmental awareness. A significant indicator of this transformation is that 61% of consumers in the United States now consider plants to be their preferred protein source over animal-based alternatives. This shift is particularly pronounced among younger demographics who are actively seeking sustainable and ethical food choices. The industry has responded to this changing landscape by expanding product offerings and improving the taste, texture, and nutritional profiles of vegan protein ingredients. Major retailers have significantly expanded their plant-based sections, creating dedicated spaces for these products and increasing their visibility to mainstream consumers.
Innovation in product development and processing technologies has become a cornerstone of the industry's growth strategy. Manufacturers are investing heavily in research and development to improve the functionality and versatility of plant protein ingredients, particularly in terms of taste, texture, and nutritional value. The meat alternatives segment has emerged as a major innovation driver, with manufacturers developing sophisticated protein extraction and processing techniques to better mimic the sensory properties of traditional meat products. This technological advancement has led to the development of more sophisticated protein ingredients that can be used across a broader range of applications, from beverages to baked goods.
The retail landscape for plant protein products has undergone significant transformation, with plant-based food retail sales experiencing remarkable growth. In 2022, retail sales of plant-based food products in the United States recorded a substantial 27% increase compared to the previous year, indicating strong consumer acceptance and market penetration. Retailers are responding to this trend by expanding shelf space for natural protein ingredients and developing private label offerings to capture market share. The industry has also witnessed increased collaboration between ingredient manufacturers and food companies to develop innovative applications and improve product accessibility.
Sustainability considerations are increasingly influencing industry development and consumer choices in the plant-based protein market in the US. Major food manufacturers are investing in sustainable sourcing practices and implementing environmentally friendly processing methods. The industry is witnessing a surge in partnerships between ingredient suppliers and agricultural producers to ensure sustainable and traceable supply chains. Companies are also focusing on reducing water usage and carbon emissions in their production processes, responding to growing consumer demand for environmentally responsible products. This emphasis on sustainability has led to increased investment in local sourcing and processing facilities, reducing transportation costs and environmental impact while supporting regional agricultural communities.
North America Plant Protein Ingredients Market Trends and Insights
Plant protein consumption growth fuels opportunities for key players in the ingredients industry
- From 2017 to 2022, the region saw a 2.42% increase in per capita plant protein consumption, driven by investments and innovations. This surge was primarily fueled by a growing number of consumers shifting toward vegan or vegetarian diets, largely motivated by concerns for animal welfare. Notably, in 2020, approximately 9.6 million more Americans adopted plant-based diets, constituting nearly 3% of the US population. After the COVID-19 pandemic, plant protein consumption surged, partly due to concerns over viral contamination in animal-sourced proteins and a general increase in protein blends, including both animal and plant sources.
- While most Americans are reducing their meat intake, they are not eliminating it, leaning more toward a flexitarian diet than strict veganism or vegetarianism. Plant proteins find significant usage in sports nutrition and as meat alternatives. Soy and whey proteins, in particular, are prevalent in food and beverage, supplements, and sports nutrition. By 2021, 36% of US consumers were familiar with and had consumed soy protein, with a slightly lower share of 31% having tried whey protein.
- Canada boasts the second-largest flexitarian population, showcasing a significant shift toward flexitarianism and veganism among consumers. This trend presents a ripe opportunity for manufacturers to further innovate in the plant protein market. In 2021, the Canadian government pledged over USD 4.3 million to bolster the country's pulse and special crop farmers, aligning with the rising consumer appetite for sustainable, high-quality plant-based proteins.

Understand The Key Trends Shaping This Market
Download PDF
Soy, wheat, and rice production contribute majorly as raw materials for plant protein ingredient manufacturers
- The graph depicts the total production of raw materials such as dry peas, rice, wheat, and soya beans. The United States is the key producer of some plant protein raw materials in North America. The country produces about one-third of the total soybeans in the world, followed closely by Brazil and Argentina. In 2021, the country produced 119.88 million MT of soybeans, accounting for 31% shares of the global soybean production. Soybeans are the third-largest field crop in Canada. Soybeans have become an important cash crop in cities like Quebec and Manitoba, Maritimes, southeast Saskatchewan, and southern Alberta. Presently, Canada is the producer of 200 registered soybean varieties. Among those registered varieties, 80% of soybeans are herbicide-tolerant.
- The United States is also the wheat-producing leader in the region, followed by Canada, with both countries accounting for almost 100% of the regional wheat production. Wheat ranks third among US field crops, behind corn and soybeans, in planted acreage, production, and gross farm receipts. In the marketing year 2023-2024, US farmers produced 1.8 billion bushels of winter, durum, and other spring wheat from a harvested area of 37.3 million acres. Winter wheat production represents nearly 70% of the total US production. Similarly, in 2023, Canadian farmers grew almost 32 million tons of wheat.
- Arkansas Grand Prairie, Mississippi Delta, Gulf Coast, and Sacramento Valley of California are four regions producing almost the entire US rice crop. Each region typically specializes in a specific type of rice, referred to in the United States by the length of grain, i.e., long, medium, and short. In general, long-grain production accounts for approximately 75% of US rice production.

Understand The Key Trends Shaping This Market
Download PDF
OTHER KEY INDUSTRY TRENDS COVERED IN THE REPORT
- Organic baby food is expected to drive the market in the future
- Fortified beverages are expected to witness a rise in sales during the forecast period
- An increase in the demand for single-serve packets may augment production
- Dairy alternatives are expected to witness a significant growth rate
- Great opportunities for meat alternative products
- Key players are focusing more on healthy ingredients post the COVID-19 pandemic
- Steady demand from the United States to support market growth
- Large commercial players lead the growth of the bakery industry
- Consumer shift toward low-carb diets poses a threat to market growth
- Key players are expected to focus on fortification and nutritional enrichment
- The emphasis on awareness and innovation is one of the major growth drivers of the elderly nutrition market
- E-commerce is expected to emerge as one of the most preferred channels
- Sport/performance nutrition to witness significant growth during the forecast period
- The cosmetic industry to be driven by synergy of innovation and social media influence
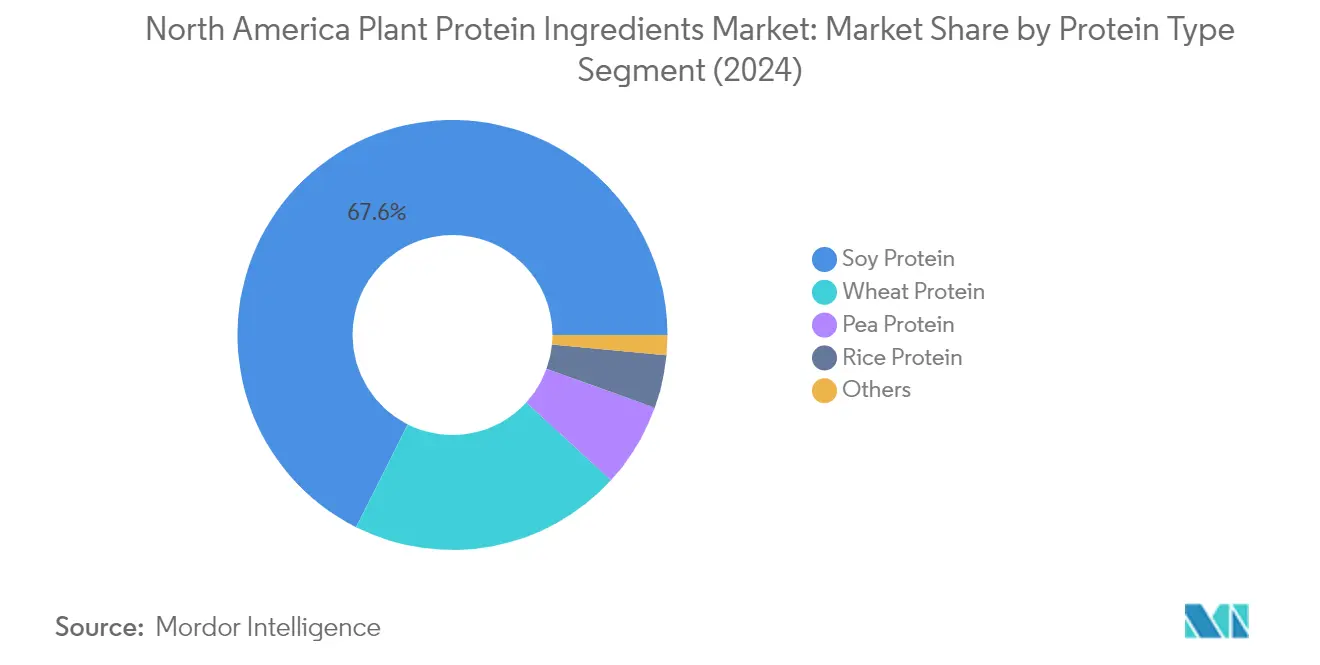
Segment Analysis: Protein Type
Soy Protein Segment in North America Plant Protein Ingredients Market
Soy protein continues to maintain its dominant position in the North American plant protein ingredients market, commanding approximately 68% market share in 2024. This substantial market presence can be attributed to soy protein ingredients' versatility across various applications, particularly in meat alternatives and dairy alternatives segments, which together account for about 80% of soy protein consumption. The ingredient's cost-effectiveness compared to other plant proteins, being priced about 5-10% lower than mainstream protein sources, further strengthens its market position. Additionally, soy protein ingredients' high protein content, excellent amino acid profile, and superior functionalities like high dispersibility, solubility, and emulsion capacity make it the preferred choice among manufacturers in the region.
Pea Protein Segment in North America Plant Protein Ingredients Market
The pea protein ingredients segment is projected to exhibit the strongest growth trajectory in the North American plant protein ingredients market, with an anticipated growth rate of approximately 6% during 2024-2029. This accelerated growth is primarily driven by pea protein ingredients' superior nutritional profile, containing approximately 19% more protein content than other plant proteins like wheat and potato protein. The segment's expansion is further supported by increasing applications in sports nutrition and weight management products, with major firms like Nestlé and Abbott Nutrition incorporating pea protein ingredients into their product formulations. The ingredient's clean label claims and non-allergenic properties are particularly appealing to manufacturers developing products for health-conscious consumers.
Remaining Segments in Protein Type
The other segments in the North American plant protein ingredients market include wheat protein, rice protein ingredients, potato protein, hemp protein, and other emerging plant proteins. Wheat protein holds a significant position as the second-largest segment, particularly driven by its extensive applications in the bakery industry. Rice protein ingredients have gained traction due to their hypoallergenic properties and excellent digestibility, while potato protein serves specific niches in both food and feed applications. Hemp protein, though smaller in market share, is increasingly recognized for its complete amino acid profile and sustainability credentials. These diverse protein sources collectively contribute to the market's depth, offering manufacturers various options to meet different functional and nutritional requirements.
Segment Analysis: End User
Food & Beverages Segment in North America Plant Protein Market
The Food & Beverages segment dominates the North American plant protein ingredients market, accounting for approximately 55% of the total market value in 2024. This significant market share is primarily driven by the increasing incorporation of textured vegetable protein and plant protein isolates in various food applications, particularly in the meat alternatives and dairy alternatives sub-segments. The segment's growth is further supported by the rising consumer demand for plant-based products, with manufacturers continuously innovating to develop new plant protein-fortified food and beverage products. The bakery, snacks, and ready-to-drink beverage categories have emerged as key application areas, while the meat substitutes market continues to expand with new product launches incorporating various plant proteins like soy, pea, and wheat proteins.
Supplements Segment in North America Plant Protein Market
The Supplements segment is projected to exhibit the strongest growth trajectory in the North American plant protein ingredients market between 2024 and 2029, with an expected CAGR of approximately 6%. This accelerated growth is primarily driven by the increasing consumer focus on health and wellness, particularly in the sports nutrition category. The segment's expansion is supported by the rising popularity of plant protein isolates and plant protein concentrates among athletes and fitness enthusiasts, who are increasingly seeking alternatives to traditional animal-based proteins. The growth is further bolstered by innovations in protein formulations, improved taste profiles, and enhanced functionality of plant-based supplement products, particularly in categories like sports nutrition, elderly nutrition, and medical nutrition.
Remaining Segments in End User Segmentation
The Animal Feed and Personal Care & Cosmetics segments represent significant opportunities in the North American plant protein ingredients market. The Animal Feed segment maintains a substantial presence, driven by the increasing demand for sustainable and cost-effective protein sources in livestock and pet food applications. The Personal Care & Cosmetics segment, while smaller in market share, is gaining traction due to the growing consumer preference for natural and plant-based ingredients in beauty and personal care products. Both segments benefit from ongoing research and development activities, leading to new applications and improved functionality of plant proteins in their respective end-use applications.
North America Plant Protein Ingredients Market Geography Segment Analysis
Plant Protein Ingredients Market in the United States
The United States dominates the North American plant protein ingredients market, commanding approximately 68% of the regional market value in 2024. The country's market leadership is driven by its robust food and beverage manufacturing sector, particularly in the meat alternatives and dairy alternatives segments. The growing vegan and flexitarian population has significantly influenced market dynamics, with about 61% of U.S. consumers now preferring plant-based protein sources over animal-based alternatives. The market is characterized by continuous innovation in protein extraction technologies and processing methods, particularly in soy and pea protein segments. Major food manufacturers are increasingly incorporating plant proteins into their product portfolios, responding to the rising consumer demand for sustainable and healthier protein alternatives. The market is further strengthened by the presence of leading plant protein manufacturers and extensive research and development facilities. The country's well-established retail and distribution networks, coupled with high consumer awareness about plant-based products, continue to drive market growth in the U.S. plant-based protein market.
Plant Protein Ingredients Market in Mexico
Mexico represents the most dynamic market in the region, projected to grow at approximately 7% CAGR from 2024 to 2029. The country's North American plant-based protein market is experiencing rapid transformation, driven by increasing health consciousness and growing acceptance of plant-based alternatives among Mexican consumers. Traditional Mexican cuisine, which has historically been plant-based, provides a strong foundation for the adoption of plant protein ingredients. The market is witnessing significant growth in both domestic production and consumption of plant proteins, particularly in the soy protein segment. Mexican food manufacturers are increasingly incorporating plant proteins into traditional products, creating innovative fusion offerings that appeal to both local and international tastes. The country's strategic location and trade agreements with major economies have attracted international plant protein manufacturers, leading to increased investment in local production facilities. The growing middle class, urbanization, and increasing awareness about sustainable food choices are further catalyzing market growth.
Plant Protein Ingredients Market in Canada
Canada has established itself as a significant player in the North American plant protein ingredients market, leveraging its vast agricultural resources and advanced food processing capabilities. The country has positioned itself as a major producer of plant-based proteins, particularly in the pea and canola protein segments. Canadian consumers' increasing preference for plant-based alternatives has led to significant market expansion, with the country boasting the second-largest flexitarian population in North America. The government's support through initiatives and investments in plant protein research and development has strengthened the market infrastructure. Canadian manufacturers are focusing on developing innovative plant protein ingredients with improved functionality and nutritional profiles. The country's commitment to sustainable agriculture and environmentally conscious production methods has attracted both domestic and international investments in the plant protein sector.
Plant Protein Ingredients Market in Other Countries
The rest of North America, including countries like Jamaica, Cuba, Panama, Costa Rica, and Guatemala, represents an emerging market for plant protein ingredients. These markets are characterized by growing awareness of plant-based nutrition and increasing adoption of Western dietary patterns. The food processing industry in these countries is gradually incorporating plant proteins into traditional products, creating unique fusion offerings that cater to local tastes while meeting global trends. While these markets are currently smaller in scale, they show promising potential for future growth, particularly in the natural and organic segments. The increasing tourism industry in these regions is also driving the demand for plant-based protein options, as hotels and restaurants expand their menu offerings to cater to international visitors' preferences. The market development in these countries is supported by improving distribution networks and growing retail infrastructure.
Get Analysis on Important Geographic Markets
Download PDF
Competitive Landscape
Top Companies in North America Plant Protein Market
The North American plant protein ingredients market is characterized by intense innovation and strategic expansion activities among key players like Archer Daniels Midland Company, CHS Inc., International Flavors & Fragrances, and Bunge Limited. Companies are heavily investing in research and development to create novel protein ingredients formulations, particularly focusing on improving texture, taste, and functionality for various applications. Operational agility is demonstrated through vertically integrated supply chains and state-of-the-art manufacturing facilities equipped with advanced technology. Strategic moves predominantly involve partnerships with regional clients and expansion of production capacities to meet growing demand. Market leaders are also pursuing geographical expansion through new facility establishments and acquisitions, particularly targeting emerging plant-based food markets. The industry has witnessed a significant trend toward sustainable sourcing practices and clean label protein certifications to meet evolving consumer preferences.
Consolidated Market Led By Global Players
The North American plant protein market exhibits a consolidated structure dominated by large multinational corporations with diverse product portfolios spanning multiple protein sources. These conglomerates leverage their extensive research capabilities, established distribution networks, and strong financial positions to maintain market leadership. Many leading players are traditional agricultural processors who have successfully diversified into the plant protein segment, bringing decades of expertise in ingredient processing and formulation. The market has seen significant merger and acquisition activity, with larger players acquiring specialized plant protein manufacturers to expand their technological capabilities and product offerings.
The competitive landscape is further shaped by the presence of specialized players focusing on specific protein sources or applications, though their market share remains relatively small compared to the industry leaders. These specialists often compete through innovation in niche segments, such as novel protein extraction technologies or unique application-specific formulations. The market has witnessed increased collaboration between established players and startups, particularly in developing new plant protein sources and improving existing protein functionalities. This collaborative approach has become a key strategy for market expansion and technological advancement.
Innovation and Sustainability Drive Future Success
Success in the North American plant protein market increasingly depends on companies' ability to develop innovative products while maintaining sustainable practices throughout their supply chains. Market leaders are focusing on vertical integration to ensure consistent quality and supply of raw materials, while also investing in advanced processing technologies to improve protein functionality and reduce production costs. Companies are establishing strategic partnerships with farmers and agricultural cooperatives to secure raw material supply and implement sustainable farming practices. The ability to offer clean label protein products with transparent sourcing and environmental credentials has become crucial for maintaining market position.
For new entrants and smaller players, success lies in identifying and exploiting niche market opportunities while building strong relationships with end-users in specific application segments. Companies need to focus on developing specialized protein ingredients that address specific functional requirements in food applications, particularly in the growing meat alternative ingredients and dairy alternative ingredients segments. Regulatory compliance and certification requirements, particularly regarding food safety and labeling, continue to influence market dynamics and entry barriers. The increasing focus on protein quality and amino acid profiles in plant-based products is driving companies to invest in research and development capabilities, making technological expertise a critical success factor for future growth.
North America Plant Protein Ingredients Industry Leaders
Archer Daniels Midland Company
Bunge Limited
CHS Inc.
International Flavors & Fragrances, Inc.
Kerry Group PLC
- *Disclaimer: Major Players sorted in no particular order

Need More Details on Market Players and Competitors?
Download PDF
Recent Industry Developments
- June 2022: Roquette, a plant-based protein manufacturer, released two novel rice proteins to address the market demand for meat substitute applications. The new Nutralys rice protein line includes a rice protein isolate and a rice protein concentrate.
- May 2022: BENEO, a subsidiary of Südzucker, entered a purchase agreement to acquire Meatless BV, a producer of functional ingredients. BENEO is expanding its existing product offering with the acquisition to offer an even broader range of texturizing solutions for meat and fish alternatives.
- February 2022: MGP Ingredients announced the construction of a new extrusion plant in Kansas to manufacture its ProTerra line of texturized proteins. The USD 16.7 million facility will be located next to the company's Atchison site and will initially produce up to 10 million pounds of ProTerra annually. The new plant will assist MGP in meeting the rising demand for its ProTerra product line, which comprises pea and wheat protein ingredients used in applications such as plant-based meat substitutes.
North America Plant Protein Ingredients Market Report Scope
Hemp Protein, Pea Protein, Potato Protein, Rice Protein, Soy Protein, Wheat Protein are covered as segments by Protein Type. Animal Feed, Food and Beverages, Personal Care and Cosmetics, Supplements are covered as segments by End User. Canada, Mexico, United States are covered as segments by Country.Protein Type
| Hemp Protein |
| Pea Protein |
| Potato Protein |
| Rice Protein |
| Soy Protein |
| Wheat Protein |
| Other Plant Protein |
End User
| Animal Feed | ||
| Food and Beverages | By Sub End User | Bakery |
| Beverages | ||
| Breakfast Cereals | ||
| Condiments/Sauces | ||
| Confectionery | ||
| Dairy and Dairy Alternative Products | ||
| Meat/Poultry/Seafood and Meat Alternative Products | ||
| RTE/RTC Food Products | ||
| Snacks | ||
| Personal Care and Cosmetics | ||
| Supplements | By Sub End User | Baby Food and Infant Formula |
| Elderly Nutrition and Medical Nutrition | ||
| Sport/Performance Nutrition | ||
Country
| Canada |
| Mexico |
| United States |
| Rest of North America |
| Protein Type | Hemp Protein | ||
| Pea Protein | |||
| Potato Protein | |||
| Rice Protein | |||
| Soy Protein | |||
| Wheat Protein | |||
| Other Plant Protein | |||
| End User | Animal Feed | ||
| Food and Beverages | By Sub End User | Bakery | |
| Beverages | |||
| Breakfast Cereals | |||
| Condiments/Sauces | |||
| Confectionery | |||
| Dairy and Dairy Alternative Products | |||
| Meat/Poultry/Seafood and Meat Alternative Products | |||
| RTE/RTC Food Products | |||
| Snacks | |||
| Personal Care and Cosmetics | |||
| Supplements | By Sub End User | Baby Food and Infant Formula | |
| Elderly Nutrition and Medical Nutrition | |||
| Sport/Performance Nutrition | |||
| Country | Canada | ||
| Mexico | |||
| United States | |||
| Rest of North America | |||
Need A Different Region or Segment?
Customize Now
Market Definition
- End User - The Protein Ingredients Market operates on a B2B basis. Food, Beverages, Supplements, Animal Feed, and Personal Care & Cosmetic manufacturers are considered to be end-consumers in the market studied. The scope excludes manufacturers buying liquid/dry whey to be used for application as a binding agent or thickener or other non-protein applications.
- Penetration Rate - Penetration Rate is defined as the percentage of Protein-Fortified End User Market Volume in the Overall End User Market Volume.
- Average Protein Content - Average protein content is the average protein content present per 100 g of product manufactured by all end-user companies considered under the scope of this report.
- End User Market Volume - End-user market volume is the consolidated volume of all types and forms of end-user products in the country or region.
| Keyword | Definition |
|---|---|
| Alpha-lactalbumin (α-Lactalbumin) | It is a protein that regulates the production of lactose in the milk of almost all mammalian species. |
| Amino acid | It is an organic compound that contains both amino and carboxylic acid functional groups, which are required for the synthesis of body protein and other important nitrogen-containing compounds, such as creatine, peptide hormones, and some neurotransmitters. |
| Blanching | It is the process of briefly heating vegetables with steam or boiling water. |
| BRC | British Retail Consortium |
| Bread improver | It is a flour-based blend of several components with specific functional properties designed to modify dough characteristics and give quality attributes to bread. |
| BSF | Black Soldier Fly |
| Caseinate | It is a substance produced by adding an alkali to acid casein, a derivative of casein. |
| Celiac disease | Celiac disease is an immune reaction to eating gluten, a protein found in wheat, barley, and rye. |
| Colostrum | It is a milky fluid that’s released by mammals that have recently given birth before breast milk production begins. |
| Concentrate | It is the least processed form of protein and has a protein content ranging from 40-90% by weight. |
| Dry protein basis | It refers to the percentage of "pure protein" present in a supplement after the water in it is completely removed through heat. |
| Dry whey | It is the product resulting from drying fresh whey which has been pasteurized and to which nothing has been added as a preservative. |
| Egg protein | It is a mixture of individual proteins, including ovalbumin, ovomucoid, ovoglobulin, conalbumin, vitellin, and vitellenin. |
| Emulsifier | It is a food additive that facilitates the blending of foods that are immiscible with one another, such as oil and water. |
| Enrichment | It is the process of addition of micronutrients that are lost during the processing of the product. |
| ERS | Economic Research Service of the USDA |
| Extrusion | It is the process of forcing soft mixed ingredients through an opening in a perforated plate or die designed to produce the required shape. The extruded food is then cut to a specific size by blades. |
| Fava | Also known as Faba, it is another word for yellow split beans. |
| FDA | Food and Drug Administration |
| Flaking | It is a process in which typically a cereal grain (like corn, wheat, or rice) is broken down into grits, cooked with flavors and syrups, and then pressed into flakes between cooled rollers. |
| Foaming agent | It is a food ingredient that makes it possible to form or maintain a uniform dispersion of a gaseous phase in a liquid or solid food. |
| Foodservice | It refers to the part of the food industry which includes businesses, institutions, and companies which prepare meals outside the home. It includes restaurants, school and hospital cafeterias, catering operations, and many other formats. |
| Fortification | It is the deliberate addition of micronutrients that are not found in them naturally or which are lost during processing, to improve a food product's nutritional value. |
| FSANZ | Food Standards Australia New Zealand |
| FSIS | Food Safety and Inspection Service |
| FSSAI | Food Safety and Standards Authority of India |
| Gelling agent | It is an ingredient that functions as a stabilizer and thickener to provide thickening without stiffness through the formation of gel. |
| GHG | Greenhouse Gas |
| Gluten | It is a family of proteins found in grains, including wheat, rye, spelt, and barley. |
| Hemp | It is a botanical class of Cannabis sativa cultivars grown specifically for industrial or medicinal use. |
| Hydrolysate | It is a form of protein manufactured by exposing the protein to enzymes that can partially break the bonds between the protein's amino acids and break down large, complicated proteins into smaller pieces. Its processing makes it easier and quicker to digest. |
| Hypoallergenic | It refers to a substance that causes fewer allergic reactions. |
| Isolate | It is the purest and most processed form of protein which has undergone separation to obtain a pure protein fraction. It typically contains ≥ 90% of protein by weight. |
| Keratin | It is a protein that helps form hair, nails, and the outer layer of skin. |
| Lactalbumin | It is the albumin contained in milk and obtained from whey. |
| Lactoferrin | It is an iron‑binding glycoprotein that is present in the milk of most mammals. |
| Lupin | It is the yellow legume seeds of the genus Lupinus. |
| Millenial | Also known as Generation Y or Gen Y, it refers to the people born from 1981 to 1996. |
| Monogastric | It refers to an animal with a single-compartmented stomach. Examples of monogastric include humans, poultry, pigs, horses, rabbits, dogs, and cats. Most monogastric are generally unable to digest much cellulose food materials such as grasses. |
| MPC | Milk protein concentrate |
| MPI | Milk protein isolate |
| MSPI | Methylated soy protein isolate |
| Mycoprotein | Mycoprotein is a form of single-cell protein, also known as fungal protein, derived from fungi for human consumption. |
| Nutricosmetics | It is a category of products and ingredients that act as nutritional supplements to care for skin, nails, and hair natural beauty. |
| Osteoporosis | It is a medical condition in which the bones become brittle and fragile from loss of tissue, typically as a result of hormonal changes, or deficiency of calcium or vitamin D. |
| PDCAAS | Protein digestibility-corrected amino acid score (PDCAAS) is a method of evaluating the quality of a protein based on both the amino acid requirements of humans and their ability to digest it. |
| Per-capita consumption of animal protein | It is the average amount of animal protein (such as milk, whey, gelatin, collagen, and egg proteins) that is readily available for consumption by each person in an actual population. |
| Per-capita consumption of plant protein | It is the average amount of plant protein (such as soy, wheat, pea, oat, and hemp proteins) that is readily available for consumption by each person in an actual population. |
| Quorn | It is a microbial protein manufactured using mycoprotein as an ingredient, in which the fungus culture is dried and mixed with egg albumen or potato protein, which acts as a binder, and then is adjusted in texture and pressed into various forms. |
| Ready-to-Cook (RTC) | It refers to food products that include all of the ingredients, where some preparation or cooking is required through a process that is given on the package. |
| Ready-to-Eat (RTE) | It refers to a food product prepared or cooked in advance, with no further cooking or preparation required before being eaten. |
| RTD | Ready-to-Drink |
| RTS | Ready-to-Serve |
| Saturated fat | It is a type of fat in which the fatty acid chains have all single bonds. It is generally considered unhealthy. |
| Sausage | It is a meat product made of finely chopped and seasoned meat, which may be fresh, smoked, or pickled and which is then usually stuffed into a casing. |
| Seitan | It is a plant-based meat substitute made out of wheat gluten. |
| Softgel | It is a gelatin-based capsule with a liquid fill. |
| SPC | Soy protein concentrate |
| SPI | Soy protein isolate |
| Spirulina | It is a biomass of cyanobacteria that can be consumed by humans and animals. |
| Stabilizer | It is an ingredient added to food products to help maintain or enhance their original texture, and physical and chemical characteristics. |
| Supplementation | It is the consumption or provision of concentrated sources of nutrients or other substances that are intended to supplement nutrients in the diet and is intended to correct nutritional deficiencies. |
| Texturant | It is a specific type of food ingredient that is used to control and alter the mouthfeel and texture of food and beverage products. |
| Thickener | It is an ingredient that is used to increase the viscosity of a liquid or dough and make it thicker, without substantially changing its other properties. |
| Trans fat | Also called trans-unsaturated fatty acids or trans fatty acids, it is a type of unsaturated fat that naturally occurs in small amounts in meat. |
| TSP | Textured soy protein |
| TVP | Textured vegetable protein |
| WPC | Whey protein concentrate |
| WPI | Whey protein isolate |
Need More Details on Market Definition?
Ask a Question
Research Methodology
Mordor Intelligence follows a four-step methodology in all our reports.
- Step-1: Identify Key Variables: The quantifiable key variables (industry and extraneous) pertaining to the specific product segment and country are selected from a group of relevant variables & factors based on desk research & literature review; along with primary expert inputs. These variables are further confirmed through regression modeling (wherever required).
- Step-2: Build a Market Model: In order to build a robust forecasting methodology, the variables and factors identified in Step-1 are tested against available historical market numbers. Through an iterative process, the variables required for market forecast are set and the model is built on the basis of these variables.
- Step-3: Validate and Finalize: In this important step, all market numbers, variables and analyst calls are validated through an extensive network of primary research experts from the market studied. The respondents are selected across levels and functions to generate a holistic picture of the market studied.
- Step-4: Research Outputs: Syndicated Reports, Custom Consulting Assignments, Databases & Subscription Platforms

Get More Details On Research Methodology
Download PDF


