Market Overview
| Study Period | 2018 - 2031 |
|---|---|
| Base Year For Estimation | 2025 |
| Forecast Data Period | 2026 - 2031 |
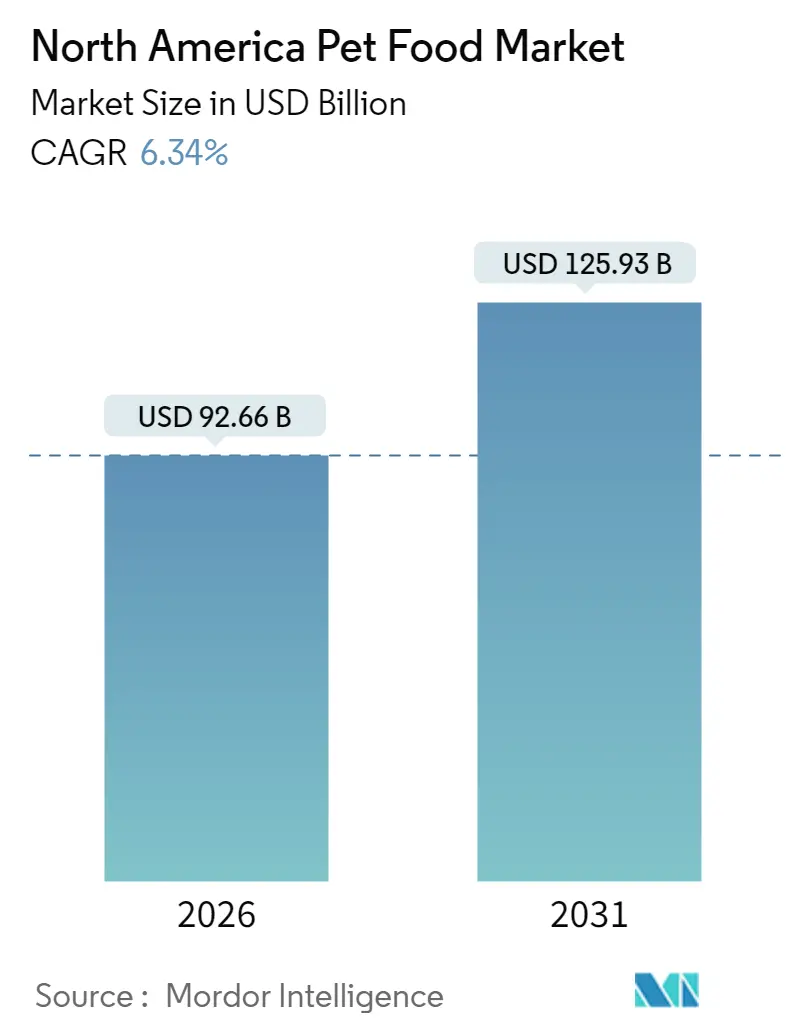
| Market Size (2026) | USD 92.66 Billion |
| Market Size (2031) | USD 125.93 Billion |
| Growth Rate (2026 - 2031) | 6.34% CAGR |
| Market Concentration | Medium |
Major Players *Disclaimer: Major Players sorted in no particular order Image © Mordor Intelligence. Reuse requires attribution under CC BY 4.0. | |
North America Pet Food Market Analysis by Mordor Intelligence
The North America pet food market is expected to grow from USD 87.14 billion in 2025 to USD 92.66 billion in 2026 and is forecast to reach USD 125.93 billion by 2031 at 6.34% CAGR over 2026-2031. The expansion rests on durable pet humanization, the adoption of premium nutrition, and a spending pattern that remains non-discretionary even during economic slowdowns. Premium dry kibble, fresh-frozen meals, and functional treats continue to draw household budgets higher because owners perceive measurable health returns. Digital commerce adds momentum by simplifying access to specialized recipes, while veterinary endorsement validates therapeutic diets for obesity, allergy, and age-related disorders. Regulatory oversight by the U.S. Food and Drug Administration (FDA) maintains a focus on safety and labeling, favoring manufacturers that invest in quality systems and transparent sourcing practices.
Key Report Takeaways
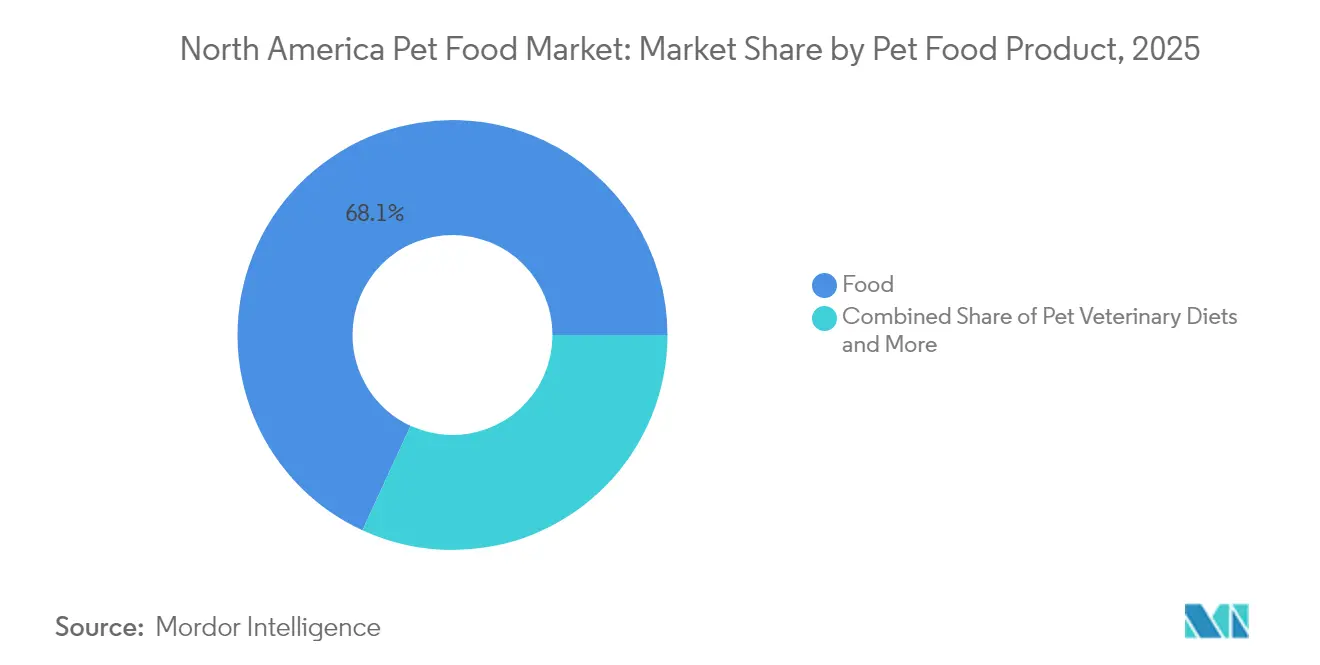
- By product category, food retained 68.12% revenue share in 2025; pet veterinary diets are projected to expand at a 5.78% CAGR through 2031.
- By pets, dogs held 50.02% of the North America pet food market share in 2025; the segment is advancing at an 7.72% CAGR through 2031.
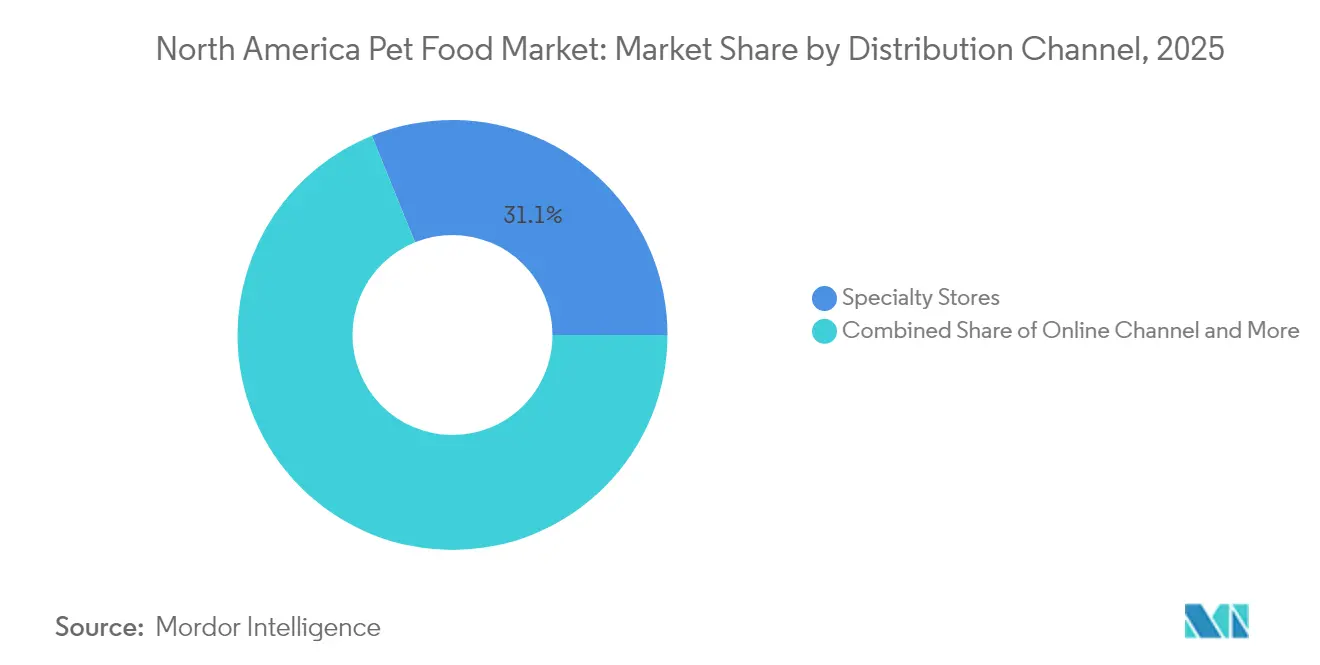
- By distribution channel, specialty stores commanded 31.12% share of the North America pet food market size in 2025; online channels are forecast to grow at an 8.35% CAGR to 2031.
- By Geography, the United States accounted for 88.12% of the North America pet food market size in 2025; the nation is on track for a 6.41% CAGR through 2031.
Note: Market size and forecast figures in this report are generated using Mordor Intelligence’s proprietary estimation framework, updated with the latest available data and insights as of January 2026.
North America Pet Food Market Trends and Insights
Drivers Impact Analysis
| Driver | (~) % Impact on CAGR Forecast | Geographic Relevance | Impact Timeline |
|---|---|---|---|
| Humanization of pets fuels premiumization | +1.2% | US-led, expanding to urban Canada and Mexico | Medium term (2-4 years) |
| Rising e-commerce penetration | +0.9% | Strongest in US, accelerating in Canada | Short term (≤ 2 years) |
| Surge in obesity-related specialty diets | +0.8% | US and Canada leading, Mexico following | Medium term (2-4 years) |
| Direct-to-consumer subscription models | +0.7% | US-dominated, selective Canada expansion | Long term (≥ 4 years) |
| Personalized nutrition via microbiome testing | +0.5% | US innovation centers, premium Canada markets | Long term (≥ 4 years) |
| Upcycled ingredients enter mainstream recipes | +0.4% | US regulatory leadership, Canada following | Medium term (2-4 years) |
| Source: Mordor Intelligence | |||
Humanization of Pets Fuels Premiumization
Owners are increasingly treating animals as family members and willingly paying for organic, grain-free, and limited-ingredient formulations. Mars Petcare recorded a significant growth in premium segments during 2024, underscoring the willingness to switch to more expensive diets when perceived health benefits are clear[1]Source: Mars Incorporated, “Annual Report 2024,” mars.com. In major metropolitan areas, millennials and Generation Z consumers make emotionally driven choices that align their pet eating habits with their personal wellness routines. Premium positioning increases gross margins by 25–40%, providing brands with ample resources for transparently telling their ingredient stories. Companies that combine clinical validation with human-grade sourcing standards enjoy durable pricing power throughout the forecast horizon.
Rising E-Commerce Penetration
Subscription convenience, doorstep delivery, and AI-driven product recommendations deepen customer loyalty and raise lifetime value metrics. Amazon’s private labels and Chewy’s integrated veterinary pharmacy spur competition, forcing brick-and-mortar stores to rethink service models. Rural households benefit from equal access to niche recipes, while urban residents appreciate the convenience of not having to lug heavy bags. The acceleration of digital media and data analytics shifts promotional budgets as first-party insights replace traditional mass advertising.
Surge in Obesity-Related Specialty Diets
Nearly 59% of dogs and 61% of cats were classified as overweight or obese in 2024[2]Source: Association for Pet Obesity Prevention, “2024 Survey Results,” petobesityprevention.org. Veterinary professionals increasingly prescribe calorie-controlled foods, weight-management treats, and metabolic supplements. Hill’s Pet Nutrition and Royal Canin dominate via clinic partnerships that reinforce follow-up purchases. Weight-control formulas carry price premiums of 40–60% over standard kibble, yet show strong compliance because owners associate them with measurable outcomes, such as reduced joint strain and improved mobility. As pet lifespans lengthen, the demand for overlapping therapeutic benefits—such as weight, joint, and digestive support—adds incremental volume to high-margin SKUs.
Direct-to-Consumer Subscription Models
Fresh meal services such as The Farmer’s Dog and Nom Nom charge USD 3–5 per serving, far above traditional kibble, yet recorded triple-digit growth in 2024[3]Source: Mars Incorporated, “Annual Report 2024,” mars.com. Recurring deliveries stabilize revenue and permit granular dietary customization based on life stage, breed, and health condition. Lower churn improves operating leverage as retention surpasses 80% after the third box. Incumbent manufacturers now test in-house subscription pilots, but legacy supply chains require flexible portioning and cold-chain investments that differ from large-batch dry food lines. Success hinges on integrating nutritional science with logistics that safeguard product integrity across the last mile.
Restraints Impact Analysis
| Restraint | (~) % Impact on CAGR Forecast | Geographic Relevance | Impact Timeline |
|---|---|---|---|
| Volatile meat and grain prices | -0.8% | Global impact, affects all North American markets | Short term (≤ 2 years) |
| Tightening FDA labeling regulations | -0.6% | US-led regulatory changes, Canada harmonization | Medium term (2-4 years) |
| Logistics-driven supply disruptions | -0.5% | Cross-border trade between US-Canada-Mexico | Short term (≤ 2 years) |
| Clean-label skepticism on synthetic additives | -0.3% | US and Canada consumer-driven, Mexico emerging | Long term (≥ 4 years) |
| Source: Mordor Intelligence | |||
Volatile Meat and Grain Prices
Chicken meal costs climbed between 2023 and 2024, while corn and wheat swung because of extreme weather and geopolitical shocks. Manufacturers face shrinking gross margins or must pass price increases that curb unit demand, especially for economy SKUs. Reformulation with lentils, peas, or insect protein offers partial relief, but it risks shifting the amino acid balance. Larger firms hedge through multi-year contracts and vertical integration, yet smaller brands lack such defenses. Persistent volatility pushes industry players to diversify protein inputs and explore ingredient futures markets for risk mitigation.
Tightening FDA Labeling Regulations
New FDA guidance demands robust nutrient validation and sourcing transparency, adding USD 50,000–200,000 in compliance costs per recipe. Small and mid-tier brands grapple with resource constraints, nudging the industry toward consolidation. Lead times on packaging updates stretch commercialization cycles and delay innovation launches. Larger firms benefit from in-house regulatory affairs teams that can navigate approvals swiftly, reinforcing market share advantages. Harmonization with Association of American Feed Control Officials (AAFCO) standards improves consumer trust but also heightens entry barriers.
Segment Analysis
By Pet Food Product: Veterinary Diets Drive Premium Expansion
Veterinary diets represented a smaller volume base but charted a 5.78% CAGR to 2031, outpacing all other product groups within the North America pet food market. Hill’s Pet Nutrition leads the therapeutic category through exclusive clinic relationships that reinforce purchase behavior at the point of diagnosis. The broader food segment retained 68.12% share in 2025, with dry kibble remaining a staple for its caloric density and affordability. High-protein freeze-dried bites and air-dried patties enrich premium shelves, while wet formulas offer palatability for finicky eaters. Supplements, particularly omega-3 fatty acids and glucosamine chews, generate incremental revenue streams that align with human preventive health trends.
Veterinary endorsements strengthen brand credibility, allowing for price points of USD 4–6 per pound, compared to USD 1–2 for standard kibble. Owners perceive therapeutic nutrition as an alternative to pharmaceuticals, reducing anxiety over side effects and fostering brand allegiance. As diagnostic technology advances, prescription foods for renal, cardiac, and cognitive conditions will deepen penetration. The North America pet food market size for veterinary diets is forecast to widen its share because rising pet lifespans prolong demand for chronic care offerings.
Note: Segment shares of all individual segments available upon report purchase
Get Detailed Market Forecasts at the Most Granular Levels
Download PDF
By Pets: Dogs Dominate Volume and Growth Trajectories
Dogs accounted for 50.02% of the North America pet food market size in 2025 and are projected to grow at an 7.72% CAGR through 2031. Companion animal surveys revealed an average annual expenditure of USD 287 per household on dog food in 2024, significantly higher than the average allocation for cats. Large breeds require joint-supportive formulas rich in chondroitin and Environmental Protection Agency (EPA), which help promote cartilage proliferation. Activity-specific foods target working, sporting, and service dogs, creating micro-segments within the dominant species. Cats, although mature, remain a popular choice for adoption because apartment living and lower care demands suit urban lifestyles. Wet foods with varied textures sustain brand loyalty due to physiological hydration advantages.
Specialty nutrition for birds, fish, and reptiles remains niche but benefits from the humanization halo that pushes caretakers toward balanced, species-appropriate diets. Educational content from zoos and veterinary schools enhances nutrition awareness, encouraging owners to upgrade from generic mixes. The North America pet food market continues to allocate research funds toward understanding micronutrient needs of emerging species, positioning manufacturers for differentiated offerings in under-served categories.
By Distribution Channel: Digital Disruption Reshapes Retail Landscape
Specialty stores maintained 31.12% share by curating premium assortments and offering in-store nutritional consultations. Their staff expertise garners trust, particularly for therapeutic and raw diets. Online channels are primed for 8.35% CAGR as algorithm-driven recommendations match individual pet profiles with optimized baskets. Autoship discounts and free shipping on threshold orders make e-commerce a cost-effective option for bulk purchases. Supermarkets hold a convenience advantage for mainstream brands but confront margin pressure when competing on price alone.
Hybrid shopping journeys blur lines, with many consumers researching online before completing in-store purchases or vice versa. Same-day pickup programs allow brick-and-mortar chains to retain traffic, while digital players invest in cold-chain infrastructure to safeguard fresh-frozen meals. The North America pet food market share for online sales will keep expanding as broadband penetration and mobile payment adoption deepen across rural and suburban neighborhoods. Manufacturers that craft cohesive omnichannel strategies capture incremental shelf presence without cannibalizing existing relationships.
Note: Segment shares of all individual segments available upon report purchase
Get Detailed Market Forecasts at the Most Granular Levels
Download PDF
Geography Analysis
The United States generated 88.12% of total revenue in 2025 and is forecasted to grow at a 6.41% CAGR through 2031, buoyed by the world’s largest pet population and an advanced veterinary ecosystem. Premium spending persisted despite macroeconomic headwinds as veterinary recommendations and insurance reimbursements anchored nutrition budgets. Fresh-frozen meals, microbiome-guided diets, and subscription re-orders blended to lift average transaction values. E-commerce penetration reached a high in 2024, reflecting robust logistics, widespread credit card usage, and consumer comfort with doorstep delivery.
Canada contributed a modest share yet posted double-digit value growth between 2022 and 2024, driven by urban millennials seeking sustainable and organic labels. Health Canada’s alignment with FDA nutrient requirements eased cross-border product launches, although bilingual labeling and provincial distribution complexities continued to be operational considerations. Specialty retailers in the Greater Toronto and Vancouver areas spotlight raw frozen patties and insect protein snacks, signaling an opportunity for agile brands that address environmental and wellness narratives.
Mexico demonstrated the fastest unit expansion as middle-class households shifted from table scraps to formulated feeds. Urban centers such as Monterrey and Guadalajara saw premium wet pouches and small-portion packs gain traction among apartment dwellers with limited storage. Exchange rate swings present pricing challenges, but local co-manufacturing, under the United States-Mexico-Canada Agreement (USMCA) provisions, offsets freight outlays. The North America pet food market share in Mexico is therefore anticipated to rise incrementally, though infrastructure gaps in cold storage and last-mile delivery temper near-term gains.
Competitive Landscape
The top five companies collectively hold about a good market share, indicating moderate concentration. Mars Incorporated and Nestle Purina leverage multi-brand portfolios, global procurement, and vertically integrated plants to protect shelf space. Capital intensity remains high in wet food retort lines and freeze-drying units, creating a barrier for start-ups that instead favor co-packing arrangements. Yet disruptors such as The Farmer’s Dog and Nom Nom now control a growing direct-to-consumer niche by addressing individualized feeding plans with data-rich platforms.
Strategic investment focuses on pet wellness services, AI-driven recommendation engines, and blockchain traceability. Private-equity interest persists in specialty brands that can achieve national distribution through e-commerce first, then migrate to specialty shelves. The North America pet food industry thus transforms from commodity bulk production to a value ladder anchored in science, sustainability, and personal relevance.
Increasing CapEx in automation and predictive maintenance bolsters cost leadership as labor shortages endure. Mars Petcare’s personalized nutrition tech partnership underscores the shift toward service-bundled food propositions. Brands unable to demonstrate clinically validated benefits or carbon-neutral roadmaps risk marginalization as younger consumers elevate ethical and functional criteria in purchase decisions.
North America Pet Food Industry Leaders
Colgate-Palmolive Company (Hill's Pet Nutrition Inc.)
General Mills Inc.
Mars Incorporated
Nestle (Purina)
The J. M. Smucker Company
- *Disclaimer: Major Players sorted in no particular order
Need More Details on Market Players and Competitors?
Download PDF
Recent Industry Developments
- July 2023: Hill's Pet Nutrition introduced its new MSC (Marine Stewardship Council) certified pollock and insect protein products for pets with sensitive stomachs and skin lines. They contain vitamins, omega-3 fatty acids, and antioxidants.
- June 2023: Mars Incorporated launched its premium cat brand SHEBA in Canada, offering cat parents wet formulas through its SHEBA BISTRO line.
- May 2023: Nestle Purina launched new cat treats under the Friskies "Friskies Playfuls - treats" brand. These treats are round in shape and are available in chicken and liver and salmon and shrimp flavors for adult cats.
North America Pet Food Market Report Scope
Food, Pet Nutraceuticals/Supplements, Pet Treats, Pet Veterinary Diets are covered as segments by Pet Food Product. Cats, Dogs are covered as segments by Pets. Convenience Stores, Online Channel, Specialty Stores, Supermarkets/Hypermarkets are covered as segments by Distribution Channel. Canada, Mexico, United States are covered as segments by Country.Pet Food Product
| Food | By Sub Product | Dry Pet Food | By Sub Dry Pet Food | Kibbles |
| Other Dry Pet Food | ||||
| Wet Pet Food | ||||
| Pet Nutraceuticals/Supplements | By Sub Product | Milk Bioactives | ||
| Omega-3 Fatty Acids | ||||
| Probiotics | ||||
| Proteins and Peptides | ||||
| Vitamins and Minerals | ||||
| Other Nutraceuticals | ||||
| Pet Treats | By Sub Product | Crunchy Treats | ||
| Dental Treats | ||||
| Freeze-dried and Jerky Treats | ||||
| Soft and Chewy Treats | ||||
| Other Treats | ||||
| Pet Veterinary Diets | By Sub Product | Derma Diets | ||
| Diabetes | ||||
| Digestive Sensitivity | ||||
| Obesity Diets | ||||
| Oral Care Diets | ||||
| Renal | ||||
| Urinary tract disease | ||||
| Other Veterinary Diets |
Pets
| Cats |
| Dogs |
| Other Pets |
Distribution Channel
| Convenience Stores |
| Online Channel |
| Specialty Stores |
| Supermarkets/Hypermarkets |
| Other Channels |
Geography
| Canada |
| Mexico |
| United States |
| Rest of North America |
| Pet Food Product | Food | By Sub Product | Dry Pet Food | By Sub Dry Pet Food | Kibbles |
| Other Dry Pet Food | |||||
| Wet Pet Food | |||||
| Pet Nutraceuticals/Supplements | By Sub Product | Milk Bioactives | |||
| Omega-3 Fatty Acids | |||||
| Probiotics | |||||
| Proteins and Peptides | |||||
| Vitamins and Minerals | |||||
| Other Nutraceuticals | |||||
| Pet Treats | By Sub Product | Crunchy Treats | |||
| Dental Treats | |||||
| Freeze-dried and Jerky Treats | |||||
| Soft and Chewy Treats | |||||
| Other Treats | |||||
| Pet Veterinary Diets | By Sub Product | Derma Diets | |||
| Diabetes | |||||
| Digestive Sensitivity | |||||
| Obesity Diets | |||||
| Oral Care Diets | |||||
| Renal | |||||
| Urinary tract disease | |||||
| Other Veterinary Diets | |||||
| Pets | Cats | ||||
| Dogs | |||||
| Other Pets | |||||
| Distribution Channel | Convenience Stores | ||||
| Online Channel | |||||
| Specialty Stores | |||||
| Supermarkets/Hypermarkets | |||||
| Other Channels | |||||
| Geography | Canada | ||||
| Mexico | |||||
| United States | |||||
| Rest of North America | |||||
Need A Different Region or Segment?
Customize Now
Market Definition
- FUNCTIONS - Pet foods are usually intended to provide complete and balanced nutrition to the pet but are primarily used as functional products. The scope includes the food and supplements consumed by pets including veterinary diets. Supplements/nutraceuticals that are directly supplied to pets are considered within the scope.
- RESELLERS - Companies engaged in reselling of pet food without value addition have been excluded from the market scope, in order to avoid double counting.
- END CONSUMERS - Pet owners are considered to be the end-consumers in the market studied.
- DISTRIBUTION CHANNELS - Supermarkets/hypermarkets, specialty stores, convenience stores, online channels and other channels are considered within the scope. The stores which are exclusively providing pet related basic and custom products are considered within the scope of specialty stores.
| Keyword | Definition |
|---|---|
| Pet Food | The scope of pet food includes the food that is eatable by pets including food, treats, veterinary diets, and nutraceuticals/supplements. |
| Food | Food is animal feed intended for consumption by pets. It is formulated to provide essential nutrients and meet the dietary needs of various types of pets, including dogs, cats, and other animals. These are generally segmented into dry and wet pet foods. |
| Dry Pet Food | Dry pet foods may be extruded/baked (kibbles) or flaked. They have a lower moisture content, typically around 12-20%. |
| Wet Pet Food | Wet pet food, also known as canned pet food or moist pet food, generally has a higher moisture content compared to dry pet food, often ranging from 70-80%. |
| Kibbles | Kibbles are dry, processed pet food in small, bite-sized pieces or pellets. They are specifically formulated to provide balanced nutrition for various domestic animals, such as dogs, cats, and other animals. |
| Treats | Pet Treats are special food items or rewards given to pets, to show affection, and encourage good behavior. They are especially used during training. Pet treats are made from various combinations of meat or meat-derived materials with other ingredients. |
| Dental Treats | Pet dental treats are specialized treats that are formulated to promote good oral hygiene in pets. |
| Crunchy Treats | It is a type of pet treat that has a firm and crispy texture which can be a good source of nutrition for pets. |
| Soft and chewy treats | Soft and Chewy pet treats are a type of pet food product that is formulated to be easy to chewy and digest. They are usually made from soft and pliable ingredients, such as meat, poultry, or vegetables, that have been blended and formed into bite-sized pieces or strips. |
| Freeze-dried & Jerky Treats | Freeze-dried and jerky treats are snacks given to pets, that are prepared through a special preservation process, without damaging the nutritional content, resulting in long-lasting, nutrient-rich treats. |
| Urinary Tract Disease Diets | These are commercial diets that are specifically formulated to promote urinary health and reduce the risk of urinary tract infections and other urinary problems. |
| Renal Diets | These are specialized pet foods formulated to support the health of pets with kidney disease or renal insufficiency. |
| Digestive Sensitivity Diets | Digestive-sensitive diets are specially formulated to meet the nutritional needs of pets with digestive issues such as food intolerances, allergies, and sensitivities. These diets are designed to be easily digestible and to reduce the symptoms of digestive problems in pets. |
| Oral Care Diets | Oral care diets for pets are specially formulated diets produced to promote oral health and hygiene in pets. |
| Grain-Free Pet Food | Pet food that does not contain common grains like wheat, corn, or soy. Grain-free diets are often preferred by pet owners seeking alternative options or if their pets have specific dietary sensitivities. |
| Premium Pet Food | High-quality pet food formulated with superior ingredients often offers additional nutritional benefits compared to standard pet food. |
| Natural Pet Food | Pet food made from natural ingredients, with minimal processing and without artificial preservatives. |
| Organic Pet Food | Pet food is produced using organic ingredients, free from synthetic pesticides, hormones, and genetically modified organisms (GMOs). |
| Extrusion | A manufacturing process used to produce dry pet food, where ingredients are cooked, mixed, and shaped under high pressure and temperature. |
| Other Pets | Other pets include birds, fish, rabbits, hamsters, ferrets, and reptiles. |
| Palatability | The taste, texture, and aroma of pet food influence its appeal and acceptance by pets. |
| Complete and Balanced Pet Food | Pet food that provides all essential nutrients in appropriate proportions to meet the nutritional needs of pets without additional supplementation. |
| Preservatives | These are the substances that are added to pet food to extend its shelf life and prevent spoilage. |
| Nutraceuticals | Food products that offer health benefits beyond basic nutrition, often contain bioactive compounds with potential therapeutic effects. |
| Probiotics | Live beneficial bacteria that promote a healthy balance of gut flora, supporting digestive health and immune function in pets. |
| Antioxidants | Compounds that help neutralize harmful free radicals in the body, promoting cellular health and supporting the immune system in pets. |
| Shelf-Life | The duration of which pet food remains safe and nutritionally viable for consumption after its production date. |
| Prescription diet | Specialized pet food formulated to address specific medical conditions under veterinary supervision. |
| Allergen | A substance that can cause allergic reactions in some pets, leading to food allergies or sensitivities. |
| Canned food | Wet pet food that is packed in cans and contains higher moisture content than dry food. |
| Limited ingredient diet (LID) | Pet food formulated with a reduced number of ingredients to minimize potential allergens. |
| Guaranteed Analysis | The minimum or maximum levels of certain nutrients present in pet food. |
| Weight management | Pet food designed to help pets maintain a healthy weight or support weight loss efforts. |
| Other Nutraceuticals | It includes prebiotics, antioxidants, digestive fiber, enzymes, essential oils and herbs. |
| Other Veterinary Diets | It includes weight management diets, skin and coat health, cardiac care, and joint care. |
| Other Treats | It includes rawhides, mineral blocks, lickables, and catnips. |
| Other Dry Foods | It includes cereal flakes, mixers, meal toppers, freeze-dried foods, and air-dried foods. |
| Other Animals | It includes birds, fish, reptiles, and small animals (rabbits, ferrets, hamsters). |
| Other Distribution Channels | It includes veterinary clinics, local unregulated stores, and feed and farm stores. |
| Proteins and Peptides | Proteins are large molecules composed of basic units called amino acids which help in the growth and development of pets. Peptides are the short string of 2 to 50 amino acids. |
| Omega-3 fatty acids | Omega-3 fatty acids are essential polyunsaturated fats that play a crucial role in the overall health and well-being of Pets |
| Vitamins | Vitamins are the essential organic compounds that are essential for vital physiological functioning. |
| Minerals | Minerals are naturally occurring inorganic substances that are essential for various physiological functions in pets. |
| CKD | Chronic Kidney Disease |
| DHA | Docosahexaenoic Acid |
| EPA | Eicosapentaenoic Acid |
| ALA | Alpha-linolenic Acid |
| BHA | Butylated Hydroxyanisol |
| BHT | Butylated Hydroxytoluene |
| FLUTD | Feline Lower Urinary Tract Disease |
Need More Details on Market Definition?
Ask a Question
Research Methodology
Mordor Intelligence follows a four-step methodology in all our reports.
- Step-1: IDENTIFY KEY VARIABLES: In order to build a robust forecasting methodology, the variables and factors identified in Step-1 are tested against available historical market numbers. Through an iterative process, the variables required for market forecast are set and the model is built on the basis of these variables.
- Step-2: Build a Market Model: Market-size estimations for the forecast years are in nominal terms. Inflation is not a part of the pricing, and the average selling price (ASP) is kept constant throughout the forecast period.
- Step-3: Validate and Finalize: In this important step, all market numbers, variables and analyst calls are validated through an extensive network of primary research experts from the market studied. The respondents are selected across levels and functions to generate a holistic picture of the market studied.
- Step-4: Research Outputs: Syndicated Reports, Custom Consulting Assignments, Databases & Subscription Platforms

Get More Details On Research Methodology
Download PDF


