Market Overview
| Study Period | 2017 - 2030 |
|---|---|
| Base Year For Estimation | 2024 |
| Forecast Data Period | 2025 - 2030 |
| Market Size (2025) | USD 492.7 Million |
| Market Size (2030) | USD 608 Million |
| Growth Rate (2025 - 2030) | 4.30% CAGR |
| Market Concentration | Low |
Major Players*Disclaimer: Major Players sorted in no particular order Image © Mordor Intelligence. Reuse requires attribution under CC BY 4.0. | |

North America Pea Protein Ingredients Market Analysis by Mordor Intelligence
The North America Pea Protein Ingredients Market size is estimated at 492.7 million USD in 2025, and is expected to reach 608 million USD by 2030, growing at a CAGR of 4.30% during the forecast period (2025-2030).
The North American pea protein ingredients market is experiencing a significant transformation driven by changing consumer dietary preferences and lifestyle choices. The shift towards plant protein ingredients continues to accelerate, with approximately 39% of Americans expressing interest in transitioning to fully vegan diets while maintaining flexibility in their food choices. This trend is particularly pronounced among younger demographics who are increasingly conscious about their protein sources and environmental impact. The industry has responded to this shift by developing more sophisticated and versatile pea protein applications, especially in the ready-to-consume segment. Manufacturers are focusing on improving the taste, texture, and functionality of pea protein ingredients to meet consumer expectations.
The market is witnessing substantial investments in production capacity and technological advancement. Major industry players are expanding their manufacturing capabilities through strategic facility expansions and innovations. For instance, Ingredion's recent establishment of a new pea-based ingredients facility in Nebraska demonstrates the industry's commitment to meeting growing demand. Similarly, Cargill's Puris has expanded its production capabilities, indicating strong confidence in the market's future growth potential. These investments are not only increasing production capacity but also driving improvements in protein extraction efficiency and product quality.
Health and wellness considerations continue to shape market dynamics, particularly in Mexico where approximately 73% of the population is classified as overweight, driving demand for healthier protein alternatives. This health-conscious trend has led to increased adoption of vegan protein ingredients in various applications, from sports nutrition to everyday dietary supplements. The ingredient's natural, clean-label status and high digestibility make it particularly attractive to consumers seeking healthier alternatives to traditional protein sources. Manufacturers are responding by developing new formulations that maintain nutritional integrity while improving taste and texture profiles.
The food and beverage industry remains the primary growth engine for pea protein ingredients, with manufacturers increasingly incorporating these ingredients into their product formulations. The sector has shown particular innovation in meat substitute ingredients and ready-to-consume products, which collectively account for 57% of the region's pea protein consumption. Product developers are focusing on improving the functionality of pea protein in various applications, from plant-based meat alternatives to dairy-free beverages. This diversification of applications is supported by ongoing research and development efforts to enhance the protein's versatility and performance in different food matrices, leading to broader market penetration and consumer acceptance.
North America Pea Protein Ingredients Market Trends and Insights
Plant protein consumption growth fuels opportunities for key players in the ingredients industry
- From 2017 to 2022, the region saw a 2.42% increase in per capita plant protein consumption, driven by investments and innovations. This surge was primarily fueled by a growing number of consumers shifting toward vegan or vegetarian diets, largely motivated by concerns for animal welfare. Notably, in 2020, approximately 9.6 million more Americans adopted plant-based diets, constituting nearly 3% of the US population. After the COVID-19 pandemic, plant protein consumption surged, partly due to concerns over viral contamination in animal-sourced proteins and a general increase in protein blends, including both animal and plant sources.
- While most Americans are reducing their meat intake, they are not eliminating it, leaning more toward a flexitarian diet than strict veganism or vegetarianism. Plant proteins find significant usage in sports nutrition and as meat alternatives. Soy and whey proteins, in particular, are prevalent in food and beverage, supplements, and sports nutrition. By 2021, 36% of US consumers were familiar with and had consumed soy protein, with a slightly lower share of 31% having tried whey protein.
- Canada boasts the second-largest flexitarian population, showcasing a significant shift toward flexitarianism and veganism among consumers. This trend presents a ripe opportunity for manufacturers to further innovate in the plant protein market. In 2021, the Canadian government pledged over USD 4.3 million to bolster the country's pulse and special crop farmers, aligning with the rising consumer appetite for sustainable, high-quality plant-based proteins.

Understand The Key Trends Shaping This Market
Download PDF
United States and Canada are the major pea producers across North America
- Dry peas serve as the primary raw material for extracting pea protein. Canada stands out as the leading producer of dry peas in North America, closely trailed by the United States. In Canada, provinces such as Saskatchewan, Alberta, and Manitoba lead in dry pea cultivation. North America witnessed a substantial 32% rise in pea production from 2015 to 2020. By 2020, the region's focus had notably shifted toward dry pea production, representing a dominant 95% of the total pea output.
- Forecasts indicate a continued rise in dry pea production, driven by improving yields. Notably, despite a smaller harvested area, Alberta saw heightened yields in 2020. The Canadian government's projections highlight Alberta and Saskatchewan targeting a combined dry pea production of 4.1 million metric tons, with the rest shared among Manitoba, British Columbia, and Eastern Canada. In contrast, the US faced production challenges, primarily due to reduced seeding in North Dakota, leading to both lower yields and increased abandonment. The USDA's estimates for 2020-2021 suggested a 17% drop in US dry pea production, settling just above 0.8 million metric tons.
- Canada's robust dry pea production is enticing manufacturers to set up pea protein processing plants in the country. This strategic move not only leverages Canada's production strength but also helps in curtailing supply chain costs, especially in transportation and storage. A prime example is Roquette, a major North American pea protein producer, which, in November 2021, inaugurated the world's largest pea protein facility in Portage la Prairie, Canada. This cutting-edge plant specializes in processing yellow peas into fibers, proteins, and starch, catering to diverse applications, notably in the pharmaceutical sector.

Understand The Key Trends Shaping This Market
Download PDF
OTHER KEY INDUSTRY TRENDS COVERED IN THE REPORT
- Organic baby food is expected to drive the market in the future
- Fortified beverages are expected to witness a rise in sales during the forecast period
- An increase in the demand for single-serve packets may augment production
- Dairy alternatives are expected to witness a significant growth rate
- Great opportunities for meat alternative products
- Key players are focusing more on healthy ingredients post the COVID-19 pandemic
- Steady demand from the United States to support market growth
- Large commercial players lead the growth of the bakery industry
- Consumer shift toward low-carb diets poses a threat to market growth
- Key players are expected to focus on fortification and nutritional enrichment
- The emphasis on awareness and innovation is one of the major growth drivers of the elderly nutrition market
- E-commerce is expected to emerge as one of the most preferred channels
- Sport/performance nutrition to witness significant growth during the forecast period
- The cosmetic industry to be driven by synergy of innovation and social media influence
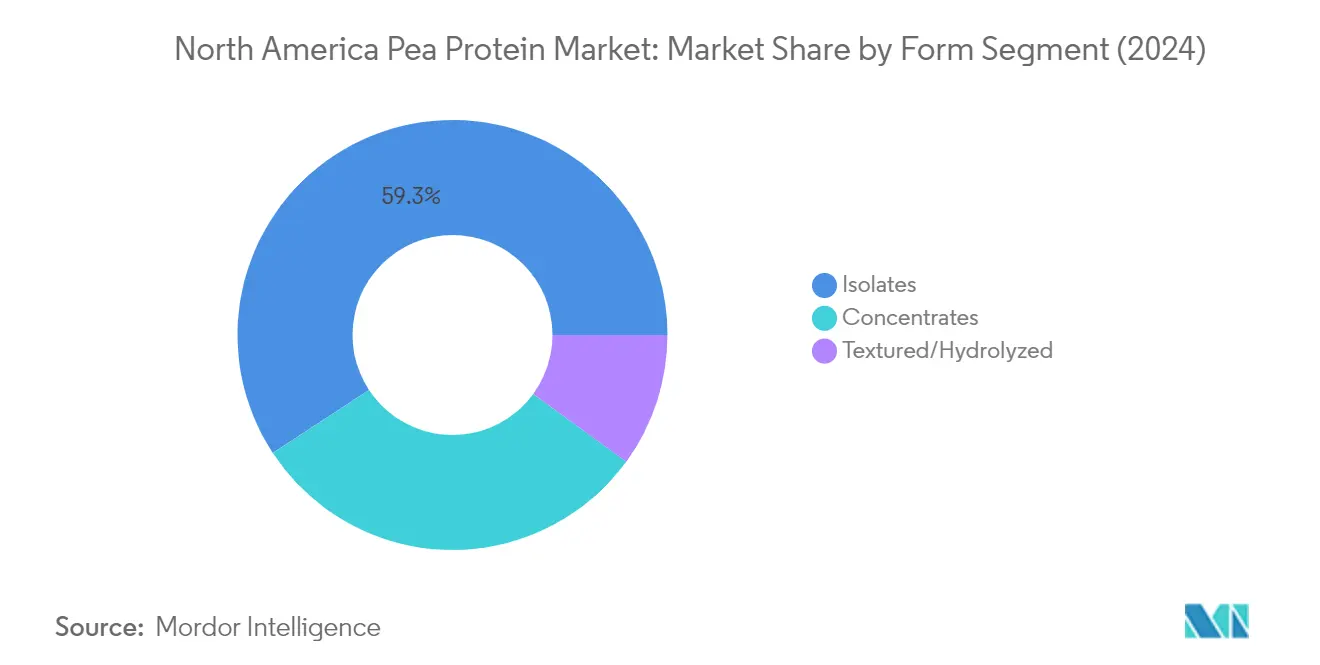
Segment Analysis: Form
Isolates Segment in North America Pea Protein Market
The pea protein isolate segment dominates the North American pea protein market, commanding approximately 59% of the total market share in 2024, primarily due to its superior protein content and premium positioning in the industry. This segment's prominence is particularly evident in the meat alternatives and ready-to-eat/ready-to-cook (RTE/RTC) food products sectors, where pea protein isolates are preferred for their superior gelling capabilities and high protein concentration. The segment is also experiencing the fastest growth trajectory, projected to grow at around 6% during 2024-2029, driven by increasing adoption in sports nutrition and as meat alternatives. Manufacturers favor pea protein isolate for premium formulations due to its higher protein content and lower carbohydrate composition compared to other forms. Their versatility in applications, particularly in beverages and nutritional products, combined with their ability to maintain desired product textures, continues to strengthen their market position.
Remaining Segments in Form Segmentation
The pea protein concentrate and textured pea protein segments play vital complementary roles in the North American pea protein market. Pea protein concentrates offer a cost-effective alternative while preserving peas' natural nutritional profile, making them particularly attractive for manufacturers seeking to balance functionality with economics. The textured pea protein segment, while smaller in market share, serves specific niches such as the animal feed industry and flavor enhancement applications. These forms are particularly valued for their unique properties - concentrates for their robust taste profiles and label-friendly appeal, and hydrolyzed variants for their pre-digested form that benefits consumers with sensitive digestive systems. Both segments continue to find increasing applications across various industries, from pet food to personal care products.
Segment Analysis: End User
Food and Beverages Segment in North America Pea Protein Ingredients Market
The Food and Beverages segment maintains its dominant position in the North American pea protein ingredients market, commanding approximately 46% market share in 2024. This segment's leadership is primarily driven by the surging demand in meat alternatives and ready-to-eat/ready-to-cook (RTE/RTC) food products, which collectively account for about 57% of the region's pea protein consumption. The segment's growth is further propelled by increasing consumer preference for plant-based proteins, particularly among flexitarians and vegans. Major food manufacturers are actively incorporating pea protein into their product formulations, especially in meat alternatives, snacks, and beverages, due to its superior gelling capabilities and clean label appeal. The segment is also witnessing robust growth with a projected CAGR of approximately 8% through 2029, driven by constant product launches and innovations in the meat alternative and snacks industries.
Remaining Segments in End User Market
The remaining segments in the North American pea protein ingredients market include Animal Feed, Personal Care and Cosmetics, and Supplements, each serving distinct market needs. The Animal Feed segment has established itself as a crucial component, particularly in pet food formulations where the demand for plant-based proteins continues to rise. The Personal Care and Cosmetics segment, though smaller, is gaining traction due to the increasing incorporation of pea protein in hair care products, face masks, and other cosmetic applications, driven by its amino acid profile and moisturizing properties. The Supplements segment has emerged as a significant player, particularly in sports nutrition and elderly nutrition, where pea protein's hypoallergenic properties and complete amino acid profile make it an attractive ingredient for formulators.
North America Pea Protein Ingredients Market Geography Segment Analysis
North America Pea Protein Ingredients Market in the United States
The United States dominates the North American pea protein ingredients market, commanding approximately 86% of the total market volume in 2024. The market's robust performance is primarily driven by the meat and meat alternatives sub-segment, reflecting the country's growing appetite for pea protein and plant protein ingredients. The increasing number of flexitarians and health-conscious consumers has prompted major manufacturers to expand their pea protein product portfolios. The country's strong distribution networks and advanced food processing infrastructure have facilitated widespread adoption across various applications. American consumers' growing awareness of sustainable and plant-based alternatives has created a favorable environment for pea protein ingredients, particularly in sports nutrition and functional foods. The presence of leading manufacturers and continuous product innovations has further strengthened the United States' position as the market leader. Additionally, the country's robust research and development capabilities have led to improved protein extraction techniques and enhanced product functionality.
North America Pea Protein Ingredients Market in Mexico
Mexico emerges as the most dynamic market in the region, projected to achieve a remarkable CAGR of approximately 8% during 2024-2029. The country's rapid market expansion is fueled by increasing health consciousness and a growing preference for organic pea protein and other plant-based alternatives among younger consumers. Mexican consumers' rising awareness of sustainable nutrition and environmental concerns has created a strong foundation for market growth. The country's food and beverage industry has been particularly receptive to pea protein ingredients, with manufacturers actively incorporating them into traditional Mexican products. The shift in consumer preferences, particularly among urban populations, has led to increased demand for protein-enriched products. Mexico's strategic location and trade relationships have also facilitated easier access to raw materials and technology transfer. The country's growing fitness industry and increasing focus on preventive healthcare have further accelerated market expansion. Local manufacturers are increasingly partnering with international players to enhance their product offerings and market reach.
North America Pea Protein Ingredients Market in Canada
Canada's pea protein ingredients market benefits significantly from its position as a major producer of yellow peas, the primary raw material for pea protein extraction. The country's strong agricultural foundation and advanced processing capabilities have created a self-sustaining ecosystem for pea protein production. Canadian consumers' increasing preference for plant-based proteins, particularly among the millennial and Gen Z demographics, has driven market growth. The country's strict food safety regulations and quality standards have helped establish trust in pea protein products. Local manufacturers have been investing in research and development to improve protein extraction efficiency and product functionality. The presence of world-class research institutions and government support for plant-based protein initiatives has fostered innovation in the sector. Canada's commitment to sustainable agriculture and environmental protection has aligned well with the growing demand for plant-based proteins.
North America Pea Protein Ingredients Market in Other Countries
The rest of North America, including countries in the Caribbean and Central America, represents an emerging market for pea protein ingredients. These regions are gradually embracing plant-based proteins as part of their dietary evolution. Consumer awareness about health benefits and environmental sustainability is growing, particularly in urban areas. The tourism industry in these regions has also influenced local food service providers to incorporate more plant-based options in their menus. Local food manufacturers are increasingly exploring pea protein as an ingredient in traditional food products to meet changing consumer preferences. The presence of international food companies and growing health consciousness among consumers has created opportunities for market expansion. These regions are also benefiting from knowledge transfer and technological advancements from more developed markets in North America.
Get Analysis on Important Geographic Markets
Download PDF
Competitive Landscape
Top Companies in North America Pea Protein Market
The competitive landscape is characterized by major players like International Flavors & Fragrances, Archer Daniels Midland, Bunge Limited, and Kerry Group leading strategic initiatives across the region. Companies are heavily investing in product innovation, particularly in developing new pea protein variants with enhanced functionality and taste profiles for various applications. Operational agility is demonstrated through the establishment of state-of-the-art manufacturing facilities and R&D centers, enabling quick responses to changing market demands. Strategic partnerships with ingredient suppliers and food manufacturers have become increasingly common to secure raw material supply and expand distribution networks. Market leaders are also focusing on geographical expansion through new facility construction and capacity enhancement projects, particularly in regions with strong pea cultivation.
Consolidated Market Led By Global Players
The North American pea protein ingredients market exhibits a highly consolidated structure dominated by multinational conglomerates with diverse product portfolios spanning multiple ingredient categories. These global players leverage their extensive R&D capabilities, established distribution networks, and strong financial positions to maintain market leadership. Local specialists, while present in the market, primarily operate in niche segments or serve specific regional markets, often collaborating with larger players for technology and market access. The market has witnessed significant consolidation through strategic acquisitions and joint ventures, as larger companies seek to strengthen their plant-based protein portfolios and gain access to innovative technologies.
The competitive dynamics are shaped by vertical integration strategies, with many leading players maintaining control over the entire value chain from sourcing to distribution. Merger and acquisition activities have intensified, particularly focusing on companies with proprietary processing technologies or established presence in high-growth application segments. Companies are increasingly pursuing strategic alliances with agricultural producers and investing in farming communities to ensure sustainable and quality raw material supply, while simultaneously expanding their processing capabilities through both organic growth and acquisitions.
Innovation and Sustainability Drive Future Success
For incumbent players to maintain and expand their market share, focus needs to be placed on continuous innovation in product development and processing technologies. Companies must invest in sustainable sourcing practices and establish strong relationships with pea farmers to ensure consistent supply. The development of application-specific variants and clean-label products will be crucial for maintaining a competitive advantage. Additionally, vertical integration strategies and investment in advanced manufacturing capabilities will help companies optimize costs and maintain quality control throughout the value chain. Building strong partnerships with food and beverage manufacturers and maintaining transparency in operations will be essential for long-term success.
Emerging players can gain ground by focusing on niche markets and developing specialized products for specific applications or consumer segments. Investment in research and development to create unique value propositions and differentiated products will be crucial. Companies must also consider the growing importance of sustainability certifications and clean-label trends while developing their market entry strategies. The regulatory landscape, particularly regarding protein content claims and labeling requirements, will continue to influence market dynamics. Success will depend on building robust quality assurance systems and maintaining compliance with evolving food safety standards while establishing strong relationships with key stakeholders across the value chain. Companies focusing on vegan protein ingredients and plant protein ingredients will find opportunities in the growing demand for sustainable and ethical food sources.
North America Pea Protein Ingredients Industry Leaders
Archer Daniels Midland Company
Bunge Limited
International Flavors & Fragrances, Inc.
Kerry Group PLC
The Scoular Company
- *Disclaimer: Major Players sorted in no particular order

Need More Details on Market Players and Competitors?
Download PDF
Recent Industry Developments
- June 2022: Roquette, a global player in plant-based ingredients and a pioneer in plant proteins, announced the launch of its new NUTRALYS® range of organic textured proteins derived from peas and fava
- April 2021: Ingredion Inc. added two new ingredients to its Plant-based Pea Protein segment. It launched Vitessense Pulse 1853 pea protein isolate and Purity P 1002 pea starch, which are 100% sustainably sourced from North American farms.
- February 2021: DuPont's Nutrition & Biosciences and the ingredient company IFF announced their merger in 2021. The combined company will continue to operate under the name IFF. The complementary portfolios give the company leadership positions within a range of ingredients, including pea protein.
North America Pea Protein Ingredients Market Report Scope
Concentrates, Isolates, Textured/Hydrolyzed are covered as segments by Form. Animal Feed, Food and Beverages, Personal Care and Cosmetics, Supplements are covered as segments by End User. Canada, Mexico, United States are covered as segments by Country.Form
| Concentrates |
| Isolates |
| Textured/Hydrolyzed |
End User
| Animal Feed | ||
| Food and Beverages | By Sub End User | Bakery |
| Beverages | ||
| Breakfast Cereals | ||
| Condiments/Sauces | ||
| Confectionery | ||
| Dairy and Dairy Alternative Products | ||
| Meat/Poultry/Seafood and Meat Alternative Products | ||
| RTE/RTC Food Products | ||
| Snacks | ||
| Personal Care and Cosmetics | ||
| Supplements | By Sub End User | Baby Food and Infant Formula |
| Elderly Nutrition and Medical Nutrition | ||
| Sport/Performance Nutrition | ||
Country
| Canada |
| Mexico |
| United States |
| Rest of North America |
| Form | Concentrates | ||
| Isolates | |||
| Textured/Hydrolyzed | |||
| End User | Animal Feed | ||
| Food and Beverages | By Sub End User | Bakery | |
| Beverages | |||
| Breakfast Cereals | |||
| Condiments/Sauces | |||
| Confectionery | |||
| Dairy and Dairy Alternative Products | |||
| Meat/Poultry/Seafood and Meat Alternative Products | |||
| RTE/RTC Food Products | |||
| Snacks | |||
| Personal Care and Cosmetics | |||
| Supplements | By Sub End User | Baby Food and Infant Formula | |
| Elderly Nutrition and Medical Nutrition | |||
| Sport/Performance Nutrition | |||
| Country | Canada | ||
| Mexico | |||
| United States | |||
| Rest of North America | |||
Need A Different Region or Segment?
Customize Now
Market Definition
- End User - The Protein Ingredients Market operates on a B2B basis. Food, Beverages, Supplements, Animal Feed, and Personal Care & Cosmetic manufacturers are considered to be end-consumers in the market studied. The scope excludes manufacturers buying liquid/dry whey to be used for application as a binding agent or thickener or other non-protein applications.
- Penetration Rate - Penetration Rate is defined as the percentage of Protein-Fortified End User Market Volume in the Overall End User Market Volume.
- Average Protein Content - Average protein content is the average protein content present per 100 g of product manufactured by all end-user companies considered under the scope of this report.
- End User Market Volume - End-user market volume is the consolidated volume of all types and forms of end-user products in the country or region.
| Keyword | Definition |
|---|---|
| Alpha-lactalbumin (α-Lactalbumin) | It is a protein that regulates the production of lactose in the milk of almost all mammalian species. |
| Amino acid | It is an organic compound that contains both amino and carboxylic acid functional groups, which are required for the synthesis of body protein and other important nitrogen-containing compounds, such as creatine, peptide hormones, and some neurotransmitters. |
| Blanching | It is the process of briefly heating vegetables with steam or boiling water. |
| BRC | British Retail Consortium |
| Bread improver | It is a flour-based blend of several components with specific functional properties designed to modify dough characteristics and give quality attributes to bread. |
| BSF | Black Soldier Fly |
| Caseinate | It is a substance produced by adding an alkali to acid casein, a derivative of casein. |
| Celiac disease | Celiac disease is an immune reaction to eating gluten, a protein found in wheat, barley, and rye. |
| Colostrum | It is a milky fluid that’s released by mammals that have recently given birth before breast milk production begins. |
| Concentrate | It is the least processed form of protein and has a protein content ranging from 40-90% by weight. |
| Dry protein basis | It refers to the percentage of "pure protein" present in a supplement after the water in it is completely removed through heat. |
| Dry whey | It is the product resulting from drying fresh whey which has been pasteurized and to which nothing has been added as a preservative. |
| Egg protein | It is a mixture of individual proteins, including ovalbumin, ovomucoid, ovoglobulin, conalbumin, vitellin, and vitellenin. |
| Emulsifier | It is a food additive that facilitates the blending of foods that are immiscible with one another, such as oil and water. |
| Enrichment | It is the process of addition of micronutrients that are lost during the processing of the product. |
| ERS | Economic Research Service of the USDA |
| Extrusion | It is the process of forcing soft mixed ingredients through an opening in a perforated plate or die designed to produce the required shape. The extruded food is then cut to a specific size by blades. |
| Fava | Also known as Faba, it is another word for yellow split beans. |
| FDA | Food and Drug Administration |
| Flaking | It is a process in which typically a cereal grain (like corn, wheat, or rice) is broken down into grits, cooked with flavors and syrups, and then pressed into flakes between cooled rollers. |
| Foaming agent | It is a food ingredient that makes it possible to form or maintain a uniform dispersion of a gaseous phase in a liquid or solid food. |
| Foodservice | It refers to the part of the food industry which includes businesses, institutions, and companies which prepare meals outside the home. It includes restaurants, school and hospital cafeterias, catering operations, and many other formats. |
| Fortification | It is the deliberate addition of micronutrients that are not found in them naturally or which are lost during processing, to improve a food product's nutritional value. |
| FSANZ | Food Standards Australia New Zealand |
| FSIS | Food Safety and Inspection Service |
| FSSAI | Food Safety and Standards Authority of India |
| Gelling agent | It is an ingredient that functions as a stabilizer and thickener to provide thickening without stiffness through the formation of gel. |
| GHG | Greenhouse Gas |
| Gluten | It is a family of proteins found in grains, including wheat, rye, spelt, and barley. |
| Hemp | It is a botanical class of Cannabis sativa cultivars grown specifically for industrial or medicinal use. |
| Hydrolysate | It is a form of protein manufactured by exposing the protein to enzymes that can partially break the bonds between the protein's amino acids and break down large, complicated proteins into smaller pieces. Its processing makes it easier and quicker to digest. |
| Hypoallergenic | It refers to a substance that causes fewer allergic reactions. |
| Isolate | It is the purest and most processed form of protein which has undergone separation to obtain a pure protein fraction. It typically contains ≥ 90% of protein by weight. |
| Keratin | It is a protein that helps form hair, nails, and the outer layer of skin. |
| Lactalbumin | It is the albumin contained in milk and obtained from whey. |
| Lactoferrin | It is an iron‑binding glycoprotein that is present in the milk of most mammals. |
| Lupin | It is the yellow legume seeds of the genus Lupinus. |
| Millenial | Also known as Generation Y or Gen Y, it refers to the people born from 1981 to 1996. |
| Monogastric | It refers to an animal with a single-compartmented stomach. Examples of monogastric include humans, poultry, pigs, horses, rabbits, dogs, and cats. Most monogastric are generally unable to digest much cellulose food materials such as grasses. |
| MPC | Milk protein concentrate |
| MPI | Milk protein isolate |
| MSPI | Methylated soy protein isolate |
| Mycoprotein | Mycoprotein is a form of single-cell protein, also known as fungal protein, derived from fungi for human consumption. |
| Nutricosmetics | It is a category of products and ingredients that act as nutritional supplements to care for skin, nails, and hair natural beauty. |
| Osteoporosis | It is a medical condition in which the bones become brittle and fragile from loss of tissue, typically as a result of hormonal changes, or deficiency of calcium or vitamin D. |
| PDCAAS | Protein digestibility-corrected amino acid score (PDCAAS) is a method of evaluating the quality of a protein based on both the amino acid requirements of humans and their ability to digest it. |
| Per-capita consumption of animal protein | It is the average amount of animal protein (such as milk, whey, gelatin, collagen, and egg proteins) that is readily available for consumption by each person in an actual population. |
| Per-capita consumption of plant protein | It is the average amount of plant protein (such as soy, wheat, pea, oat, and hemp proteins) that is readily available for consumption by each person in an actual population. |
| Quorn | It is a microbial protein manufactured using mycoprotein as an ingredient, in which the fungus culture is dried and mixed with egg albumen or potato protein, which acts as a binder, and then is adjusted in texture and pressed into various forms. |
| Ready-to-Cook (RTC) | It refers to food products that include all of the ingredients, where some preparation or cooking is required through a process that is given on the package. |
| Ready-to-Eat (RTE) | It refers to a food product prepared or cooked in advance, with no further cooking or preparation required before being eaten. |
| RTD | Ready-to-Drink |
| RTS | Ready-to-Serve |
| Saturated fat | It is a type of fat in which the fatty acid chains have all single bonds. It is generally considered unhealthy. |
| Sausage | It is a meat product made of finely chopped and seasoned meat, which may be fresh, smoked, or pickled and which is then usually stuffed into a casing. |
| Seitan | It is a plant-based meat substitute made out of wheat gluten. |
| Softgel | It is a gelatin-based capsule with a liquid fill. |
| SPC | Soy protein concentrate |
| SPI | Soy protein isolate |
| Spirulina | It is a biomass of cyanobacteria that can be consumed by humans and animals. |
| Stabilizer | It is an ingredient added to food products to help maintain or enhance their original texture, and physical and chemical characteristics. |
| Supplementation | It is the consumption or provision of concentrated sources of nutrients or other substances that are intended to supplement nutrients in the diet and is intended to correct nutritional deficiencies. |
| Texturant | It is a specific type of food ingredient that is used to control and alter the mouthfeel and texture of food and beverage products. |
| Thickener | It is an ingredient that is used to increase the viscosity of a liquid or dough and make it thicker, without substantially changing its other properties. |
| Trans fat | Also called trans-unsaturated fatty acids or trans fatty acids, it is a type of unsaturated fat that naturally occurs in small amounts in meat. |
| TSP | Textured soy protein |
| TVP | Textured vegetable protein |
| WPC | Whey protein concentrate |
| WPI | Whey protein isolate |
Need More Details on Market Definition?
Ask a Question
Research Methodology
Mordor Intelligence follows a four-step methodology in all our reports.
- Step-1: Identify Key Variables: The quantifiable key variables (industry and extraneous) pertaining to the specific product segment and country are selected from a group of relevant variables & factors based on desk research & literature review; along with primary expert inputs. These variables are further confirmed through regression modeling (wherever required).
- Step-2: Build a Market Model: In order to build a robust forecasting methodology, the variables and factors identified in Step-1 are tested against available historical market numbers. Through an iterative process, the variables required for market forecast are set and the model is built on the basis of these variables.
- Step-3: Validate and Finalize: In this important step, all market numbers, variables and analyst calls are validated through an extensive network of primary research experts from the market studied. The respondents are selected across levels and functions to generate a holistic picture of the market studied.
- Step-4: Research Outputs: Syndicated Reports, Custom Consulting Assignments, Databases & Subscription Platforms

Get More Details On Research Methodology
Download PDF


