
Market Overview
| Study Period | 2021 - 2031 |
|---|---|
| Forecast Data Period | 2026 - 2031 |
| Historical Data Period | 2021 - 2024 |
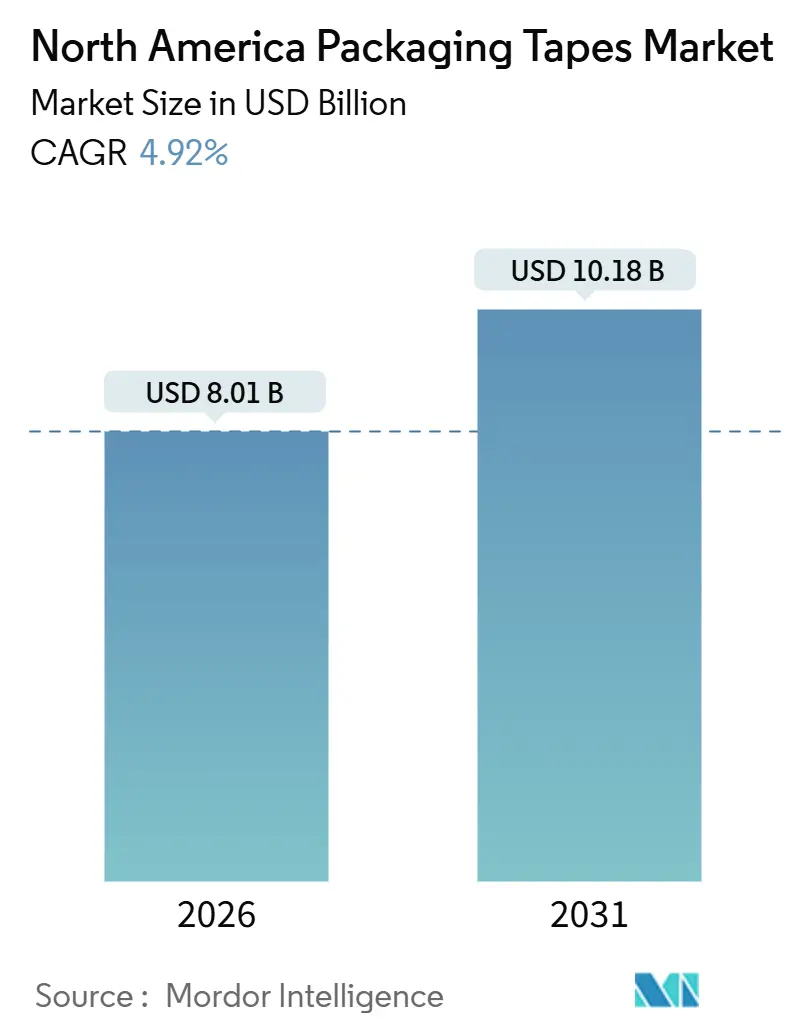
| Market Size (2026) | USD 8.01 Billion |
| Market Size (2031) | USD 10.18 Billion |
| Growth Rate (2026 - 2031) | 4.92 % |
| Market Concentration | Medium |
Major Players *Disclaimer: Major Players sorted in no particular order Image © Mordor Intelligence. Reuse requires attribution under CC BY 4.0. | |
North America Packaging Tapes Market Analysis by Mordor Intelligence
The North America Packaging Tapes Market size is estimated at USD 8.01 billion in 2026, and is expected to reach USD 10.18 billion by 2031, at a CAGR of 4.92% during the forecast period (2026-2031). Sustained e-commerce fulfillment automation, the relocation of light assembly under USMCA, and retailer sustainability mandates collectively underpin this steady trajectory. Plastic-based products still dominate the packaging tapes market because they offer tensile strength that withstands harsh logistics environments, yet kraft and other paper variants are winning contracts where repulpability and food-grade compliance drive purchasing decisions. Hot-melt and acrylic chemistries thrive in automated case-sealing lines because they develop handling strength in under one second, mitigating costly work-in-process queues. At the same time, water-based acrylics and water-activated tapes are capturing premium applications that demand low-VOC formulations or overt tamper evidence. Competitive intensity is edging higher: multinationals protect share through vertical integration, while regional converters target short-run, custom-printed orders that large plants struggle to service.
Key Report Takeaways
- By material type, plastic held 77.11% revenue in 2025, whereas paper is projected to advance at a 5.61% CAGR through 2031
- By adhesive type, acrylic led with 47.40% of the packaging tapes market share in 2025; the Others category is set to grow at a 5.07% CAGR through 2031.
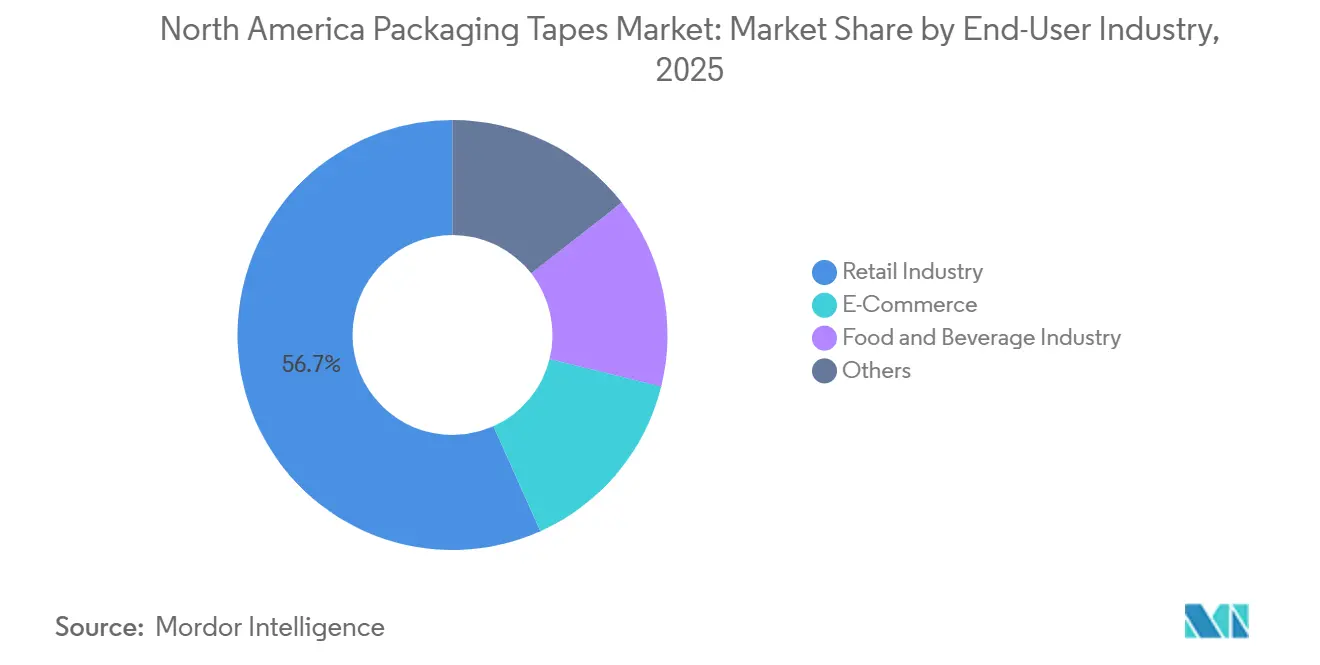
- By end-user industry, retail commanded 56.72% share of the packaging tapes market size in 2025, while e-commerce is forecast to expand at a 7.15% CAGR through 2031.
- By geography, the United States accounted for an 82.85% share of the packaging tapes market size in 2025 and is poised for a 5.11% CAGR to 2031.
Note: Market size and forecast figures in this report are generated using Mordor Intelligence’s proprietary estimation framework, updated with the latest available data and insights as of January 2026.
Market Trends and Insights
Drivers Impact Analysis of North America Packaging Tapes Market*
| Drivers | (~) % Impact on CAGR Forecast | Geographic Relevance | Impact Timeline |
|---|---|---|---|
| Resilient e-commerce and omni-channel logistics demand | +1.8% | United States (primary), Canada (secondary), Mexico (emerging cross-border) | Medium term (2-4 years) |
| Food-grade compliance accelerating paper and WAT adoption | +1.2% | United States and Canada (FDA, CFIA enforcement zones) | Long term (≥ 4 years) |
| Automation-ready hot-melt PSA lines at NA fulfillment hubs | +1.0% | United States (Midwest, Southeast fulfillment corridors) | Short term (≤ 2 years) |
| Near-shoring boosts tape demand in cross-border trade zones | +0.7% | Mexico (border states), United States (Texas, Arizona logistics hubs) | Medium term (2-4 years) |
| Digitally-printed, brand-protection tapes gain traction | +0.5% | United States and Canada (high-value goods, pharmaceuticals, electronics) | Long term (≥ 4 years) |
| Source: Mordor Intelligence | |||
Resilient E-Commerce And Omni-Channel Logistics Demand
Automation is ratcheting up tape consumption per carton sealed. Amazon’s 2024 warehouse expansion added additional capacity equipped with case sealers that process boxes at a steady rate, each requiring hot-melt tapes that deliver instant grab. Fulfillment providers consolidate inventory into fewer, larger hubs, raising average throughput and ensuring the packaging tapes market continues to expand even if e-commerce penetration levels off. Robotics eliminates manual dwell time, favoring adhesives that bond in under one second, while level-wound rolls support uninterrupted runs on high-speed equipment. Because downtime costs can be high, operators willingly pay premiums for splice-free, automation-grade tapes that guarantee process reliability.
Food-Grade Compliance Accelerating Paper And WAT Adoption
In response to FDA 21 CFR 175.105 and Canada's CFIA regulations, there's a heightened demand for proof that adhesives won't leach into food. This push has nudged buyers towards opting for water-based acrylics or water-activated chemistries on kraft backings. Despite these tapes commanding a price premium, food and beverage brands are willing to absorb the extra cost to safeguard their export certifications. Henkel's AQUENCE PS range, boasting food contact certification, is now penetrating beverage and chilled-food sectors, where a low-temperature tack is essential. With PFAS restrictions tightening, 3M is set to completely withdraw from that chemical class by the close of 2025, necessitating a reformulation of its legacy products. Retailers, aligning supplier scorecards with ESG metrics, view paper tapes as an efficient solution to reduce plastic usage and sidestep EPR fees, positioning them as pivotal players in reshaping the packaging tapes landscape.
Automation-Ready Hot-Melt PSA Lines At NA Fulfillment Hubs
Graco's tankless melters, by cutting energy use, have enabled line speeds previously unattainable with just plastic tapes[1]. ExxonMobil's newly launched ENBA copolymer in 2024 further reduces set times, ensuring strong bonds on recycled corrugated surfaces with lower energy. Capital investments per line carry a payback for facilities processing more than 5,000 cartons per shift, solidifying adoption. Once installed, automated lines lock in adhesive specifications, giving tape suppliers long contracts—an advantage that keeps growth in the packaging tapes market resilient even during macro slowdowns.
Near-Shoring Boosts Tape Demand In Cross-Border Trade Zones
In 2023, Mexico overtook China to become the largest goods trading partner of the United States. This shift spurred growth in Mexican packaging demand and bolstered northbound shipments, particularly those dependent on high-tensile BOPP tapes[2]. International Paper operates corrugating plants close to Laredo and El Paso, enabling them to deliver cartons and tape to automotive and electronics assemblers on both sides of the border by the next day. Given the temperature fluctuations—from the intense desert heat to the chill of refrigerated railcars—products need to be rated for a range of -20°F to 180°F. This requirement has led to Shurtape’s HP-232 securing contracts specifically for cold-chain lanes. As a result, near-shoring has solidified multi-year volume commitments, providing a buffer for the packaging tapes market against spending slowdowns seen in other sectors.
Restraints Impact Analysis of North America Packaging Tapes Market*
| Restraints | (~) % Impact on CAGR Forecast | Geographic Relevance | Impact Timeline |
|---|---|---|---|
| Volatile propylene and rubber feedstock prices | -0.9% | United States and Canada (Gulf Coast and Alberta petrochemical clusters) | Short term (≤ 2 years) |
| Rising state plastic-waste EPR fees on BOPP/PVC tapes | -0.6% | California, Colorado, Maine, Oregon (state-level enforcement) | Medium term (2-4 years) |
| Capital cost of converting legacy lines to water-based systems | -0.4% | United States and Canada (converter facilities requiring retrofit) | Long term (≥ 4 years) |
| Source: Mordor Intelligence | |||
Volatile Propylene And Rubber Feedstock Prices
In 2024, spot propylene prices fluctuated across Gulf Coast hubs. This volatility led to a reduction of BOPP margins within a single quarter. Similarly, rubber raw materials experienced price swings, largely attributed to weather disruptions in Southeast Asia. While larger manufacturers can hedge against these fluctuations using multi-year contracts, regional converters often lack this advantage. As a result, they are compelled to pass on the volatility to buyers, albeit with a delay. This delay strains their relationships with high-volume retailers, who typically budget for annual tape costs months in advance. Consequently, even as the packaging tapes market sees a rise in volume, spikes in feedstock prices dampen profit expectations.
Rising State Plastic-Waste EPR Fees On BOPP/PVC Tapes
California's SB 54, set to introduce producer fees in 2027, aims for a reduction in plastic waste by 2032. This legislation has already led to an uptick in costs for non-recyclable tapes. Meanwhile, similar laws in Colorado, Maine, and Oregon have created a compliance maze. Distributors now find themselves needing to stock state-specific SKUs, which can inflate their working capital annually for each state. Companies like Tesa have been proactive, launching recycled-PET tapes that pass curbside-recycling tests. However, these tapes come with a price premium, making them less appealing in low-margin markets. As a result, EPR tariffs are hindering the transition to alternative plastic grades in the packaging tapes market, particularly for commodity uses.
*Our forecasts treat driver/restraint impacts as directional, not additive. The impact forecasts reflect baseline growth, mix effects, and variable interactions.
North America Packaging Tapes Market Segment Analysis
By Material Type:
Paper Adoption Outpaces Plastics In Sustainability-Focused AccountsPaper tapes are forecast to rise 5.61% CAGR through 2031, eclipsing overall packaging tapes market growth as brands target substrates that move seamlessly through recycling mills. Plastic grades retained 77.11% of 2025 revenue because BOPP resists humidity and maintains tensile strength in export shipments, yet national retailers have committed to eliminating unrecyclable components by 2030. These pledges allow paper variants to cannibalize low-risk SKUs, especially in e-commerce channels where tape visibility also supports branding.
Kraft backings paired with water-activated adhesives seal fiber-based cartons without contaminating paper streams, making them a preferred option in states that impose EPR fees. Reinforced paper tape closes historical strength gaps, enabling paper to secure medium-duty loads previously reserved for plastic. Conversely, frozen food and cross-continent routes still demand plastic grades that withstand extreme temperatures. Adhesive formulators respond by tailoring tack to recycled corrugate, ensuring both substrates retain their share in their respective niches as the packaging tapes market diversifies.

By Adhesive Type:
Acrylics Dominate While Water-Based Platforms AccelerateAcrylic chemistries controlled 47.40% of 2025 revenue because they endure wide temperature swings and satisfy FDA food-contact rules. Hot-melt grades remain the workhorses of automated lines, yet water-based and silicone formulations headline the fastest-growing Others category, set to expand 5.07% CAGR.
Driven by automation incentives, suppliers are racing to reduce set times. For instance, ExxonMobil's ENBA copolymer achieves a significant reduction in cure windows, enabling tapes to bond with recycled boxes swiftly. Water-based acrylics are securing contracts, especially when low-VOC operations or curbside recyclability are prioritized in RFPs. Although rubber matrices are losing ground in FDA or CFIA-regulated applications due to migration concerns, they remain a cost-effective choice for light-duty carton sealing. The delicate balance of speed, temperature adaptability, and regulatory adherence is reshaping adhesive choices, creating diverse opportunities within the packaging tapes market.
By End-User Industry:
E-Commerce Is Small But Fast, Retail Remains CoreRetail distribution centers consumed 56.72% of 2025 demand thanks to high-volume carton sealing, yet e-commerce posts the briskest expansion, tracking a 7.15% CAGR to 2031. Every new automation-ready fulfillment hub leverages hot-melt tapes optimized for robotic application, lifting value per carton even before overall parcel counts climb.
Food and beverage processors are opting for water-based acrylics and water-activated paper. These choices ensure compliance with food-contact standards and cold-chain requirements, particularly in scenarios where condensation poses a risk of adhesive failure. In the 'Others' category, pharmaceuticals and electronics are investing more per carton. This is largely due to the premium pricing of tamper-evident and digitally printed security tapes. Such premium segments introduce lucrative avenues, bolstering supplier margins. This is especially notable as more commoditized applications face sporadic price pressures. As a result, the packaging tapes market is diversifying its growth avenues, rather than relying on a singular vertical.

Geography Analysis
United States Packaging Tapes Market
The United States anchors 82.85% of regional revenue and will expand at a 5.11% CAGR through 2031 as Midwest and Southeast fulfillment hubs ramp robotic case sealing lines. In California, the push from the state's EPR law is hastening a shift towards paper and recycled-PET tapes. This shift has birthed a dual-tier market, where sustainable offerings command impressive premiums. The scale advantages in the industry are starkly highlighted by a facility that churns out a staggering amount of tape each year. This output allows for a just-in-time replenishment capability, a feat that regional converters find hard to replicate. Furthermore, the enforcement of FDA 21 CFR 175.105 has raised the compliance stakes, steering orders towards suppliers who can provide documented migration testing.
Canada Packaging Tapes Market
In Canada, despite its smaller size, there's a pronounced per-capita usage of cold-temperature tape. This is largely attributed to the country's prolonged winters, which push logistics networks to operate below 0°F. The CFIA standards in Canada closely align with U.S. regulations, subtly guiding buyers towards water-based or paper solutions that mitigate migration risks. Local facilities are strategically positioned, slashing lead times for cold-chain clients and supplying acrylics that maintain their tackiness even in sub-zero temperatures.
Mexico Packaging Tapes Market
Mexico is reaping the benefits of near-shoring under the USMCA agreement, capturing an increasing share of the automotive and electronics assembly sectors. These sectors have a growing demand for high-tensile BOPP grades. Border-adjacent corrugators are adeptly meeting same-day demands. Meanwhile, versatile dual-temperature portfolios are adept at managing both the sweltering desert heat and the needs of refrigerated railcars. This interconnectedness is further underscored by the movement of U.S.-made adhesives heading south and finished cartons making their way north, solidifying an integrated supply chain that bolsters the overarching packaging tapes market.
Regulatory Landscape
Packaging tapes sold into North America must align with food-contact and transportation requirements that influence backing and adhesive choices. FDA 21 CFR 175.105 in the United States and CFIA-aligned expectations in Canada place emphasis on documented migration testing, which supports adoption of water-based acrylics and water-activated systems in food and beverage packaging. For certain logistics and load securement applications, ASTM performance standards such as ASTM D1974/D1974M are referenced, while the United States Pipeline and Hazardous Materials Safety Administration (PHMSA) maintains enforcement discretion guidance tied to packaging and transport rules under 49 CFR Parts 171-180.
Sustainability and trade policy are also shaping specifications and pricing. State-level extended producer responsibility (EPR) programs and plastic-waste fees, highlighted by California SB 54 (with producer fee implementation scheduled for 2027), increase the compliance cost of non-recyclable tape components and raise demand for paper and recycled-content alternatives. Cross-border flows under the USMCA/CUSMA framework, including technical barriers and standardization provisions, support harmonized trade but keep converters focused on documentation, labeling, and material declarations as retailer scorecards and public disclosures (for example, climate-risk reporting referenced by Shurtape) show up more often in procurement.
Value Chain Analysis
The value chain begins with upstream feedstocks (polypropylene for BOPP films, paper for kraft backings, and acrylic or hot-melt adhesive inputs), followed by film extrusion or paper converting, adhesive formulation and coating/lamination, slitting and roll finishing, and then distribution through industrial channels and packaging integrators. Integrated producers that control adhesive mass and converting can offer tighter lot consistency and qualify tapes for automated case-sealing lines, while regional converters differentiate through custom printing, shorter runs, and fast turnaround.
Downstream demand is concentrated in retail distribution centers, e-commerce fulfillment hubs, and food and beverage plants that qualify tapes via line trials on case sealers and through compliance documentation covering food-contact and low-VOC requirements. Industry coordination and technical validation are supported by bodies such as the Pressure Sensitive Tape Council (PSTC), which convenes suppliers and end users around test methods and performance expectations. Trade and landed-cost management also affects cross-border supply and imported inputs, since Importers of Record (IOR) hold rights in tariff and duty recovery processes, influencing how co-packers and tape suppliers structure pricing and cost pass-through in contracts.
Competitive Landscape
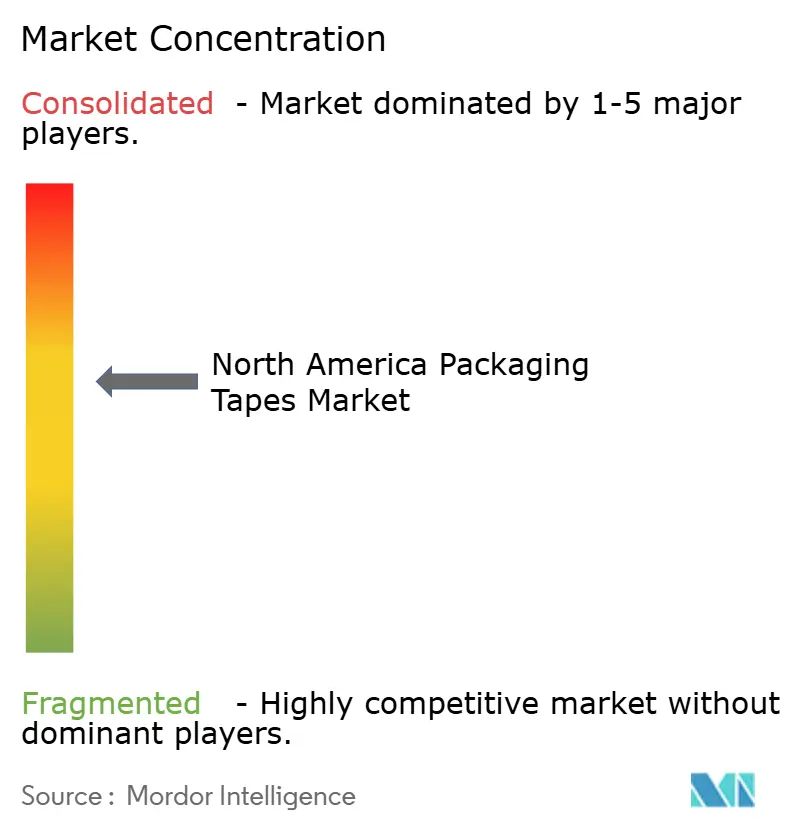
The North American packaging tapes market is moderately consolidated. Integrated production of both adhesive mass and finished tape lets these incumbents guarantee lot-to-lot consistency demanded by automated lines. 3M’s RoboTape platform marries equipment and consumables, locking customers into multiyear tape contracts that carry above-market margins. Regional converters compete on custom printing, rapid turnaround, and flexible minimums. Digital inkjet has slashed setup costs, allowing security graphics and QR codes on runs as small as 500 cartons. This capability attracts mid-tier brands keen to elevate parcel presentation without absorbing plate fees. As a result, the packaging tapes market supports both mass-scale commodity volumes and profitable micro-niches. The need to reformulate ahead of PFAS prohibitions places small entrants at a disadvantage, because regulatory compliance requires a dedicated technical staff and multi-million-dollar pilot lines.
North America Packaging Tapes Industry Leaders
-
3M
-
Intertape Polymer Group Inc.
-
Shurtape Technologies LLC
-
Avery Dennison Corporation
-
Amcor plc
- *Disclaimer: Major Players sorted in no particular order
North America Packaging Tapes Market Companies Covered in this Report
- 3M
- Amcor plc
- Avery Dennison Corporation
- CCT Tapes
- Henkel AG & Co. KGaA
- Intertape Polymer Group Inc.
- LINTEC Corporation
- Mactac LLC
- Nitto Denko Corporation
- Scapa
- Shurtape Technologies LLC
- Tesa SE
Market Opportunities and Future Outlook
An important whitespace is emerging at the intersection of sustainability compliance and automation performance. Converters that can deliver paper, water-activated tape (WAT), and recycled-content plastic tapes with validated performance on high-speed case sealers can access retailer and 3PL programs that are tightening packaging scorecards. Canada adds a compliance-driven lever through plastic tracking and reporting initiatives, including the Federal Plastics Registry, which pushes brands and distributors toward stronger material accounting and can raise demand for SKUs with clearer recycled-content documentation and traceability.
Service-enabled selling is also creating a second opportunity lane, as fulfillment and DC operators prioritize uptime and total cost per sealed carton. Intertape Polymer Group (IPG) launched its Packaging Diagnostics program in February 2026, signaling a shift toward integrated toolsets that connect tape selection to equipment performance and monitoring. This approach can resonate in high-throughput accounts where adhesive set time and splice-free running are central. Separately, trade-policy actions such as the USTR Section 301 tariff activity in 2026, along with the operational complexity of tariff recovery (often tied to IOR status), create room for suppliers with strong compliance, documentation, and regional manufacturing footprints to simplify procurement for multi-site shippers across the United States, Canada, and Mexico.
Recent Industry Developments in North America Packaging Tapes Market
- April 2026: Cantech/Intertape Polymer Group (IPG) announced a strategic expansion of the Tuck Tape brand into the Canadian consumer retail market, including a new line of high-performance carton sealing tapes (Utility Packing Tape, Advance Packaging Tape, and Premium Shipping Tape). The expansion broadens IPG's geographic footprint and accelerates market penetration in consumer channels. It also increases demand drivers tied to e-commerce and retail packaging.
- February 2026: Intertape Polymer Group (IPG) launched Packaging Diagnostics program, integrating iTrack, AF2K, and Gear Up tools to improve packaging line efficiency and equipment uptime. The data-driven diagnostics offering expands IPG's service portfolio beyond product sales. It aims to boost customer stickiness through integrated solutions and performance analytics.
- March 2025: Vibac Group opened a Tennessee operation to shorten lead times and raise United States service levels. The footprint expansion improves NA supply reliability and service capabilities. It strengthens competitive positioning in the North American market.
North America Packaging Tapes Market Report Scope and Research Methodology
Market Definition and Coverage
This market covers packaging tapes sold and used across North America for sealing, bundling, and protecting packages in logistics and shipping, measured in revenue at the point of sale to end users or channels.
Scope exclusions: We exclude non-packaging adhesive tapes used mainly for masking, electrical insulation, medical, or construction purposes.
Segments Covered in This Report
- By Material Type
- Plastic
- Paper
- By Adhesive Type
- Acrylic
- Hot-Melt
- Rubber-Based
- Others
- By End-User Industry
- E-Commerce
- Food and Beverage Industry
- Retail Industry
- Others
- Geography
- United States
- Canada
- Mexico
Data Sources, Market Sizing, and Validation
Desk Research
Desk work starts with building a clean demand picture for packaging activity and shipment intensity across the United States, Canada, and Mexico, then matching it with how tapes are produced and traded in the region. To keep assumptions grounded, we refer to public sources such as US Census Bureau manufacturing and trade series, Statistics Canada manufacturing shipments tables, Mexico INEGI industrial statistics, and US International Trade Commission tariff and import data for relevant HS codes.
We also review technical and standards context that can affect mix and pricing, using sources such as ASTM standards references, publications hosted by packaging associations, and peer reviewed papers on pressure sensitive adhesives and paper versus plastic substrates. On the company side, filings, annual reports, investor presentations, and reputable news coverage help validate capacity additions, linkages to raw materials (film, paper, adhesives), and channel movements. Where needed, we also use paid subscriptions for company financials and for shipment level import and export checks. The sources named here are illustrative, and many other public and paid references were used for collection, cross-checks, and clarification.
Primary Interviews and Surveys
We conduct interviews and surveys with tape producers, converters, distributors, packaging buyers, and plant or procurement managers across North America. Their feedback tests shipment and box-demand signals, fills gaps on product mix, ASP movement, channel inventories, and recycled-content demand, and helps us reconcile conflicting assumptions. Re-contact is used when an answer materially changes the working view.
Distribution of primary research fieldwork respondents
| Company type | Respondent position |
|---|---|
| Top tier: 30% | CXOs: 15% |
| Mid tier: 45% | Functional/Unit leaders: 30% |
| Smaller Players: 25% | Managers: 55% |
Market-Sizing & Forecasting
Sizing begins from a top-down rebuild of the packaging activity pool in North America, where shipment intensity and industrial output are translated into tape demand and then converted into value through realistic price bands. The model is then corroborated with selective bottom-up approximations, such as sampled volume by major application, distributor channel checks, and ASP times volume sanity tests for key tape formats, so totals can be adjusted when the two views disagree.
Key inputs we track include corrugated box shipments and broader packaging throughput, parcel and freight activity that drives case sealing, import and export movement for tape related codes, raw material trend signals for film, paper, and adhesive components, and observed shifts toward water based and paper options for sustainability programs. For forecasting, scenario analysis is applied around e-commerce growth, automation in case sealing lines, and relative pricing between plastic and paper backed tapes, and then it is reconciled with expert consensus from interviews so the outlook stays realistic. When bottom-up signals are incomplete for smaller channels, we fill gaps using ratio based allocation from verified distributor mixes and country level demand indicators, followed by a final consistency check across the three countries.
Data Validation & Update Cycle
Validation is done through triangulation across independent signals, where market totals are checked against trade movement, packaging output, and pricing ranges gathered from the field. If any country or tape type shows an unusual jump, the inputs are rechecked and, when needed, interviews are revisited to confirm whether the change is real or caused by timing, currency, or one off stocking.
Before sign-off, the model goes through multiple analyst reviews that compare the current run against prior versions and against external indicators, and then exceptions are documented and resolved. Reports are refreshed annually, with interim updates when material events occur, such as sharp resin price changes, capacity shifts, or major policy moves impacting trade. Right before delivery, a final analyst pass is completed so clients receive the latest updated view.
Mordor Intelligence's North America Packaging Tapes Market Sizing Compared With Other Published Estimates
Published market sizes for North America packaging tapes can look different because people draw the market boundary differently and they also vary on base year timing, currency handling, and how they treat price changes. Some estimates start from production or trade values, while others start from packaging demand, and the two paths do not always land on the same total without careful checks.
Masking and electrical tapes are sometimes grouped into broader adhesive tape totals, and that can inflate figures that are presented as packaging tape values, even when the end use is not shipping or case sealing. Those gaps get wider when paper tape conversion is projected using aggressive substitution assumptions, or when average selling prices are moved forward using a single inflation factor rather than chemistry and backing specific pricing. Industrial shipment indicators and trade-code cross checks are the practical guardrails, and a packaging-only inclusion rule (for example, excluding masking tape) is applied inside Mordor Intelligence's scope.
Benchmark comparison
| Source | Market Size | Gaps in Research Methodology |
|---|---|---|
| Mordor Intelligence | USD 8.01 B (2026) | |
| Industry Association A | USD 7.40 B (2026) | Typically counts mainly carton sealing tape sold into distribution, and it may undercount specialty packaging uses like bundling and protective unitizing, especially when sold through mixed industrial channels. |
| Global Consultancy B | USD 9.30 B (2026) | Often uses a wider adhesive tape basket that can include adjacent non-packaging categories and may apply a broad ASP uplift, which can overstate value when packaging tape mix is shifting toward lower cost grades in high-volume fulfillment. |
Looking at the spread, the lower estimate is mainly explained by a narrower channel and application coverage, while the higher estimate aligns with a broader category definition that can pull in adjacent tape demand. By keeping the demand pool tied to packaging activities and then checking it against trade and pricing signals, the result stays traceable to clear inputs that can be reviewed and repeated over time.
Key Questions Answered in the Report
What is the value of the North American packaging tapes market?
The packaging tapes market size is USD 8.01 billion in 2026, reaching USD 10.18 billion by 2031, registering a 4.92% CAGR.
How fast is the U.S. segment expected to grow?
The United States is forecast to expand at a 5.11% CAGR between 2026 and 2031.
Which material type is gaining traction due to sustainability mandates?
Paper tapes are growing at a 5.61% CAGR because they align with repulpability and EPR objectives.
Why are acrylic adhesives so widely adopted?
They offer broad temperature tolerance and FDA food-contact compliance while suiting high-speed automation.
What factor most influences tape demand in cross-border trade?
Near-shoring under USMCA boosts high-tensile BOPP tape volumes for automotive and electronics exports.