
Market Overview
| Study Period | 2020 - 2031 |
|---|---|
| Forecast Data Period | 2026 - 2031 |
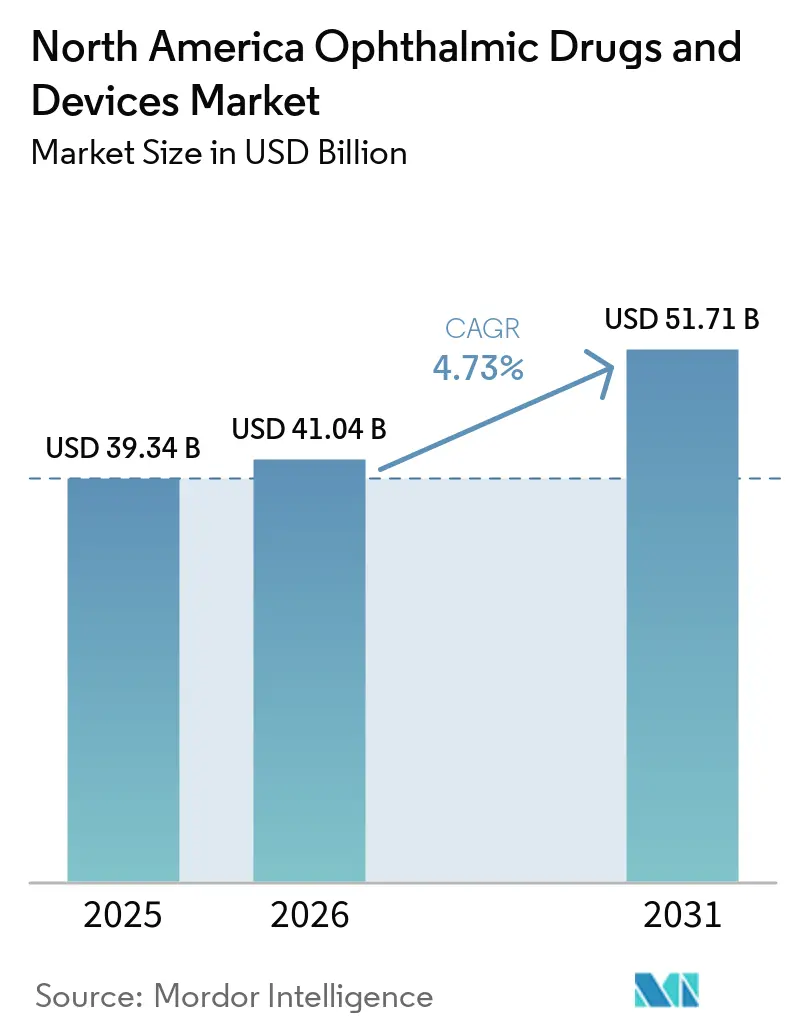
| Base Year Market Size (2025) | USD 39.34 Billion |
| Market Size (2026) | USD 41.04 Billion |
| Market Size (2031) | USD 51.71 Billion |
| Growth Rate (2026 - 2031) | 4.73 % |
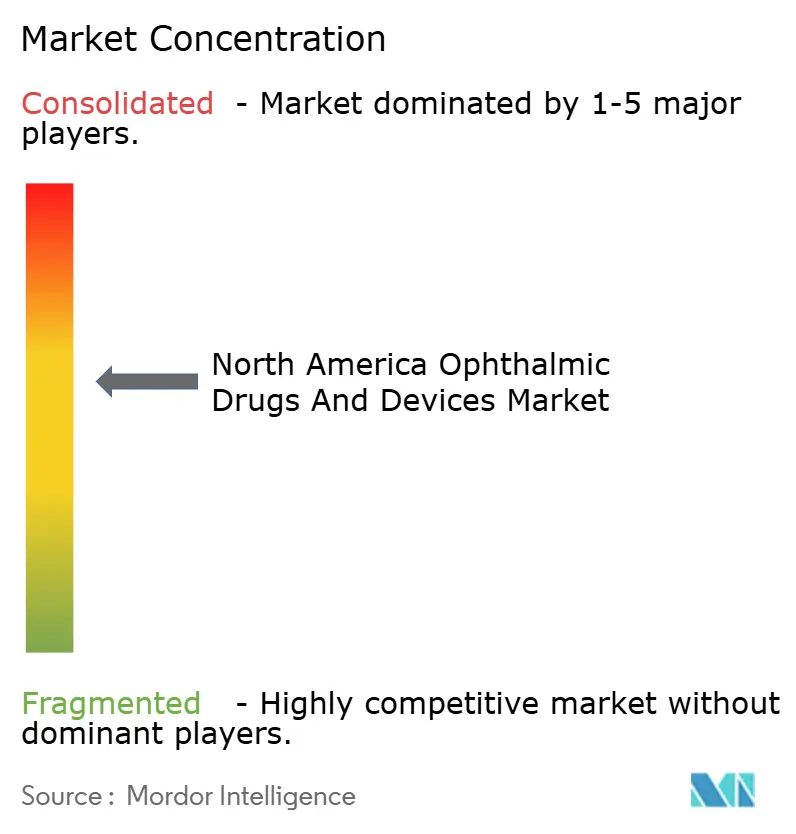
| Market Concentration | Medium |
Major Players *Disclaimer: Major Players sorted in no particular order Image © Mordor Intelligence. Reuse requires attribution under CC BY 4.0. | |
North America Ophthalmic Drugs and Devices Market Analysis by Mordor Intelligence
The North America Ophthalmic Drugs And Devices Market size is expected to grow from USD 39.34 billion in 2025 to USD 41.04 billion in 2026 and is forecast to reach USD 51.71 billion by 2031 at 4.73% CAGR over 2026-2031.
Diagnostic and monitoring devices generated the highest revenue, with optical coherence tomography, fundus cameras, and tonometers remaining routine equipment in 14,800 U.S. ophthalmology practices. Aging demographics reinforce volume: by 2030, roughly 73 million Americans will be older than 65, and this cohort already drives 70% of cataract surgeries and 80% of glaucoma diagnoses. Ambulatory surgery centers gain share because Medicare’s site-neutral rules now equalize payments for 67 low-complexity ophthalmic procedures, cutting hospital margins while lifting ASC reimbursement for complex cataract cases by 12% in the 2025 Physician Fee Schedule. Venture capital worth USD 230 million flowed into robotics and digital ophthalmic platforms during 2024-2025, underscoring investor conviction that autonomous surgery, AI imaging, and drug-eluting implants will reshape competitive dynamics.
Key Report Takeaways
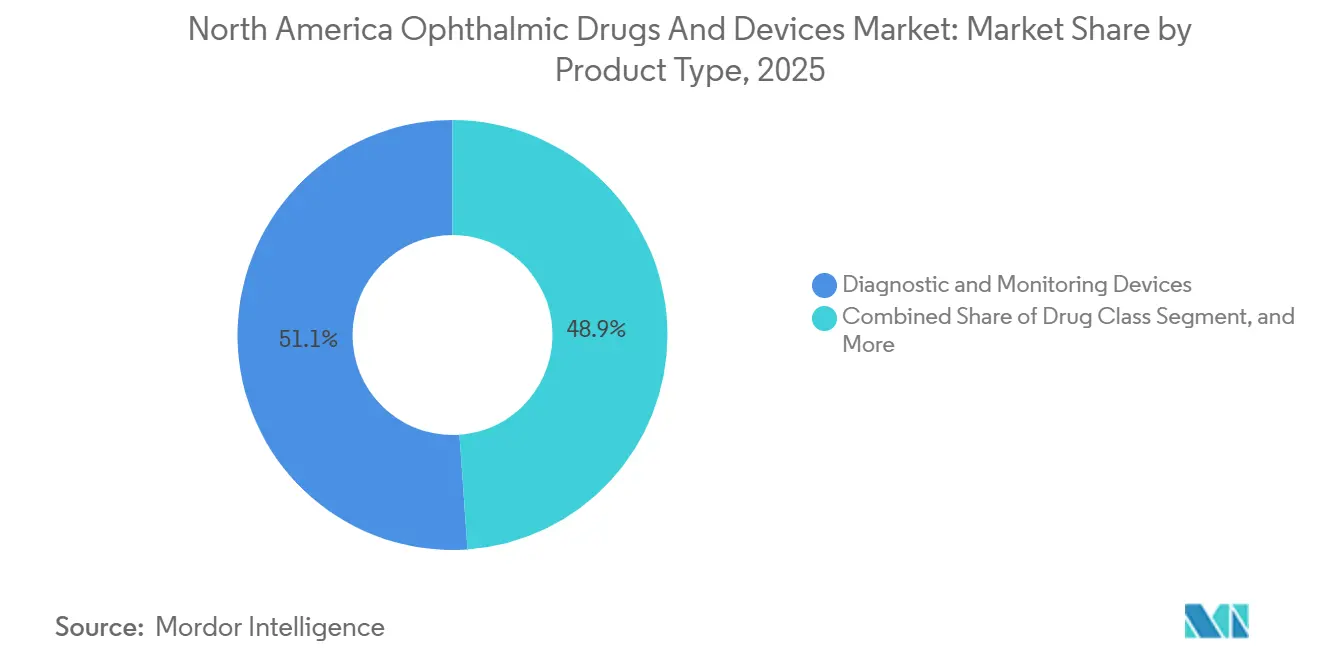
- By product type, diagnostic and monitoring devices led with 51.12% of North America ophthalmic devices and drugs market share in 2025. Drug class revenue is forecast to expand at a 6.33% CAGR through 2031, the fastest among product categories.
- By application, glaucoma applications are projected to grow at an 8.63% CAGR, outpacing cataract despite cataract’s 32.05% 2025 revenue lead.
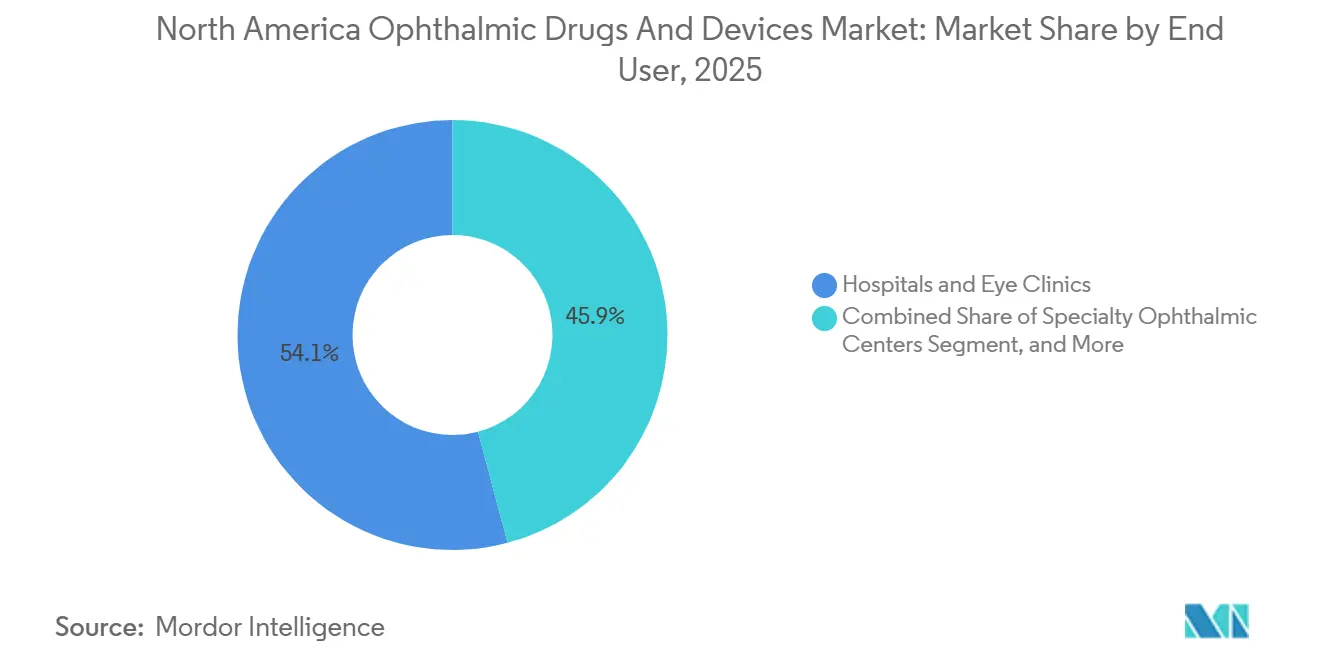
- By end user, specialty ophthalmic centers will register the highest end-user growth at 10.11% through 2031, while hospitals and eye clinics will hold 54.12% market share in 2025.
- By country, the United States led the North American ophthalmic devices and drugs market with 81.78% market share in 2025. Mexico is estimated to post the quickest country-level expansion at 8.26% through 2031 as medical tourism and private insurance adoption climb.
Note: Market size and forecast figures in this report are generated using Mordor Intelligence’s proprietary estimation framework, updated with the latest available data and insights as of January 2026.
Market Trends and Insights
Drivers Impact Analysis of North America Ophthalmic Drugs and Devices Market*
| Driver | (~) % Impact on CAGR Forecast | Geographic Relevance | Impact Timeline |
|---|---|---|---|
| Aging Population and Cataract–Glaucoma Burden | +1.2% | United States, Canada, Mexico (Sunbelt states most intense) | Long term (≥ 4 years) |
| Technological Advances in Minimally Invasive Surgery | +0.9% | United States and Canada metropolitan ASCs | Medium term (2-4 years) |
| AI Powered Diagnostic Imaging Adoption | +0.7% | U.S. primary-care networks, Canadian provincial programs | Medium term (2-4 years) |
| Outpatient ASC Procedure Growth | +0.8% | U.S. Medicare regions, select Canadian provinces | Short term (≤ 2 years) |
| VC Funding in Robotics and Digital Platforms | +0.4% | U.S. innovation hubs | Long term (≥ 4 years) |
| Smart Drug-Delivery Implants | +0.5% | United States and Canada, spillover to Mexico private hospitals | Medium term (2-4 years) |
| Source: Mordor Intelligence | |||
Aging Population and Cataract–Glaucoma Burden
By 2030, the 65-plus population in North America will total 83 million, representing a 35% jump from 2020 and accounting for 92% of age-related macular degeneration cases and 78% of primary open-angle glaucoma cases.[1] Cataract prevalence among Americans older than 75 climbed to 68% in 2024, up from 61% five years earlier, reflecting longer life expectancy and higher diabetes incidence. Canada’s National Institute on Ageing projects that seniors will make up one-quarter of the population by 2030, a shift already stretching cataract wait-lists that average 6.2 months in Ontario and British Columbia. Mexico’s aging curve lags but accelerates after 2028, prompting cross-border demand for U.S. procedures as the 60-plus cohort grows at 4.1% annually. This demographic momentum sustains steady cataract and glaucoma procedure pipelines that, in turn, support equipment upgrades and sustained drug dispensing.
Technological Advances in Minimally Invasive Surgery
Femtosecond laser-assisted cataract surgery penetrated 38% of U.S. premium cases in 2025 because blade-free capsulotomies cut posterior capsule rupture risk to 0.14% versus 0.92% for manual techniques. The iStent Infinite, cleared in 2024, places three micro-bypass stents through one injector and achieved an 18 mmHg mean intraocular pressure drop at 12 months in the APEX study. Lensar’s ALLY system overlays augmented-reality guidance on real-time OCT and was adopted by 127 U.S. ASCs in ten months. Canada reimburses FLACS only with premium IOLs, so 62% of 2025 cases were private-pay.
AI Powered Diagnostic Imaging Adoption
The FDA cleared 14 autonomous ophthalmic AI algorithms between January 2024 and December 2025, including EyeArt for diabetic retinopathy screening in primary care offices.[2] Notal Vision’s Home OCT lets AMD patients scan weekly at home, reducing clinic visits by 40% in a Veterans Affairs pilot involving 890 participants. By mid-2025, autonomous DR screening operated in 2,300 U.S. clinics, delivering 1.8 million scans and tripling referral rates compared with manual fundus review. Ontario integrated IDx-DR at 89 remote Indigenous health centers, diagnosing referable disease in 11.3% of adults and saving CAD 4.2 million in travel outlays. The FDA draft SaMD guidance issued in 2025 now requires post-market monitoring for algorithm drift when real-world demographics diverge from training data by more than 15%.
Outpatient ASC Procedure Growth
Ophthalmic cases performed in ASCs accounted for 21% of total U.S. volume in 2024, up from 16% in 2020, because site-neutral payments made lower-overhead facilities more profitable. The 2025 Physician Fee Schedule raised ASC reimbursement for complex cataract by 12% while hospital outpatient rates stayed flat.[3] Sg2 forecasts ASC ophthalmic demand will climb another 21% through 2029, helped by Medicare Advantage plans that steer beneficiaries toward contracted ASCs. Alberta, British Columbia, and Quebec now allow private ASCs for cataract, yet fee schedules pay only 78% of hospital tariffs, limiting penetration to 18%. Mexico licensed 23 new ophthalmic ASCs in 2024, mostly in Monterrey, Guadalajara, and Tijuana, to serve inbound medical tourists.
Restraints Impact Analysis of North America Ophthalmic Drugs and Devices Market*
| Restraint | (~) % Impact on CAGR Forecast | Geographic Relevance | Impact Timeline |
|---|---|---|---|
| High Capital Cost of Advanced Equipment | -0.6% | U.S. independent ASCs, Canadian public hospitals, Mexico private clinics | Medium term (2-4 years) |
| Stringent FDA Approval Timelines | -0.4% | U.S. device makers, cross-border suppliers to Canada and Mexico | Long term (≥ 4 years) |
| Shortage of Skilled Ophthalmic Technicians | -0.3% | U.S. rural regions, Canadian provinces | Short term (≤ 2 years) |
| Sustainability Push Against Single-Use Devices | -0.2% | United States and Canada, initial rules in California and British Columbia | Long term (≥ 4 years) |
| Source: Mordor Intelligence | |||
High Cost of Advanced Devices & Limited Procedure Reimbursement
A fully equipped ophthalmic ASC requires USD 1.2-2.5 million for a femtosecond laser, swept-source OCT, phaco system, and microscope, making entry into the market tough for independents. Alcon’s Centurion system is listed at USD 135,000 in 2025, whereas J&J’s Catalys laser costs USD 650,000 or USD 9,500 monthly under a seven-year lease. Independent ASCs doing fewer than 800 cataract cases a year face payback periods of more than 4 years. Canadian capital budgets fell 8% in real terms from 2020-2024, forcing hospitals to stretch equipment cycles to 15 years. Mexico’s clinics pay 12-18% import tariffs on U.S. devices, raising landed costs outside major metros.
Stringent FDA Approval Timelines
Median 510(k) ophthalmic review duration extended to 187 days in 2024 as CDRH requested more AI evidence. Class III PMA devices averaged 18.3 months, and 34% drew major deficiency letters. Smaller firms shoulder USD 1.2-3.5 million per filing, a burden that narrows disruptive pipelines. Health Canada mirrors FDA data requirements and adds separate provincial reimbursement dossiers, which can lengthen launches by up to 14 months. COFEPRIS adopted a 90-day fast track for Class II but still requires 12-18 months for implants, widening diagnostic–surgical asymmetry.
*Our forecasts treat driver/restraint impacts as directional, not additive. The impact forecasts reflect baseline growth, mix effects, and variable interactions.
North America Ophthalmic Drugs and Devices Market Segment Analysis
By Product Type:
Diagnostics Lead, Drugs AccelerateDiagnostics commanded 51.12% of 2025 revenue as swept-source OCT, fundus cameras and rebound tonometers became standard equipment in 92% of new office installations. The ophthalmic drug class will grow at 6.33% through 2031, overtaking hardware, as anti-VEGF biosimilars and novel dry-eye agents expand therapeutic volumes. Surgical devices grew 4.1% in 2024-2025 as premium toric and EDOF lenses lifted procedure revenue despite saturated monofocal demand. Vision care products face refractive-surgery headwinds, yet gain from myopia-control offerings aimed at children.
Swept-source OCT platforms such as Zeiss Cirrus 6000 displaced time-domain systems largely because 1050 nm wavelengths penetrate dense cataracts and capture 100,000 A-scans per second, a leap that enables widefield angiography. Fundus cameras integrating AI diabetic retinopathy software reached 41% of U.S. primary care deployments by mid-2025. Intraocular lens innovation is anchored by light-adjustable materials; RxSight’s LAL secured 12% of U.S. premium placements in 2025.

By Application:
Glaucoma Surges as MIGS Reshapes TreatmentCataract retained 32.05% of application revenue in 2025 on 4.2 million U.S. surgeries and remains the volume anchor through 2031. Glaucoma, however, will climb at an 8.63% CAGR as MIGS shifts surgery earlier; 32% of glaucoma operations used MIGS in 2025 compared with 18% in 2021. Retinal disorders generated 19% of revenue, with injection counts rising to 7.8 million annually. Refractive procedures have shifted from LASIK to SMILE, which now accounts for 28% of cases.
ASC economics favor cataract migration, with Medicare paying USD 1,138 per routine phaco case in ASCs versus USD 1,847 in hospitals. Premium lenses command USD 1,200-2,500 out-of-pocket per eye, bolstering surgeon income. MIGS devices lower mean IOP by roughly 25% and carry a lower complication risk than trabeculectomy, widening candidacy. Retinal reimbursement compression accelerates the adoption of longer-acting agents that stretch dosing to 12-16 weeks.
By End User:
Specialty Centers Gain as Consolidation AcceleratesHospitals and eye clinics delivered 54.12% of 2025 revenue but will cede share as specialty ophthalmic centers grow 10.11% through 2031 under private-equity ownership models that unify workflows and centralize purchasing. ASCs already perform 21% of ophthalmic procedures and gain a cost advantage from lower overhead, with operating costs averaging 42% of hospital outpatient equivalents.
Leasing has become the capital strategy of choice; 64% of ASCs opened in 2024-2025 leased lasers and OCT under 7-year agreements, slashing upfront spend to USD 12,000-15,000 per month. Medicare sequestration and nursing wage inflation shrink hospital cataract margins, hastening volume flight. Canadian formularies constrain private differentiation, while Mexico’s online pharmacy market remains nascent due to COFEPRIS script-verification rules.
Geography Analysis
United States Ophthalmic Drugs And Devices Market
The United States accounted for 81.78% of regional revenue in 2025, driven by 14,800 practices, 4.2 million cataract surgeries, and 7.8 million anti-VEGF injections. Premium segments drive U.S. upside as toric and multifocal lenses generated USD 1.9 billion in out-of-pocket spend, and femtosecond cataract technology added USD 680 million. Medicare Advantage enrollment hit 54% and steers two-thirds of beneficiaries to contracted ASCs, deepening consolidation. FDA granted 11 Breakthrough Device designations to ophthalmic innovations during 2024-2025, reinforcing the country’s launch primacy.
Canada Ophthalmic Drugs And Devices Market
Biosimilar ranibizumab reduced injection costs by 38% yet specialist wait times still exceed eight weeks in major provinces. Private clinics account for 34% of cataract cases with premium lenses, as public queues average 6.2 months. Device launches lag U.S. time-lines by up to 14 months due to separate CADTH health-technology assessments.
Mexico Ophthalmic Drugs And Devices Market
Mexico is poised for 8.26% CAGR, the region’s fastest, propelled by medical tourism that drew 42,000 U.S. patients in 2024 and expanding private insurance that now covers 29% of citizens. COFEPRIS licensed 23 new ophthalmic ASCs in 2024. LASIK prices remain 40-55% below U.S. levels, pulling cross-border volume. Class II device approvals were harmonized with FDA to 90 days, yet Class III implants still wait up to 18 months. IMSS public hospital backlogs push middle-income patients toward private options, accelerating demand for premium technology.
Regulatory Landscape
In the United States, ophthalmic products that combine a drug with a delivery component (such as certain dispensers packaged with ophthalmic drugs) can be regulated as combination products, with jurisdiction determined by the primary mode of action under 21 CFR Part 3. For drug-led combinations, manufacturers must comply with the combination-product cGMP framework under 21 CFR Part 4, aligning pharmaceutical GMP controls with device quality-system requirements in a single quality approach, which is particularly relevant for drug-device delivery formats used in dry-eye, glaucoma, and presbyopia drops.
In Canada, Health Canada routes classification questions for complex products through mechanisms such as the Therapeutic Products Classification Committee (TPCC), which supports determinations of whether a product is regulated as a drug, device, or drug-device combination product under the Food and Drugs Act and associated regulations. This up-front classification step influences evidence packages and the downstream sequence of federal review and provincial reimbursement files, a practical consideration for suppliers launching cross-border portfolios in North America.
Competitive Landscape
The top five suppliers, Alcon, Johnson & Johnson Vision, Bausch + Lomb, Carl Zeiss Meditec, and EssilorLuxottica, held a significant share of the North America ophthalmic devices and drugs market revenue in 2025, reflecting moderate concentration. Alcon acquired a surgical planning software platform in 2024 and launched the Clareon Vivity lens in 2025, deepening ecosystem integration. Bausch + Lomb bought Elios Vision for USD 385 million, adding a femtosecond platform that pairs with Stellaris phaco and enVista lenses. Biosimilar ranibizumab captured 22% of U.S. volume by 2025, trimming Regeneron’s Eylea share to 54%.
Emerging players use AI and robotics to carve niches. EyeArt autonomous screening now operates in 2,300 clinics and accounts for 14% of diabetic retinopathy scans. ForSight Robotics targets a 2026 FDA filing for its autonomous femtosecond cataract unit that could shift labor economics. RxSight’s Light Adjustable Lens achieved 12% of premium IOL placements in 2025 after securing U.S. and EU approvals. Carl Zeiss Meditec’s digital ARTEVO microscope captured 18% of premium scope sales inside its first U.S. year.
Private-equity-backed provider chains alter purchasing leverage. EyeCare Partners grew to 340 locations and negotiated 15-22% device discounts otherwise unavailable to standalone practices. Sustainability mandates spur product redesign; Alcon’s EnVision reusable handpiece entered the market in 2025 to comply with California and British Columbia rules. Patent strategy remains key Glaukos filed 14 new patents in 2024-2025 to extend iDose TR coverage through 2037.
North America Ophthalmic Drugs and Devices Industry Leaders
-
Alcon Inc.
-
Carl Zeiss Meditec AG
-
Haag-Streit Group
-
Johnson & Johnson
-
Bausch Health Companies Inc. (Bausch + Lomb)
- *Disclaimer: Major Players sorted in no particular order
North America Ophthalmic Drugs and Devices Market Companies Covered in this Report
- Alcon
- Bausch Health
- BVI Medical
- Canon
- Carl Zeiss
- The Cooper Companies
- EssilorLuxottica
- Glaukos Corp.
- HOYA
- HAAG-Streit
- Iridex
- Johnson & Johnson
- Lensar Inc.
- Lumenis
- Nidek
- Optovue (a Zeiss company)
- RxSight Inc.
- Santen Pharmaceutical
- STAAR Surgical
- Topcon
- Ziemer Group
Read Analysis of North America Ophthalmic Drugs and Devices Companies
Market Opportunities and Future Outlook
Combination-style ophthalmic therapies and delivery formats represent an active whitespace where product differentiation ties directly to regulatory execution and manufacturing capability. FDA approval of Tenpoint Therapeutics YUVEZZI (carbachol and brimonidine tartrate ophthalmic solution) for adult presbyopia in January 2026 highlights continued innovation in multi-ingredient ophthalmic solutions, while FDA approval activity for ophthalmic generics such as Alembic Pharmaceuticals loteprednol etabonate and tobramycin ophthalmic suspension (ANDA, Competitive Generic Therapy designation, December 2025) signals sustained competitive pressure in mature anti-infective and anti-inflammatory classes.
Operationally, the U.S. combination-product framework under 21 CFR Part 4 creates opportunity for developers and suppliers that build robust primary mode of action (PMOA) strategies early and partner with contract manufacturers capable of operating dual-regime quality systems for both drug and device elements. As autonomous imaging and home monitoring expand within care pathways (for example, diabetic retinopathy screening in primary care and home OCT pilots), software-enabled diagnostics and workflow tools that integrate with ophthalmology practices and ASCs create additional commercial space for platforms that reduce technician burden and increase throughput.
Recent Industry Developments in North America Ophthalmic Drugs and Devices Market
- July 2026: Alcon entered a non-exclusive collaboration with RxSight to co-develop adjustable presbyopia-correcting intraocular lenses, including a USD 60 million upfront payment and up to USD 140 million in potential milestone payments. The deal links Alcon's cataract and refractive ecosystem with RxSight's adjustable-lens know-how, strengthening competitive positioning in the premium IOL segment where outcomes and customization drive differentiation.
- May 2025: Genentech received FDA clearance for Susvimo as a nine-month refill treatment for diabetic retinopathy, reducing treatment frequency to roughly two refills per year for eligible patients. The longer refill interval supports clinic capacity management in retina practices that face high injection volumes and encourages broader adoption of implant-based delivery models.
- January 2025: Neurotech Pharmaceuticals received FDA approval for the ENCELTO implant for macular telangiectasia type 2, marking a notable step for surgical implant approaches in retinal disease. The approval validates sustained-release, device-enabled therapeutic strategies that can shift dosing logistics away from frequent in-office injections and influence future R&D and partnering in ocular implants.
North America Ophthalmic Drugs and Devices Market Report Scope and Research Methodology
Market Definition and Coverage
This market covers revenues from ophthalmic drugs and ophthalmic devices sold in North America that are used to detect, treat, or correct eye diseases, with values captured at manufacturer selling price in USD.
Scope exclusions: Cosmetic-only contact lenses, optometry service fees, and vision-insurance premiums are excluded from this sizing.
Segments Covered in This Report
- By Product Type
- Diagnostic & Monitoring Devices
- Optical Coherence Tomography Scanners
- Fundus Cameras
- Tonometers
- Other Diagnostic Devices
- Surgical Devices
- Intra-ocular Lenses
- Ophthalmic Lasers
- Phacoemulsification Systems
- Other Surgical Devices
- Vision Care Products
- Drug Class
- Anti-VEGF Agents
- Anti-inflammatory/Ocular NSAIDs
- Glaucoma Therapeutics (Prostaglandin Analogues, β-Blockers, Others)
- Anti-infectives
- Dry-Eye Therapies
- Diagnostic & Monitoring Devices
- By Application
- Cataract
- Glaucoma
- Refractive Errors
- Retinal Disorders
- Dry-Eye & Ocular Surface
- By End User
- Hospitals & Eye Clinics
- Ambulatory Surgery Centers (ASCs)
- Specialty Ophthalmic Centers
- By Country
- United States
- Canada
- Mexico
Data Sources, Market Sizing, and Validation
Desk Research
Desk research was used to establish the fact base for demand and supply signals across the United States, Canada, and Mexico, before building the market model. We reviewed public sources such as the US Census Bureau, Statistics Canada, the CDC, and the NIH (including NEI), and also used WHO and OECD health datasets for population and disease indicators that affect treated volumes.
To keep product boundaries clear, we also checked items like FDA drug approvals and device clearances, Health Canada product and safety communications, and published ophthalmology literature describing standard of care and therapy patterns. Company filings, investor presentations, and reputable press were used to understand product mix, pricing direction, and commercial focus. A paid subscription for company financials and patent intelligence was used selectively to confirm launch timing and portfolio breadth. These sources are illustrative only, and many other public references were used during data collection, cross-checking, and clarification.
Primary Interviews and Surveys
Primary work focused on validating how volumes and prices behave in real purchasing settings, especially across hospital pharmacies, ambulatory surgical centers, and specialty clinics. We interviewed a mix of manufacturers, distributors, clinicians, and procurement roles across North America to stress-test assumptions on adoption, replacement cycles, and therapy persistence, and to align the model to what is reimbursed and purchased in the region.
Distribution of primary research fieldwork respondents
| Company type | Respondent position |
|---|---|
| Top tier: 30% | CXOs: 13% |
| Mid tier: 56% | Functional/Unit leaders: 35% |
| Smaller Players: 14% | Managers: 52% |
Market-Sizing & Forecasting
Market sizing was built using top-down logic where epidemiology and treated-patient pools are translated into therapy and procedure volumes, which are then converted into revenue using observable pricing and mix. Results were then corroborated with selective bottom-up approximations, such as sampled ASP times volume for key drug classes and roll-ups of device categories using channel checks, and then totals were adjusted when the two views did not reconcile.
Inputs were chosen to reflect how this market actually moves. We used indicators such as diagnosed prevalence and aging population trends, cataract and glaucoma procedure rates, anti-VEGF injection frequency patterns, device replacement and capital refresh cycles in clinics and ASCs, and price and mix shifts tied to newer launches and reimbursement behavior. Where a clean volume series was not available, gaps were handled using proxy measures like procedure counts, utilization ranges validated by interviews, and conservative carry-forward rules until a better signal was confirmed.
For forecasting, scenario analysis was used so base, conservative, and faster-adoption paths could be run against the same variable set. Assumptions on treatment penetration, procedure growth, and price progression were aligned to what industry participants expect to be sustainable, and then rechecked for internal consistency across the three North American countries.
Data Validation & Update Cycle
Validation was done through repeated cross-checks between the model output and independent signals, then variances were investigated before final sign-off. We compared implied per-patient spending, procedure-linked consumption, and growth rates against public health metrics and what respondents described as realistic adoption and pricing behavior.
Anomaly checks were run at the country level and at major product group level so sudden jumps could be traced back to a specific driver like a new launch, a reimbursement shift, or a step-change in procedure volumes. Reports are refreshed annually, and interim updates are triggered when material events occur, followed by a final pre-delivery review to ensure the latest market-moving changes are reflected.
Mordor Intelligence's North America Opthalmic Devices Drugs Market Estimate Compared With Other Published Estimates
It is normal to see different market sizes published for ophthalmic drugs and devices because the scope line is drawn differently, and because price and volume assumptions are not always tested in the same way. Differences also come from the year used as the base, the treatment of manufacturer price versus retail value, and how quickly models are refreshed after approvals or reimbursement changes.
By tracking approval and clearance timelines, procedure-linked utilization, and manufacturer price points, Mordor Intelligence keeps the 2025 total tied to North America revenues for prescription and OTC ocular pharmaceuticals plus diagnostic, surgical, and vision-care devices, rather than blending in services or unrelated vision spending.
Benchmark comparison
| Source | Market Size | Gaps in Research Methodology |
|---|---|---|
| Mordor Intelligence | USD 39.34 B (2025) | |
| Industry Research Publisher A | USD 42.62 B (2025) | This estimate appears to apply a broader growth frame and may carry a wider inclusion set across devices and drug delivery forms without clearly separating manufacturer selling price from downstream markups, which can lift the stated 2025 total. |
| Global Research Publisher B | USD 25.47 B (2024) | The stated value uses a different base year and does not spell out inclusions, so parts of the device mix or OTC drug revenues may be left out, and the time alignment and currency timing can pull the number downward versus a 2025 manufacturer-price view. |
Across the three sources, most of the spread is explained by boundary choices, base-year timing, and whether pricing is treated at the manufacturer level or with added downstream economics. Our approach stays repeatable because each step is tied back to patient and procedure drivers, checked against pricing logic, and then reconciled to what stakeholders confirm is happening in purchasing channels.
Key Questions Answered in the Report
How large will spending on ophthalmic devices and drugs be in North America by 2031?
Spending is forecast to reach USD 51.71 billion by 2031, reflecting a 4.73% CAGR from 2026.
Which application is expected to grow fastest to 2031?
Glaucoma treatment and management are projected to advance at an 8.63% CAGR, driven by early adoption of micro-invasive glaucoma surgery devices.
Why are ambulatory surgery centers gaining ophthalmic volume in the United States?
Medicare site-neutral payments and a 12% 2025 reimbursement boost for complex cataract procedures make ASCs more cost-effective than hospital outpatient departments.
What technology trends drive upgrades to diagnostic equipment?
AI-enabled swept-source OCT, autonomous diabetic-retinopathy screening, and home OCT for AMD monitoring push practices to replace legacy imaging systems.
How are sustainability rules influencing product design?
California and British Columbia regulations on single-use instruments led suppliers like Alcon to introduce reusable phaco handpieces that can be sterilized for 500 cycle.