
Market Overview
| Study Period | 2020 - 2031 |
|---|---|
| Forecast Data Period | 2026 - 2031 |
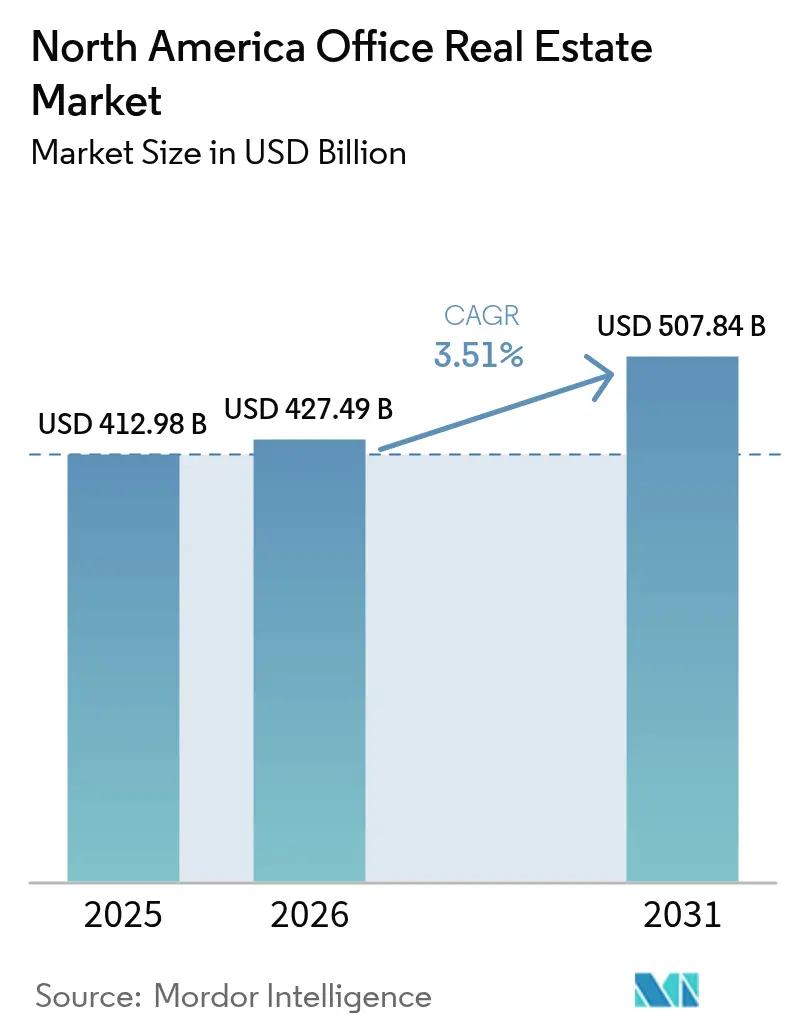
| Base Year Market Size (2025) | USD 412.98 Billion |
| Market Size (2026) | USD 427.49 Billion |
| Market Size (2031) | USD 507.84 Billion |
| Growth Rate (2026 - 2031) | 3.51% CAGR |
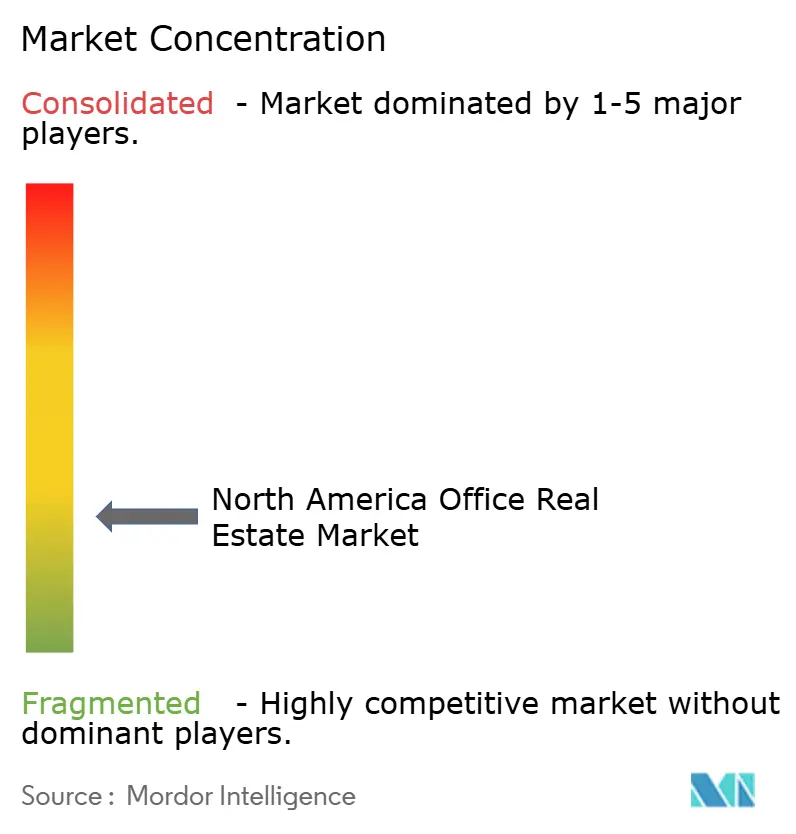
| Market Concentration | Low |
Major Players *Disclaimer: Major Players sorted in no particular order Image © Mordor Intelligence. Reuse requires attribution under CC BY 4.0. | |
North America Office Real Estate Market Analysis by Mordor Intelligence
The North America Office Real Estate Market size in 2026 is estimated at USD 427.49 billion, growing from 2025 value of USD 412.98 billion with 2031 projections showing USD 507.84 billion, growing at 3.51% CAGR over 2026-2031. Demand is splitting sharply between premium workplaces and aging commodity space as tighter return-to-office mandates intersect with durable hybrid work adoption. Grade A buildings capture flight-to-quality leasing, while large volumes of Grade B/C stock face conversion to residential or data-center uses. Investor appetite is re-emerging for distressed trophies after rate cuts, yet refinancing headwinds remain acute for highly levered secondary assets. Nearshoring is steering fresh capital into Mexican growth corridors, and municipal “green overlay” incentives are accelerating adaptive reuse in U.S. gateway cities. Overall, the North America office real estate market is becoming a two-track arena defined by amenity-rich, energy-efficient space on one side and rapidly obsolescing stock on the other.
Key Report Takeaways
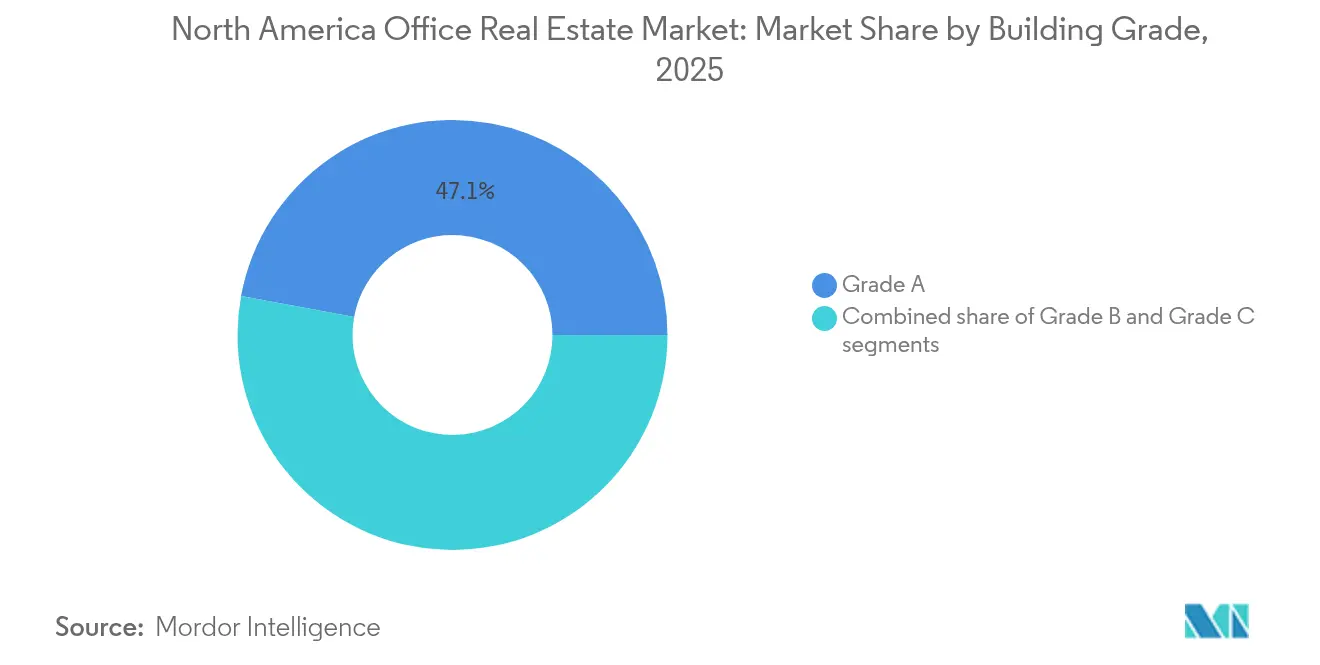
- By building grade, Grade A assets commanded 47.10% of the North America office real estate market share in 2025, and this segment is expanding at a 3.85% CAGR through 2031.
- By transaction type, rentals represented 77.40% of total activity in 2025, while sales are the fastest-growing segment at a 3.95% CAGR to 2031.
- By end use, information technology held a 27.95% share of the North America office real estate market size in 2025 and is forecast to increase at a 4.05% CAGR during 2026-2031.
- By country, the United States retained 89.65% share of 2025 revenue, whereas Mexico is set to post the highest 4.32% CAGR over the forecast period.
Note: Market size and forecast figures in this report are generated using Mordor Intelligence’s proprietary estimation framework, updated with the latest available data and insights as of 2026.
North America Office Real Estate Market Trends and Insights
Drivers Impact Analysis*
| Driver | (~) % Impact on CAGR Forecast | Geographic Relevance | Impact Timeline |
|---|---|---|---|
| Return-to-office mandates lifting premium-grade leasing demand | +0.8% | United States & Canada | Short term (≤ 2 years) |
| Record capital availability for opportunistic office buys post-rate cuts | +0.6% | North America | Medium term (2-4 years) |
| Flight-to-quality trend favoring energy-efficient, amenity-rich buildings | +0.5% | Global / U.S. gateways | Long term (≥ 4 years) |
| AI model-training loads driving conversion of Grade B/C stock to edge data centers | +0.4% | U.S. data-center hubs | Medium term (2-4 years) |
| Municipal “green-overlay” zoning incentives fast-tracking office-to-residential conversions | +0.3% | U.S. urban cores | Long term (≥ 4 years) |
| Rise of private-credit funds offering bridge-to-core financing for distressed assets | +0.2% | North America secondary markets | Short term (≤ 2 years) |
| Source: Mordor Intelligence | |||
Return-to-office mandates lifting premium leasing
Large employers such as Amazon, Starbucks, and IBM reinstated four-to-five-day attendance rules in 2024, pushing 75% of U.S. white-collar staff under set office-presence targets. Tenants now concentrate on best-in-class towers where high-spec ventilation, wellness certifications, and vibrant amenities help justify commutes. The 100 biggest leases averaged 288,834 sq ft, up 8% year on year, with 68% structured as renewals to lock cost certainty. Financial-services occupiers dominated Manhattan’s high-rent deals, securing 64% of leases above USD 100 psf and nearly tripling contracts above USD 200 psf. Employers with set attendance policies report lower turnover versus fully remote peers, reinforcing premium-space demand signals.
Capital surge for opportunistic office buys post-rate cuts
Easing monetary policy has revived deal pipelines for well-capitalized investors. Private-credit giants alone amassed more than USD 40 billion earmarked for bridge-to-core office debt, led by KKR’s USD 42 billion pipeline. Assets in distress trade at 30-70% below replacement cost, especially in secondary U.S. metros where local banks pulled back lending. Monarch Capital Partners deployed USD 3.6 billion into opportunistic plays by April 2024, benefiting from a USD 929 billion commercial mortgage maturity wall through 2025. REITs added USD 84.7 billion of fresh equity in 2024 to hunt similar bargains.
Flight-to-quality toward green amenity-rich buildings
Hybrid norms leave commodity space struggling, yet prime towers recorded positive 49 million sq ft net absorption between 2020-2024 while non-prime lost 170 million sq ft. Effective rents for Class A+/A rose 5.2% since 2023 and now command 84% premiums over B/C stock. Upcoming regulations such as New York’s Local Law 97, which levies USD 268 per-ton carbon fees from 2025, heighten owner urgency to decarbonize[1]New York City Mayor’s Office of Climate & Environmental Justice, “Climate Mobilization Act: Local Law 97,” NYC Accelerator, accelerator.nyc.
AI-driven upgrades converting Grade B/C offices to edge data centers
Soaring AI training loads require low-latency compute close to users. Vacant offices with solid power feeds and fiber routes are prime conversion candidates, reducing delivery time versus ground-up builds. Prologis has repurposed warehouse shells into data-ready space outside Chicago, spotlighting power access as the key determinant. Edge retrofits simultaneously relieve oversupply in under-performing submarkets and feed surging data-center demand, with investors arbitraging location and electrical capacity.
Restraints Impact Analysis*
| Restraint | (~) % Impact on CAGR Forecast | Geographic Relevance | Impact Timeline |
|---|---|---|---|
| Persistent hybrid-work adoption reducing net absorption | -0.9% | North America (tech-heavy metros) | Long term (≥ 4 years) |
| Elevated refinancing wall & tightened bank-lending standards | -0.7% | United States & Canada | Short term (≤ 2 years) |
| Generative-AI workplace-planning tools optimizing space use, cutting footprints | -0.4% | Global (early tech & finance adopters) | Medium term (2-4 years) |
| Local energy-performance mandates penalizing older assets | -0.3% | U.S. major metros | Medium term (2-4 years) |
| Source: Mordor Intelligence | |||
Persistently hybrid work cutting net absorption
Hybrid work stabilized at 80% adoption even as mandates intensified, with actual U.S. office utilization averaging only 38% of capacity in 2024. Organizations reduced seat counts by 15% per head, targeting 25% smaller footprints via sharing ratios above 1.5:1. Vacancy climbed to 19% by Q1 2025, the highest since the early 1990s[2]U.S. Government Accountability Office, “Commercial Real Estate: Trends, Risks, and Federal Monitoring Efforts,” GAO, gao.gov. Nearly half of surveyed employees would quit rather than return full-time, valuing flexibility at an 8% pay uplift. These shifts permanently depress absorption of generic space, tilting demand toward fewer, higher-quality locations.
Refinancing wall amid tighter bank lending
More than USD 1.2 trillion of U.S. commercial mortgages will mature by 2025, with offices forming 17% of the load. Regional banks, which hold 75% of these loans, curtailed new originations as deposit flight and higher funding costs squeezed balance sheets. Office CMBS delinquency rose to 5.07% by early 2024, and only 10% of maturing loans were paid off at term. Borrowers confront conservative loan-to-value hurdles and fresh equity requirements that many cannot meet, triggering loan extensions and discounted trades.
*Our forecasts treat driver/restraint impacts as directional, not additive. The impact forecasts reflect baseline growth, mix effects, and variable interactions.
Segment Analysis
By Building Grade: Premium towers dominate a bifurcated landscape
Grade A space captured 47.10% of the North America office real estate market share in 2025 and continues to lead absorption trends as tenants consolidate into modern, tech-enabled environments. Prime towers posted positive leasing of 49 million sq ft versus a 170 million sq ft loss in non-prime categories. Average asking rents in Grade A exceed lower classes by 84%, reflecting superior amenities and ESG credentials. Financial services firms signed 64% of USD 100-plus rents in Manhattan, further tightening supply at the top end.
Competitive gaps will widen through the decade. The fastest-growing slice—ultra-prime, ESG-certified assets—should track a 3.85% CAGR, underpinned by carbon-penalty regimes such as Local Law 97 that elevate compliant stock values. Vacancy inside Toronto’s AAA cluster, for instance, rests at 7.2% against citywide 18%. Investments in smart-building tech, wellness amenities, and on-site power resilience will cement pricing power for landlords in this tier, while older buildings head toward conversion or repricing.


By Transaction Type: Rentals prevail, but opportunistic sales accelerate
Rental contracts accounted for 77.40% of 2025 volume, signaling corporations’ preference for flexibility while they refine hybrid policies. Lease renewals dominated big-ticket activity, representing 68% of top-100 deals, as occupiers locked favorable terms without relocation disruption. The North America office real estate market size tied to leasing should expand modestly as tenants prioritize smaller but higher-quality footprints.
Sales transactions, although a smaller share, register the highest 3.95% CAGR over 2026-2031, propelled by discounted buying opportunities and cheaper debt post-rate cuts. Private-credit funds and equity REITs are mobilizing record capital to recapitalize properties unable to refinance. Notable moves include Office Properties Income Trust swapping 2025 notes for new 8% 2030 paper to shore up liquidity. Municipal conversion incentives are also spawning new deal flow outside the rent-versus-buy dichotomy, adding complexity to capital-allocation decisions.
By End Use: Tech sector reshapes demand physics
Information technology commanded 27.95% of 2025 leasing and embodies the fastest 4.05% CAGR to 2031, CBRE. Tech occupiers continue signing large leases—29 of the top 100 in 2024—yet they also spearhead AI-driven efficiency that spurs edge-data-center retrofits. Roughly 43% of enterprises now deploy AI for space-management analytics, tightening utilization metrics. The North America office real estate market size tied to IT will therefore split between conventional workspace and high-power data infrastructure inside urban shells.
Financial-services tenants remain pivotal. They dominate luxury leasing and are urgently chasing green-certified locations to satisfy Scope 3 targets, benefiting owners of LEED-Platinum towers. Professional-services firms maintain hybrid-friendly footprints with elevated collaboration areas, whereas life-science and energy players seek specialized build-outs resistant to commoditization. This diversification insulates landlords with mixed-use portfolios from sector-specific shocks.

Geography Analysis
The United States maintained 89.65% of 2025 spending in the North America office real estate market, buoyed by dense corporate clusters and an escalating return-to-office push. Manhattan continued to outperform: 28 leases surpassed USD 200 psf in 2024, nearly three times 2023’s volume. Yet recovery is uneven; Sun Belt metros such as Miami logged rent growth, while San Francisco values slid 18% amid persistent tech-sector remote work. Regulatory levers like New York City’s 467-m tax break and Local Law 97 shape asset repositioning economics, and a USD 929 billion refinancing wall looms over secondary U.S. markets.
Canada represents the second-largest slice of the North America office real estate market. Toronto recorded 650,000 sq ft positive absorption in 2024—its first yearly gain since 2019—yet overall national vacancy touched 18.3%. Construction sits at 20-year lows, signaling a supply pause while conversions accelerate. Calgary’s incentive plan aims to retire 6 million sq ft of surplus offices by 2031, offering a blueprint other Canadian cities may emulate.
Mexico is the fastest-growing geography, tracking a 4.32% CAGR through 2031 as nearshoring fuels record USD 36 billion FDI in 2023. Office demand in Monterrey, Guadalajara and Mexico City rides on manufacturing back-office needs and rising cross-border trade, which hit USD 286 billion with Texas alone in 2022. Northern industrial corridors show sub-2% vacancy after a new-build wave, and airport expansions reinforce the growth narrative. Persistent issues around water and security require risk-adjusted underwriting, but policy incentives and strategic location keep Mexico on investors’ radar.
Regulatory Landscape
Regulation affecting North America office real estate is increasingly tied to space utilization transparency and footprint efficiency, particularly for government occupiers. In the United States, the USE IT Act occupancy and utilization reporting framework has pushed the U.S. General Services Administration (GSA) to publish initial government-wide utilization data in March 2026, using a 60% utilization threshold for CFO Act agencies. This is shaping how federal agencies benchmark leased versus owned space and rationalize portfolios.
Policy is also tightening around workplace design standards and building performance. In June 2026, GSA issued Directive OAS 7005.1B, setting an internal utilization goal of 80% and an all-in space allocation limit of 150 usable square feet per person for future internal workplace projects. This reinforces densification and flexible planning in federal demand centers. On energy performance, the U.S. Department of Energy moved in May 2026 to end the stay of the compliance date for the Clean Energy Rule for certain new or majorly renovated federal buildings, which adds pressure for electrification and efficiency upgrades that can spill over into landlord capex near federal tenancy clusters. In Canada, Public Services and Procurement Canada has been running a multi-year office-portfolio optimization program, including a published 10-year plan targeting major reductions in the PSPC-administered footprint and tighter in-office presence policies in 2026. The result is an uneven near-term pull on government-driven absorption across metros.
Value Chain Analysis
The office real estate value chain in North America starts with land acquisition and capital formation, then moves into development or repositioning (developers, architects and engineers, and general contractors), followed by leasing and operations (brokerage, property or facilities management, and building systems vendors). The sequence ends with asset management, refinancing, and disposition. Market bifurcation is steering activity toward two execution paths: (i) premium new-build or major repositioning with high-spec MEP, wellness, and energy-performance features that support flight-to-quality leasing, and (ii) adaptive reuse that converts obsolete Grade B/C space into alternative uses, with office-to-residential pathways influenced by municipal incentives discussed in the report context.
Delivery has become more sensitive to procurement and construction logistics because of skilled trade constraints (especially MEP), utility and power availability limits for electrification and resilience upgrades, and extended lead times for critical equipment. Large contractors are responding by tightening supply-chain capabilities and expanding direct manufacturer partnerships to improve delivery certainty; for example, DPR Construction has highlighted analytics-driven supply-chain management and national self-perform capabilities as ways to control logistics. For landlords and developers, earlier integration of AEC teams, open-book procurement, and staged retrofit scheduling is increasingly used to manage cost volatility while keeping assets leasing-ready under tighter energy-performance mandates in major metros.
Competitive Landscape
The North America office real estate market displays low concentration, yet market power is tilting toward institutional landlords able to fund retrofits and source inexpensive capital. Public REITs raised USD 84.7 billion in 2024 to acquire distressed stock, recycle out of non-core assets, and green-upgrade core holdings. Boston Properties reported 5.6 million sq ft of new leases even as it recognized USD 341 million in impairments, illustrating the bifurcation between trophy and secondary assets.
Technology implementation is becoming a critical differentiator. CBRE, Jones Lang LaSalle IP, and Cushman & Wakefield deploy AI-driven platforms for predictive maintenance and space planning, cutting operating expenses and improving tenant satisfaction. Landlords embracing smart-building upgrades secure longer lease terms from corporate occupiers aiming to enhance employee experience metrics. Adaptive-reuse leadership is also emerging: Brookfield and Hines are partnering with municipalities on office-to-residential conversions that tap local tax abatements.
Private-credit funds such as KKR are disintermediating traditional banks, supplying bridge-to-core financing at attractive spreads but tighter covenants. Their willingness to underwrite complex capital stacks gives well-capitalized buyers an edge in distressed auctions. Smaller owners lacking scale or ESG cap-ex capacity are increasingly forced into joint ventures or sales, ratcheting competitive intensity for prime assets in gateway cities.
North America Office Real Estate Industry Leaders
Hines
Brookfield Asset Management
BXP Inc.
SL Green Realty Corp.
Vornado Realty Trust
- *Disclaimer: Major Players sorted in no particular order

Market Opportunities and Future Outlook
A key opportunity is repositioning and leasing strategies that align with the flight-to-quality split, especially for Grade A buildings. These assets already account for nearly half of the 2025 market share in the report and they capture premium rent spreads over B/C stock. Landlords that can fund HVAC, electrification, and amenity upgrades have a clearer pathway to attract occupiers operating under return-to-office policies. At the same time, older commodity space increasingly functions as feedstock for adaptive reuse, including office-to-residential programs shaped by municipal incentives in U.S. gateway cities. That dynamic supports conversion pipelines that aim to reduce oversupply and recycle aging inventory, including structuring roles for developers, capital partners, and municipal programs.
Government portfolio optimization and reporting also create near-term catalysts for both leasing reconfiguration and retrofit work. In the United States, the USE IT Act has introduced public utilization reporting for federal buildings, and early 2026 reporting showed utilization gaps versus the 60% threshold, prompting GSA to revisit how data can be compared across building types. GSA Directive OAS 7005.1B (June 2026) reinforces densification targets, including an 80% utilization goal and a 150 USF per person allocation limit, which can translate into re-stacking, consolidation, and changes in lease terms and build-out scopes in federal-heavy markets. In Canada, PSPC has articulated a long-horizon plan to materially shrink its administered office portfolio while also implementing stronger onsite presence policies in 2026. That raises the need for space planning, restacking, and fit-outs even as overall footprints are rationalized. A third opportunity is technology-enabled space management, since enterprise adoption of occupancy analytics and AI remains uneven. The gap between exploratory pilots and operational optimization leaves room for brokers, workplace platform providers, and owners to differentiate using measurable utilization, experience, and operating-cost outcomes.
Recent Industry Developments
- July 2026: BXP, Inc. hired Eastdil Secured to market the 7 Times Square ground lease in New York City, with reported pricing indications in the USD 700-750 million range. The marketing process points to continued portfolio recycling by large office REITs to manage leverage and concentrate capital in higher-conviction assets and markets.
- January 2026: SL Green Realty Corp. and Rockpoint formed a joint venture for 100 Park Avenue, with SL Green selling a 49% interest at a gross asset valuation of USD 425 million. The structure shows how joint ventures are being used to generate liquidity and share refinancing and repositioning risk while keeping operating control and upside exposure.
- June 2025: San Francisco enacted a Downtown Revitalization Financing District covering roughly 1,200 offices eligible for conversion into about 4,400 homes. The district formalized a financing tool to accelerate office-to-residential adaptive reuse, shaping exit options and underwriting assumptions for lower-grade downtown inventory.


Research Methodology Framework and Report Scope
Market Definition and Coverage
For this study, the market is defined as the value generated from office real estate in North America, captured through leasing and sale transactions for office-use buildings and spaces, across the United States, Canada, and Mexico.
Scope exclusions: We exclude properties that are primarily converted or configured for non-office use such as logistics, data center, or retail operations after conversion.
Segmentation Overview
- By Building Grade
- Grade A
- Grade B
- Grade C
- By Transaction Type
- Rental
- Sales
- By End Use
- Information Technology (IT & ITES)
- BFSI (Banking, Financial Services and Insurance)
- Business Consulting & Professional Services
- Other Services (Retail, Lifescience, Energy, Legal)
- By Country
- United States
- Canada
- Mexico
Data Sources, Market Sizing, and Validation
Desk Research
Desk work started with public series that describe how much office space exists, how it is used, and how pricing is moving, then those signals were translated into value inputs. Sources used include official and open publications such as Statistics Canada, the US Bureau of Economic Analysis, the US Census Bureau construction and building datasets, and Banco de Mexico macro series, which help anchor economic activity, construction, and the property cycle.
We also relied on industry-facing references such as NAIOP publications, selected peer-reviewed real estate and urban economics papers, and reputable press and exchange filings to understand leasing trends, vacancy direction, and capital market conditions. In parallel, we referenced paid subscriptions for company financials and intelligence, patent databases for workplace and building-tech signals, and an import-export shipment-level database where it helped confirm renovation and fit-out activity. These sources are not exhaustive, and other public documents and datasets were also used to collect data, validate assumptions, and clarify gaps.
Primary Interviews and Surveys
Primary work was used to convert space and pricing indicators into realistic transaction values and to pressure-test assumptions that can vary by city and asset quality. We spoke with a mix of landlords, brokers, asset managers, investors, and corporate occupiers across the United States, Canada, and Mexico, and the discussions were used to confirm leasing structures, typical rent steps, occupancy expectations, and how adaptive reuse is being treated in deal pipelines.
Distribution of primary research fieldwork respondents
| Company type | Respondent position | Region |
|---|---|---|
| Top tier: 27% | CXOs: 19% | |
| Mid tier: 53% | Functional/Unit leaders: 36% | |
| Smaller Players: 20% | Managers: 45% |
Market-Sizing & Forecasting
We built the market using top-down and bottom-up logic, so the totals stay tied to observable office activity rather than only headline real estate value. The top-down path reconstructs value from core demand and pricing signals, where office stock, occupancy, effective rents, typical lease terms, and the mix of new deliveries versus renewals are converted into annualized leasing value, then adjusted for sales activity where relevant.
To corroborate the totals, we used selective bottom-up checks such as sampled rent per square foot by key cities, implied revenue rollups for listed office landlords, and channel checks on typical leasing volumes by building grade. Where bottom-up data was patchy, the gaps were filled using conservative ranges agreed in expert calls, followed by sensitivity checks so a single outlier city did not distort North America results.
For forecasts, scenario analysis was applied because office demand is sensitive to return-to-office patterns and refinancing conditions. Inputs we leaned on include employment in office-using sectors, vacancy direction, net absorption sentiment from market participants, new completions timing, and rent step-up expectations, then these were reviewed with interviewees before final sign-off.
Data Validation & Update Cycle
Before finalizing results, we ran triangulation checks between the model outputs and independent signals such as leasing momentum commentary, construction pipeline changes, and reported transaction activity, then large variances were traced to the specific assumption causing them. When the variance could not be explained cleanly, the analyst team re-checked the underlying inputs, revisited conversion logic, and re-contacted selected participants to confirm market behavior.
A multi-step internal review is used so calculation errors and unrealistic jumps are flagged early, and only consistent figures proceed to the final draft. Reports are refreshed annually, with interim updates when material events occur, such as major policy changes, sharp rate moves, or a sudden shift in occupancy behavior. Right before delivery, we do a final pass so clients receive the latest updated view.
Mordor Intelligence's North America Office Real Estate Market Estimate Compared With Other Published Estimates
It is common to see different market values for North America office real estate because publishers do not always count the same revenue flows, and update timing can also change the reported year. Differences usually come from what is treated as transaction value versus asset value, how leasing is annualized, and whether adaptive reuse is treated as office or moved into another property bucket.
The biggest gap comes from mixing office transaction value with broader commercial real estate measures, where Mordor Intelligence counts office-use rental and sales transactions for purpose-built office assets and does not inflate totals by folding in non-office conversions or total property value proxies. Another driver is rent and occupancy handling, since some estimates push an aggressive rent rebound path, while others hold vacancy flat without validating it against city-level leasing sentiment and construction deliveries.
Benchmark comparison
| Source | Market Size | Gaps in Research Methodology |
|---|---|---|
| Mordor Intelligence | USD 427.49 B (2026) | |
| Trade Journal A | USD 48.60 B (2024) | This figure reflects office property transaction dollar volume in the United States for a single year, which is not comparable to a North America market value that captures leasing and broader transaction activity. |
| Industry Bulletin B | USD 507.84 B (2031) | The value is presented as a headline forecast and does not clearly state whether it is a direct market model output or a rounded restatement, and it also lacks detail on leasing annualization and adaptive reuse treatment. |
The spread mainly comes down to what is being measured, with some sources reporting traded deal volume or rounded forecast headlines, and others building a transaction-value market with explicit rent, occupancy, and pipeline inputs. By keeping the variables visible and re-checking them with interviews, the final number stays traceable to repeatable steps rather than a single proxy.


Key Questions Answered in the Report
What is the current North America office real estate market size?
The market is valued at about USD 427.49 billion in 2026 and is projected to reach USD 507.84 billion by 2031.
Which building grade leads leasing demand?
Grade A assets hold a 47.10% 2025 share and remain the prime target for occupiers seeking energy-efficient, amenity-rich space.
How significant is hybrid work in shaping demand?
Hybrid work models remain in use at 80% of firms, limiting average utilization to 38% of capacity and pressuring commodity offices.
Why are opportunistic investors active now?
Rate cuts and a USD 1.2 trillion refinancing wall have created discounted buying opportunities, with private-credit funds ready to deploy substantial capital.
Which geography is growing fastest?
Mexico is set to post a 4.32% CAGR through 2031 as nearshoring attracts record foreign direct investment and boosts office requirements.
What municipal policies affect office conversions?
Programs such as New York City’s 467-m tax incentive and Washington D.C.’s “Office to Anything” tax freeze are accelerating office-to-residential transformations to mitigate vacancy.
Page last updated on:






