
Market Overview
| Study Period | 2020 - 2031 |
|---|---|
| Forecast Data Period | 2026 - 2031 |
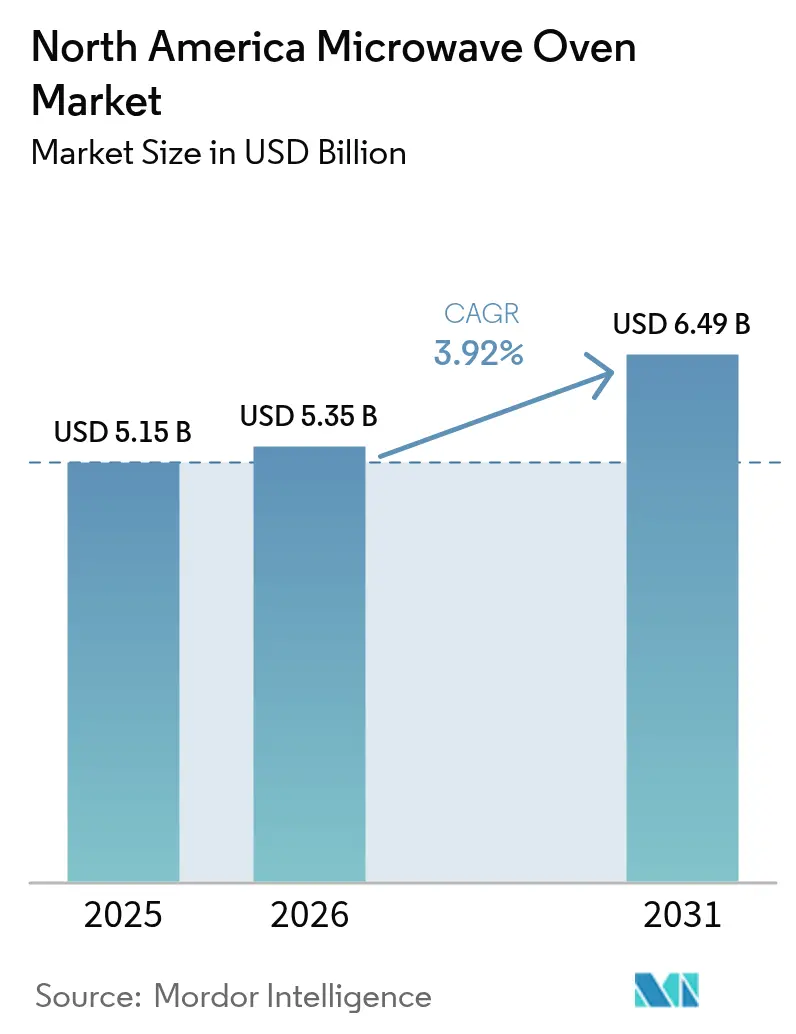
| Base Year Market Size (2025) | USD 5.15 Billion |
| Market Size (2026) | USD 5.35 Billion |
| Market Size (2031) | USD 6.49 Billion |
| Growth Rate (2026 - 2031) | 3.92 % |
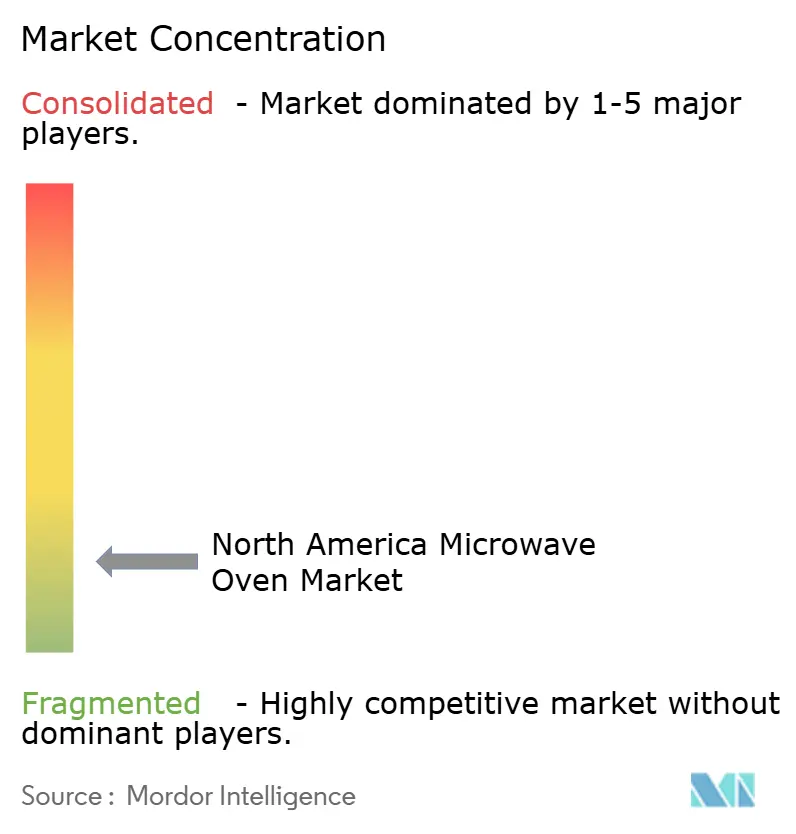
| Market Concentration | Low |
Major Players *Disclaimer: Major Players sorted in no particular order Image © Mordor Intelligence. Reuse requires attribution under CC BY 4.0. | |
North America Microwave Oven Market Analysis by Mordor Intelligence
The North America microwave oven market size was valued at USD 5.15 billion in 2025 and estimated to grow from USD 5.35 billion in 2026 to reach USD 6.49 billion by 2031, at a CAGR of 3.92% during the forecast period (2026-2031). Replacement purchases now outweigh first-time sales as households approach full penetration, yet upgrade appetite stays healthy thanks to multifunctional designs, smart connectivity, and stricter energy-efficiency rules. Premium built-in units benefit from renovation spending, while countertop models remain dominant in rental housing and smaller kitchens. Manufacturers are defending relevance against air-fryer ovens by integrating convection, grill, and air-fry modes inside a single cavity. Competitive rivalry has intensified as LG, Samsung, Whirlpool, and GE race to embed AI-driven cooking guidance, voice control, and IoT services that lift average selling prices while locking customers into proprietary ecosystems.
Key Report Takeaways
- By product, convection microwaves led with 51.30% revenue share in 2025, while grill variants are projected to expand at a 4.52% CAGR through 2031.
- By structure, countertop units held 64.55% of the North America microwave oven market share in 2025; built-in models are expected to grow at a 5.33% CAGR to 2031.
- By control feature, button interfaces captured 61.25% of the North America microwave oven market share in 2025 and are advancing at a 5.5% CAGR through 2031.
- By capacity, the 25-29 liter class held 35.60% of the North America microwave oven market size in 2025, while 30 liter-plus models are projected to expand at a 5.28% CAGR between 2026 and 2031
- By application, residential usage accounted for 69.20% of the North America microwave oven market size in 2025, while commercial demand is advancing at a 5.05% CAGR.
- By distribution channel, multi-brand stores captured 39.10% revenue in 2025; online sales are climbing at a 5.82% CAGR through 2031.
- By geography, the United States commanded 70.50% of the North America microwave oven market size in 2025, whereas Canada posts the fastest 5.12% CAGR to 2031.
Note: Market size and forecast figures in this report are generated using Mordor Intelligence’s proprietary estimation framework, updated with the latest available data and insights as of 2026.
Market Trends and Insights
Drivers Impact Analysis of North America Microwave Oven Market*
| Driver | (~) % Impact on CAGR Forecast | Geographic Relevance | Impact Timeline |
|---|---|---|---|
| Rising Disposable Income and Kitchen Renovations | +1.2% | United States and Canada | Medium term (2-4 years) |
| Growth of E-Commerce Appliance Sales | +0.8% | North America (strongest in Canada) | Short term (≤ 2 years) |
| Energy-Efficiency Regulations Driving Replacements | +0.9% | United States and Canada | Long term (≥ 4 years) |
| Dark-kitchen and Meal-Kit Expansion | +0.6% | Urban centers across North America | Medium term (2-4 years) |
| Aging-in-Place Demand for Easy-to-Use Appliances | +0.5% | United States and Canada suburban markets | Long term (≥ 4 years) |
| Source: Mordor Intelligence | |||
Rising Disposable Income & Kitchen Renovations
Kitchen upgrade budgets have increased, shortening replacement cycles for built-in microwaves as homeowners seek seamless cabinetry alignment and premium finishes. Flush-mount and drawer-style models, such as Whirlpool’s 1.1 cu ft turntable-free design launched at KBIS 2024, cater to this demand [1]. Higher-income households often replace an entire suite of cooking appliances during renovations, boosting cross-category sales. Smart connectivity and capacitive touch controls appeal to design-conscious buyers, lifting average selling prices. Mortgage rate volatility may briefly temper renovation outlays, yet pent-up remodeling projects continue to support medium-term growth.
Growth of E-Commerce Appliance Sales
Online channels are reshaping distribution economics. Direct-to-consumer storefronts allow manufacturers to upsell extended warranties and recipe subscriptions while harvesting first-party data. Canada shows the sharpest shift as long travel distances make click-to-deliver appliances attractive. Lower store overhead enables sharper pricing but elevates logistic costs for heavy built-in units requiring professional installation. The North America microwave oven market, therefore, sees hybrid fulfilment, where countertop models ship parcel while built-in units route through local installers.
Energy-Efficiency Regulations Driving Replacements
The U.S. Department of Energy finalized stricter standby-power limits for residential cooking products in January 2024, with compliance mandatory from January 31, 2028. Anticipation of costlier compliant models prompts early replacements of legacy units, lifting short-term volumes. Makers are switching to inverter power supplies and solid-state magnetrons to meet the sub-1-watt targets. The North America microwave oven market benefits from the rule’s signaling effect on household utility savings and greenhouse gas reduction.
Dark-Kitchen & Meal-Kit Expansion
Ghost kitchens and meal-kit assemblers require high-duty microwaves to finish dishes rapidly and consistently. Units above 1,200 watts now serve as essential line equipment. Five-to-seven-year commercial lifespans create predictable replacement rhythms that smooth manufacturer revenues. Price sensitivity caps feature proliferation, but programmable multi-stage cooking and durable stainless-steel interiors remain must-have specifications.
Restraints Impact Analysis of North America Microwave Oven Market*
| Restraint | (~) % Impact on CAGR Forecast | Geographic Relevance | Peak Impact |
|---|---|---|---|
| Household penetration near saturation | -1.8% | United States & Canada mature markets | Long term (≥ 4 years) |
| Health concerns over radiation & nutrient loss | -0.7% | Health-conscious segments across North America | Medium term (2-4 years) |
| Competitive pressure from countertop air-fryer ovens | -1.1% | United States & Canada urban markets | Short term (≤ 2 years) |
| Supply-chain volatility for magnetron components | -0.6% | Global, concentrated in North America, manufacturing | Medium term (2-4 years) |
| Source: Mordor Intelligence | |||
Household Penetration Near Saturation
Microwaves sit in more than 90% of North American kitchens, shifting demand toward later-cycle replacements rather than new installs. With proper maintenance and regular use, most microwaves have a lifespan of 7 to 10 years. However, premium models can extend that duration, lasting anywhere from 10 to 15 years, or even beyond. Brands counter by bundling convection, air-fry, and smart capabilities to tempt earlier trade-ins, but consumer price sensitivity constrains uptake. Consequently, producers pursue incremental revenues in commercial and export channels.
Health Concerns Over Radiation & Nutrient loss
Public scrutiny of 2.45 GHz exposure has risen after 2024 studies linked prolonged microwave radiation to cellular oxidative stress and cochlear changes. Although FDA leakage limits remain unchanged at 1 mW/cm² at 5 cm, perception issues influence purchase decisions among families with children [2]. Manufacturers now highlight reinforced door interlocks, PFAS-free interiors, and even-heat inverter technology to reassure buyers and protect brand trust.
*Our forecasts treat driver/restraint impacts as directional, not additive. The impact forecasts reflect baseline growth, mix effects, and variable interactions.
North America Microwave Oven Market Segment Analysis
By Product:
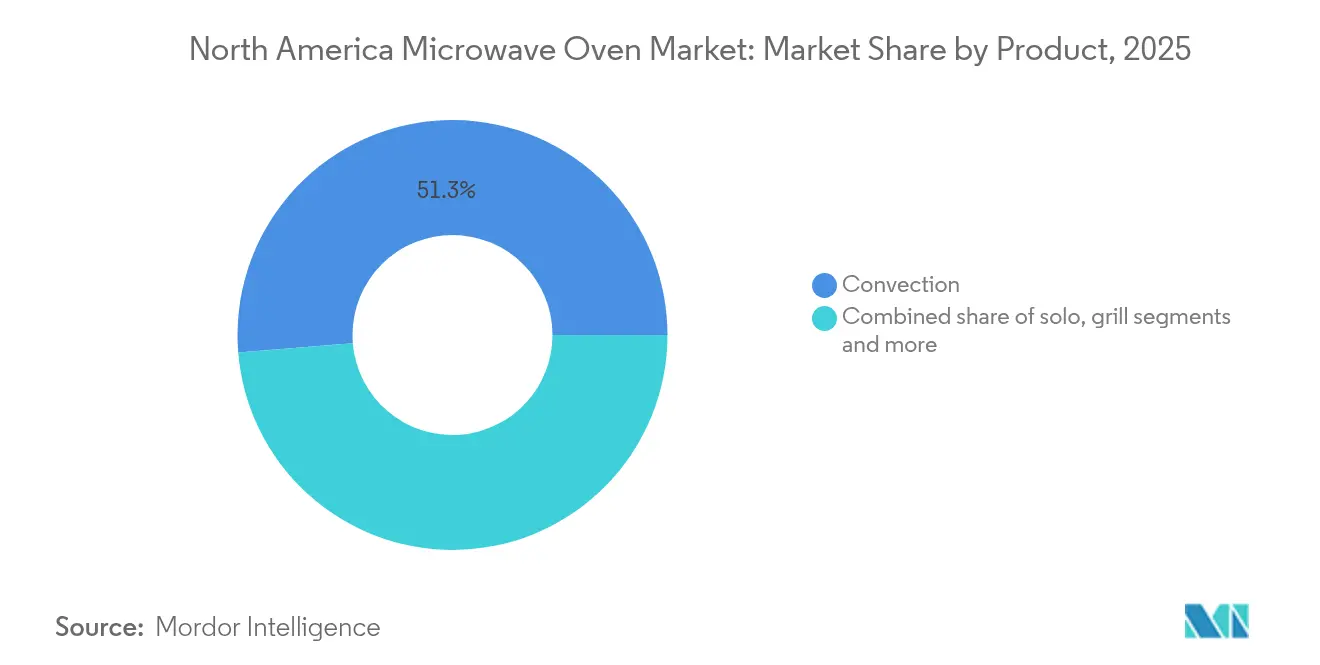
Convection Dominance Amid Grill InnovationConvection units captured 51.30% of the North America microwave oven market in 2025, reflecting consumer desire for browning and crisping that traditional solo models lack. Grill hybrids, though smaller in volume, are growing at 4.52% CAGR as they double as countertop air fryers. Panasonic’s HomeCHEF Connect 4-in-1, introduced in March 2025, epitomizes this trend with microwave, convection, air-fry, and broil modes. Manufacturers blur boundaries between quick reheating and primary cooking, reshaping competitive sets. Continued innovation in magnetron-free solid-state heating may unlock higher energy savings, further boosting the North America microwave oven market.
The product mix also mirrors evolving dietary habits. Health-focused users prefer grill or combi units that achieve crisp textures without deep-frying oil, while convenience-driven households stick with solo models for fast reheats. Premium drawer-style convection designs appeal to luxury renovations, even though they command a higher price. The drive toward multifunctionality positions microwaves as central rather than auxiliary appliances, sustaining replacement demand despite unit saturation.

By Structure:
Countertop Convenience Versus Built-in AestheticsCountertop models dominated with 64.55% share in 2025, bolstered by renters and urban dwellers who favor portability and lower up-front cost. Built-in formats, including flush-mount and drawer variants, are rising 5.33% annually as renovation projects prioritize cohesive sight lines and decluttered counters. Whirlpool’s flush-mount series demonstrates how slim trim kits deliver zero-gap installation without custom millwork. Over-the-range options straddle both segments by combining ventilation with microwave functionality.
The North America microwave oven market size for built-in units is projected to expand faster than overall demand, enabled by higher average selling prices and retailer attachment rates for professional installation. Yet countertop units still account for the bulk of e-commerce orders because parcel shippers can handle them without carpentry services. Space-efficient low-profile over-the-range models address smaller kitchens, while luxury drawer formats target premium cabinetry builds. Structural preference thus tracks housing tenure, household income, and renovation activity.
By Control Feature:
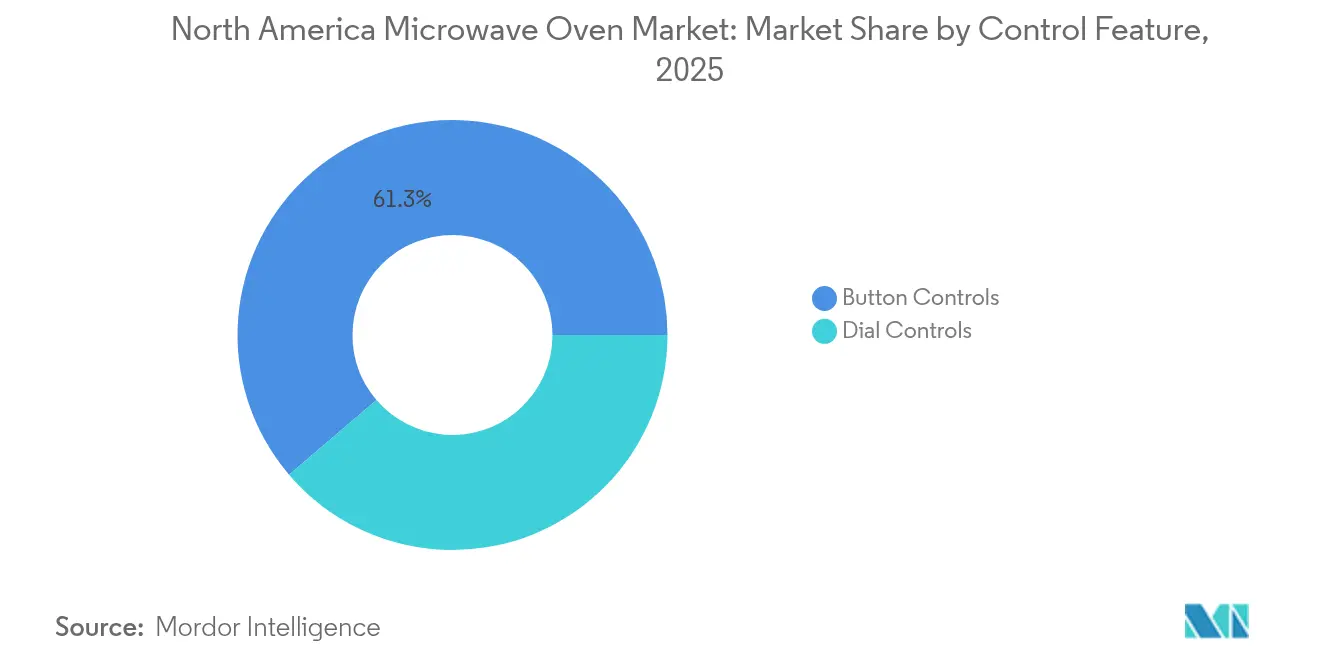
Button Interfaces Lead Digital TransitionButton interfaces, ranging from membrane pads to capacitive touch surfaces, represented 61.25% share in 2025 and are also the fastest-growing segment at 5.5% CAGR. The shift away from rotary dials reflects consumer familiarity with smartphone-like haptics and the need for complex multi-stage cooking programs. LG previewed a 27-inch LCD-touchscreen microwave in December 2024, underscoring the push toward large-format displays. Dial controls retain a niche among budget buyers and heavy-duty commercial installations that favor mechanical longevity.
Intuitive interfaces deliver tangible value for aging users who require legible fonts and simplified menus, supporting inclusive-design mandates. NFC and voice integration allow hands-free operation via smart-home speakers, while over-the-air firmware updates add new cooking presets long after purchase. Button control innovation therefore sustains differentiation as raw magnetron technology approaches commoditization, reinforcing brand ecosystems within the North America microwave oven market.
By Capacity:
Mid-Range Dominance with Large-Capacity GrowthOvens sized 25-29 liters led with 35.60% share in 2025, balancing footprint and volume for typical family meals. Units above 30 liters are expanding at 5.28% CAGR as more households batch-cook or substitute microwaves for conventional ovens to save energy. Commercial operators often specify 0.6 cu ft stainless chambers paired with 1,700–2,100 watts for maximum throughput across standard plate sizes. Conversely, units below 19 liters cater to dorms, break rooms, and tiny homes where counter space remains scarce.
The North America microwave oven market size for larger cavities benefits from consumer substitution of full-size ranges with multi-ovens capable of convection bake and air-fry. Shelf-ready refrigerated meals also come in larger trays that demand wider turntables or flatbed designs, nudging households toward bigger footprints. Energy codes encourage inverter power scales that adapt output to load weight, improving efficiency in larger chambers without sacrificing speed.
By Application:
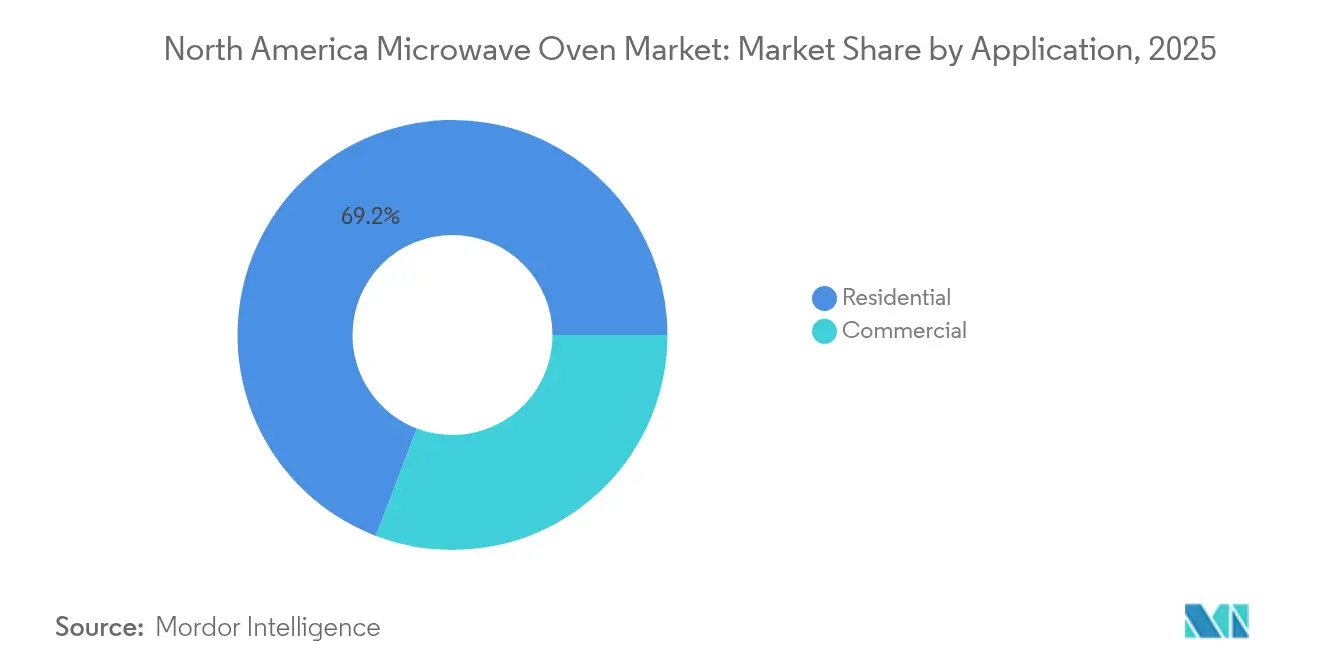
Residential Stability Amid Commercial AccelerationResidential buyers contributed 69.20% revenue in 2025, underpinning the mature core of the North America microwave oven market. Household demand now arises chiefly from technological refresh cycles rather than first ownership. Conversely, the commercial segment is gaining momentum at 5.05% CAGR, driven by food-delivery infrastructure, hospital cafeterias, and convenience stores that require reliable reheating at high duty factors. Panasonic’s NE-series 2,100-watt commercial models illustrate how ruggedized components and multi-stage programming command premium margins.
Commercial buyers evaluate the total cost of ownership, factoring service life, menu flexibility, and NSF sanitation compliance. Manufacturers responding with modular parts and field-diagnostic software win repeat contracts. Residential lines emphasize aesthetics, child-safety locks, and smartphone integration to keep pace with connected-kitchen expectations.
By Distribution Channel:
Online Growth Challenges Traditional RetailMulti-brand brick-and-mortar stores held a 39.10% share in 2025 but face sales cannibalization as pure-play online and manufacturer webshops post a 5.82% CAGR. Countertop models ship via standard parcel; built-ins still rely on showrooms and installer networks, preserving retail relevance. Manufacturers pursuing a dual path offer online exclusive colors or bundles to entice direct traffic. Canada leads the channel shift because remote communities lack large appliance outlets, making doorstep delivery compelling.
Financing, assembly, and haul-away services influence consumer channel choice. Online retailers partner with service aggregators to replicate in-store support, while physical stores deploy interactive displays and live cooking demos to showcase new features such as sensor-driven air fry. Channel convergence will likely stabilize as omnichannel logistics mature across the North America microwave oven market.
Geography Analysis
United States Microwave Oven Market
The United States constituted 70.50% of 2025 revenue thanks to its sizeable installed base, active renovation pipeline, and early adoption of smart appliances that command premium prices. Regulatory certainty from DOE standards also accelerates turnover as consumers pre-empt impending efficiency mandates. American dark-kitchen growth clusters around metropolitan hubs, reinforcing commercial demand and raising the North America microwave oven market density.
Canada Microwave Oven Market
Canada, while smaller, is the fastest-growing locale at 5.12% CAGR because new-household formation and provincial energy rebates encourage replacement of legacy units. E-commerce penetration surpasses U.S. levels, driven by vast geography and fewer big-box stores per capita. Provincial building codes that favor ENERGY STAR appliances further stimulate high-efficiency model sales, expanding the North America microwave oven market footprint north of the border.
Mexico Microwave Oven Market
Mexico remains the production workhorse of the region, leveraging nearshoring momentum that brought appliance investment from Whirlpool, Electrolux, Samsung, and Mabe. Domestic demand is smaller but rising alongside middle-class purchasing power. Currency volatility and tariff policy could affect local affordability, yet proximity advantages keep Mexico integral to continental supply resilience.
Regulatory Landscape
In the United States, microwave ovens fall under the federal energy framework administered by the U.S. Department of Energy (DOE) under 10 CFR Part 430, while the direction of energy requirements has been under review. On May 16, 2025, DOE published a proposed rule to rescind the federal energy conservation standards for microwave ovens, arguing they do not meet the statutory definition of a covered consumer product. Separately, safety compliance remains a gating requirement for market access, with ANSI/UL 923 (Microwave Cooking Appliances) incorporating a revision effective May 2, 2026, including a door-opening requirement that generally calls for two distinct actions to open the door unless specific design exceptions apply.
Across North America, manufacturers also navigate cross-border compliance and trade rules. Microwave ovens are commonly classified under HTS 8516.50.00 for tariff purposes, with duty treatment varying by country of origin and any applicable trade remedies (for example, additional U.S. measures beyond the base MFN rate). In Canada, Natural Resources Canada oversees federal energy-efficiency requirements, adding a further compliance layer for products sold domestically and reinforcing the need for region-specific certification, labeling, and documentation alongside U.S. safety and energy-rule developments.
Value Chain Analysis
The value chain starts with component and sub-assembly sourcing (high-voltage electronics, power supplies, cavities, doors, control boards, and magnetron-related parts), then moves to final assembly split between North American facilities and offshore production feeding imports. Regional manufacturing and assembly footprints include GE Appliances operations across multiple U.S. states and ACP, Inc. manufacturing in Cedar Rapids, Iowa, while a meaningful share of supply is supported by Asian manufacturing bases such as Guangdong Galanz Microwave that ship to North American importers and brand owners.
Downstream, products flow through importers, brand distribution arms, and specialized logistics providers into big-box retailers, multi-brand dealers, e-commerce fulfillment, and B2B channels (including foodservice dealers for light-commercial units). Port-to-warehouse handling and installer-enabled delivery are more relevant for heavier built-in and over-the-range formats, while countertop models tend to align with parcel-friendly e-commerce distribution. Compliance testing and certification, including UL 923 safety requirements and applicable DOE and NRCan energy rules, runs alongside manufacturing and influences product design choices, documentation, and the timing of model refreshes.
Competitive Landscape
Market leadership is fragmented. Whirlpool, LG Electronics, Samsung, and GE Appliances, each leveraging deep R&D, brand equity, and multi-channel distribution. GE’s IoT Breakthrough Award as 2025 “Smart Appliance Company of the Year” underscores the strategic shift toward connected features like CookCam AI that personalize cooking cycles. LG and Samsung integrate microwaves into wider smart-home ecosystems that bundle refrigerators and dishwashers, reinforcing lock-in.
Product differentiation pivots on design, connectivity, and multifunctionality rather than core microwave output. Sharp’s Celerity High-Speed Oven introduces inverter-assisted convection that roasts a chicken three times faster than a conventional oven, illustrating performance rivalry. Niche disruptors such as Brava exploit gaps with light-based rapid cookers targeting wellness-minded seniors. Established brands respond by adding non-toxic interiors and PFAS-free coatings to safeguard health credentials.
Price competition intensifies online, yet premium segments command higher margins thanks to flush-mount aesthetics and integrated recipe platforms. Warranty extensions and subscription-based cooking apps become new revenue layers.
North America Microwave Oven Industry Leaders
-
Whirlpool Corporation
-
LG Electronics Inc.
-
Samsung Electronics Co., Ltd.
-
GE Appliances (Haier)
-
Panasonic Corporation
- *Disclaimer: Major Players sorted in no particular order
North America Microwave Oven Market Companies Covered in this Report
- Whirlpool Corporation
- LG Electronics Inc.
- Samsung Electronics Co., Ltd.
- GE Appliances (Haier)
- Panasonic Corporation
- Bosch Home Appliances (BSH)
- Electrolux Group
- Sharp Corporation
- Midea Group
- Toshiba Corporation
- Breville Group Limited
- Daewoo Electronics
- Viking Range, LLC
- KitchenAid
- Wolf (Sub-Zero Group)
- ACP Inc. (Amana & Menumaster)
- Magic Chef (MC Appliance)
- Hamilton Beach Brands
- IFB Appliances
- Galanz Enterprises
Market Opportunities and Future Outlook
Regulatory divergence within North America creates room for manufacturers that can manage differentiated SKUs and messaging across the United States and Canada. Canada tightened standby-power requirements for microwave ovens effective June 22, 2026, including 0.6 watts for microwave-only/countertop convection and 1.0 watts for built-in/over-the-range convection. That shift supports premiumization around inverter power supplies, improved power management, and compliance-led replacement cycles. In the United States, DOE published a proposal on May 16, 2025 to rescind federal energy conservation standards for microwave ovens, and regardless of the final outcome, the proposal increases the value of voluntary efficiency positioning, retailer program alignment, and cross-border compliance planning for brands selling shared platforms across the region.
On the supply side, North American capacity and resilience initiatives support faster model turn cycles, selective localization of cooking-appliance production, and tighter integration with installer and service networks for built-in formats. GE Appliances announced a USD 3 billion, five-year plan in August 2025 to expand and modernize 11 U.S. manufacturing plants, and it completed a USD 180 million expansion at its LaFayette, Georgia cooking-appliance facility in June 2025. Alongside the category shift toward multifunction units (convection, grill, and air-fry features) and connected guidance, these moves support broader assortments and differentiated feature ladders across residential and light-commercial demand while household penetration remains high.
Recent Industry Developments in North America Microwave Oven Market
- July 2026: Samsung launched new slide-in ranges alongside an over-the-range microwave featuring Air Fry Max for the North American market. The release reinforces how major brands are defending microwave relevance versus standalone air-fryer ovens by integrating air-fry performance into over-the-range platforms that also deliver ventilation and space efficiency.
- December 2025: The US International Trade Commission instituted a Section 337 investigation into imported low-profile microwave-hood combination products following a complaint filed by Whirlpool. The proceeding increases uncertainty for affected import supply chains and can lead to product redesigns, sourcing shifts, or portfolio rebalancing among named brands during the investigation window.
- August 2025: GE Appliances announced a USD 3 billion, five-year investment plan to expand and modernize 11 U.S. manufacturing plants. The commitment supports greater domestic production flexibility for cooking appliances and improves regional supply reliability as manufacturers refresh product lines with more multifunction and connected features.
North America Microwave Oven Market Report Scope and Research Methodology
Market Definition and Coverage
For this study, the market covers the value of new microwave ovens sold across North America, including countertop and built-in units purchased for homes and light commercial settings, across offline and online sales channels.
Scope exclusions: We exclude industrial microwave drying or processing systems, laboratory microwave units, and aftermarket spare parts and services.
Segments Covered in This Report
- By Product
- Solo
- Grill
- Convection
- Other Products
- By Structure
- Countertop
- Built-in / Wall
- Over-the-Range
- By Control Feature
- Button Controls
- Dial Controls
- By Capacity
- Up to 19 litres
- 20 to 24 litres
- 25 to 29 litres
- 30 litres & above
- By Application
- Residential
- Commercial
- By Distribution Channel
- B2C/Retail
- Multi-brand Stores
- Exclusive Brand Outlets
- Online
- Other Distribution Channels
- B2B/Directly from the Manufacturers
- B2C/Retail
- By Geography
- Canada
- United States
- Mexico
Data Sources, Market Sizing, and Validation
Desk Research
Desk research was used to set the boundaries and build the first demand and pricing view for North America. We relied on public sources that help explain appliance demand and shipment flow, such as US Census Bureau and Statistics Canada retail sales releases, US International Trade Commission trade data, and energy efficiency materials from the US Department of Energy.
To tighten the model inputs, we also reviewed sources such as customs and tariff schedules, peer reviewed articles on household appliance adoption, and public filings and investor presentations from relevant appliance manufacturers and retailers. In a few places, paid subscriptions that consolidate company financials, news, and patent activity were used to cross check timelines and product positioning. These are illustrative examples, and many additional public sources were referenced to fill gaps, validate assumptions, and clarify definitions.
Primary Interviews and Surveys
Primary work focused on confirming what drives unit movement and pricing in the region, so we spoke with channel participants, appliance distributors, retailers, and product and category teams, along with repair and installation ecosystem contacts where relevant. Inputs were used to validate feature led price premiums, the split between built in and countertop demand, and how promotions and replacement cycles typically behave across the United States, Canada, and Mexico.
Distribution of primary research fieldwork respondents
| Company type | Respondent position |
|---|---|
| Top tier: 38% | CXOs: 17% |
| Mid tier: 43% | Functional/Unit leaders: 32% |
| Smaller Players: 19% | Managers: 51% |
Market-Sizing & Forecasting
Sizing starts with a top down build where appliance demand in North America is reconstructed using a mix of household base, housing activity, replacement behavior, and trade and shipment direction, and then translated into microwave oven value through calibrated pricing. To keep the result realistic, we also run selective bottom up checks using sampled average selling price bands by product type and channel, followed by supplier and retailer sense checks that help adjust the totals.
Key inputs that most affected the model included household formation and housing turnover, share of kitchens with built in placements versus countertop usage, import dependence by country, promotion intensity in mass retail and e-commerce, and price mix shifts tied to convection, inverter, and smart enabled models. Where direct unit signals were missing for a sub area, we bridged the gap using nearby country ratios and channel mix proxies that were agreed during interviews.
For forecasting, scenario analysis was used so that replacement led demand, feature driven ASP movement, and macro sensitivity could be tested together before a final base case was selected. Assumptions were then stress tested with interview feedback, particularly around expected premiumization pace and retailer discounting behavior over the forecast window.
Data Validation & Update Cycle
Validation is done in layers so the final output is not dependent on one data series. We compare the model totals against independent signals such as appliance import values, category sales trends, and housing related indicators, and then investigate any sharp variances before sign off.
An analyst review is completed in multiple steps, where inputs, calculations, and implied growth rates are checked for logic and consistency across the United States, Canada, and Mexico. Reports are refreshed annually, and if a material change occurs (policy, trade shifts, or demand shocks), we trigger an interim update and re contact selected experts. Before delivery, a fresh review pass is completed so clients receive the latest updated view.
Mordor Intelligence's North America Microwave Oven Market Size Compared Against Other Published Estimates
It is common to see different market sizes for microwave ovens because each publisher draws the line around what counts as a microwave oven sale and what does not. Differences also come from how pricing is treated, whether forecasts assume heavy premiumization, and how often the underlying assumptions are updated.
By tracking unit demand signals, channel mix, and ASP movement, and then rechecking scope boundaries, Mordor Intelligence keeps the estimate tied to new residential and light commercial oven sales in the United States, Canada, and Mexico, while some estimates blend in adjacent small appliances, services, or use ex factory revenue without retail margins.
Benchmark comparison
| Source | Market Size | Gaps in Research Methodology |
|---|---|---|
| Mordor Intelligence | USD 5.15 B (2025) | |
| Regional Consultancy A | USD 4.86 B (2025) | Often anchored on a narrower retail sample and pricing that underweights built-in and convection models, which can pull down the value estimate in premium heavy years. |
| Trade Journal B | USD 5.32 B (2024) | Commonly built from shipment value with simplified retail markups and limited country level calibration, which can miss mix shifts between the United States, Canada, and Mexico. |
The spread in the table mainly comes from what revenue level is counted and how pricing is carried forward year to year. Our approach stays transparent because the total is explained through a small set of repeatable drivers, namely demand pool, country coverage, channel mix, and price mix, which are then checked and adjusted using market interviews.
Key Questions Answered in the Report
What is the current value of the North America microwave oven market?
It is USD 5.35 billion in 2026 and is forecast to reach USD 6.49 billion by 2031.
How fast is the market growing?
The market is expected to expand at a 3.92% CAGR between 2026 and 2031.
Which product type holds the largest share today?
Convection microwaves lead with 51.30% of regional revenue.
Why are built-in models gaining traction?
Kitchen renovations and flush-mount designs are driving built-in units to grow 5.33% annually.
What is the biggest restraint on future unit growth?
Household penetration above 90% in the United States and Canada shifts demand to slower, replacement-only cycles.