
Market Overview
| Study Period | 2020 - 2031 |
|---|---|
| Forecast Data Period | 2026 - 2031 |
| Historical Data Period | 2020 - 2024 |
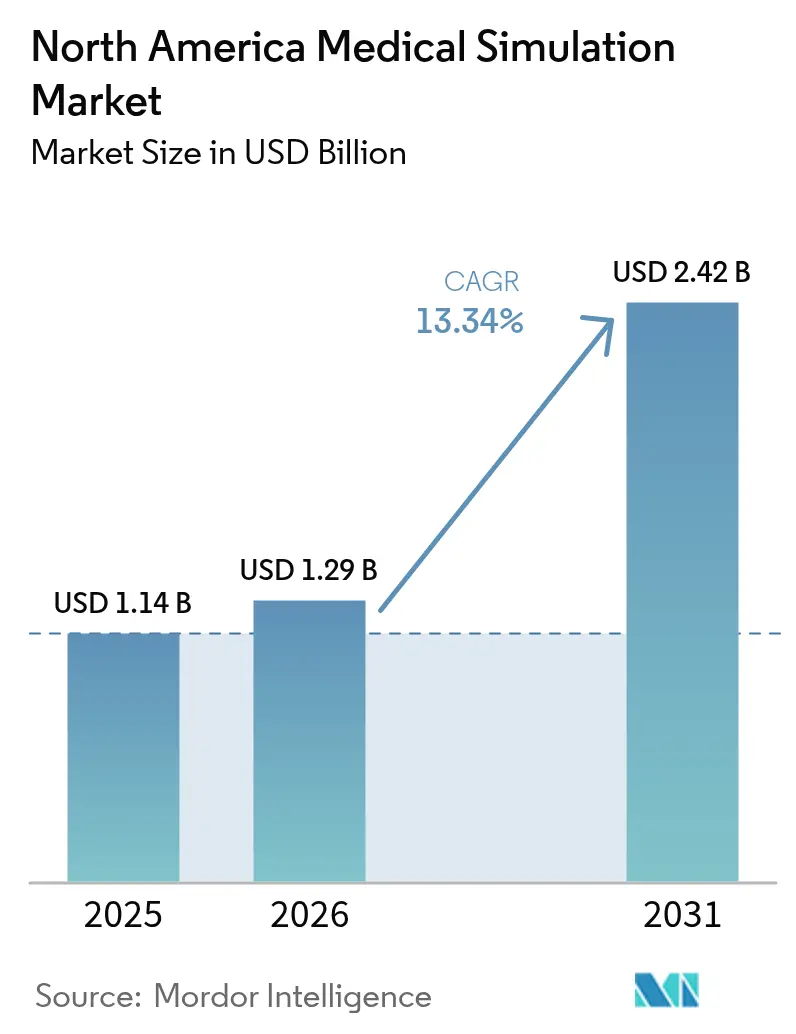
| Base Year Market Size (2025) | USD 1.14 Billion |
| Market Size (2026) | USD 1.29 Billion |
| Market Size (2031) | USD 2.42 Billion |
| Growth Rate (2026 - 2031) | 13.34 % |
Major Players *Disclaimer: Major Players sorted in no particular order Image © Mordor Intelligence. Reuse requires attribution under CC BY 4.0. | |
North America Medical Simulation Market Analysis by Mordor Intelligence
North American medical simulation market size in 2026 is estimated at USD 1.29 billion, growing from 2025 value of USD 1.14 billion with 2031 projections showing USD 2.42 billion, growing at 13.34% CAGR over 2026-2031. This headline figure represents the current medical simulation market size and highlights the brisk growth trajectory being fueled by faculty shortages, patient-safety mandates, and rapid advances in extended-reality hardware. Demand pressure is strongest where medical schools face limited clerkship slots, regulatory bodies insist on measurable competency proof, and virtual-reality head-mounted displays finally deliver clinical-grade visual fidelity. As a result, the medical simulation market is shifting from discretionary spending toward critical infrastructure investment as educators and hospitals chase scalable, repeatable, and data-rich training models. Regulatory emphasis on computational modeling in FDA submissions, rising adoption of AI-driven adaptive analytics, and cost-effective service contracting all reinforce the market’s growth momentum.
Key Report Takeaways
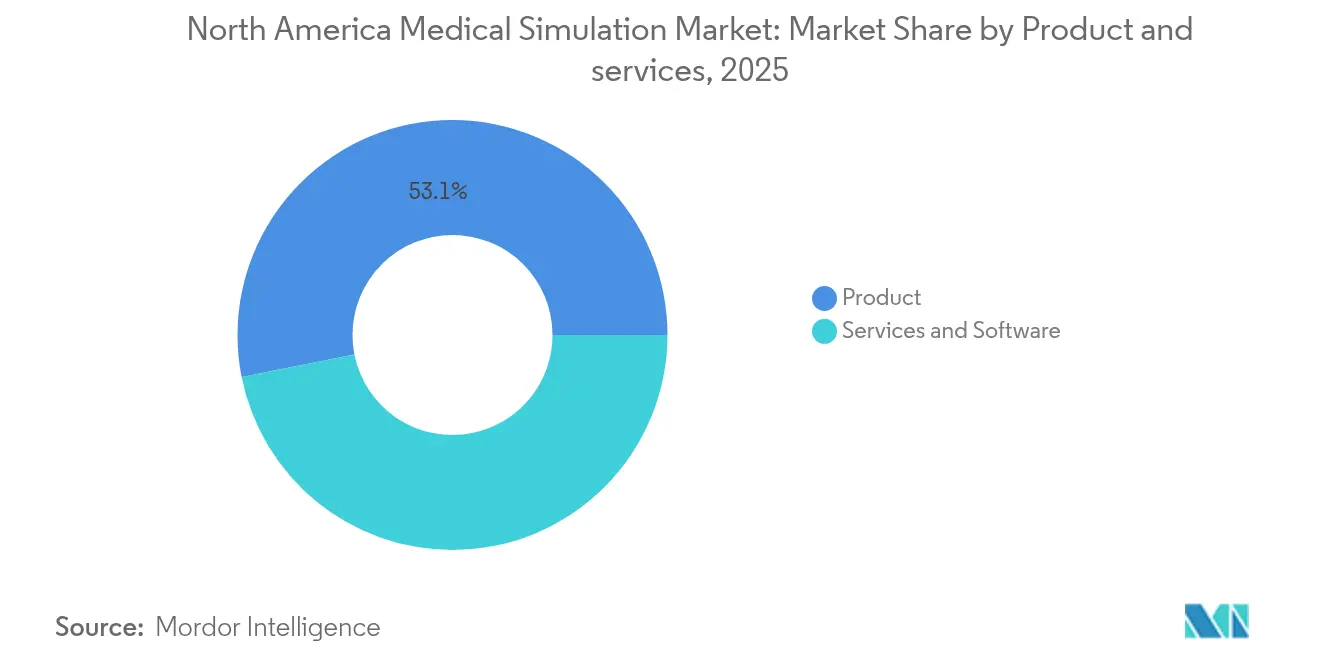
- By products and services, products led with a 53.12% revenue share in 2025; services are expanding at a 13.41% CAGR through 2031.
- By fidelity, low-fidelity systems captured 46.92% of medical simulation market share in 2025, while high-fidelity platforms are projected to grow at 13.68% CAGR to 2031.
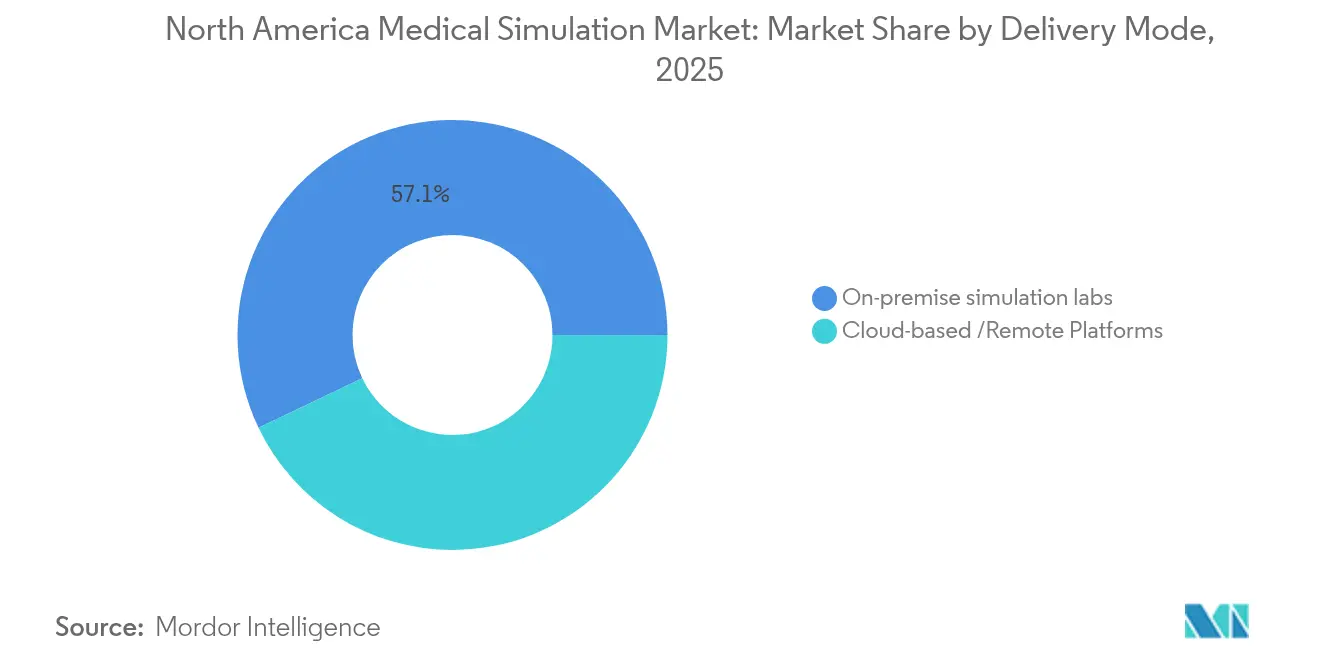
- By delivery mode, on-premise simulation labs accounted for 57.10% of the medical simulation market size in 2025 and cloud-based solutions are advancing at a 14.05% CAGR through 2031.
- By end user, academic and research institutes held 50.20% of revenue in 2025; hospitals and surgical centers are forecast to post the highest CAGR at 14.27% through 2031.
Note: Market size and forecast figures in this report are generated using Mordor Intelligence’s proprietary estimation framework, updated with the latest available data and insights as of 2026.
North America Medical Simulation Market Trends and Insights
Drivers Impact Analysis*
| Driver | (~) % Impact on CAGR Forecast | Geographic Relevance | Impact Timeline |
|---|---|---|---|
| Demand for minimally-invasive-procedure training | +2.8% | North America & EU, expanding to APAC | Medium term (2-4 years) |
| Rising focus on patient-safety & error-reduction mandates | +2.1% | Global, with strongest enforcement in North America | Short term (≤ 2 years) |
| Adoption of VR/AR hardware breakthroughs in simulators | +1.9% | North America core, spill-over to developed markets | Medium term (2-4 years) |
| Shortage of clinical faculty driving simulation hours | +2.3% | North America & EU primarily | Long term (≥ 4 years) |
| AI-driven adaptive simulation analytics | +1.2% | North America tech hubs, selective global adoption | Long term (≥ 4 years) |
| ESG-linked "zero-harm" corporate training targets | +0.8% | North America & EU corporate healthcare systems | Medium term (2-4 years) |
| Source: Mordor Intelligence | |||
Demand for Minimally-Invasive-Procedure Training
Laparoscopic, robotic, and endoscopic techniques demand psychomotor skills that traditional apprenticeship models cannot deliver at scale. Affordable robotic-surgery interfaces priced near USD 8,400 have widened access to advanced skills practice for resource-constrained schools. Haptic-enabled virtual reality fosters muscle memory and boosts procedural confidence before trainees enter live theaters, and programs using these tools record significant declines in intra-operative error rates. Growth of robotic platforms to offset surgeon shortages further cements simulation as a frontline training modality. The driver adds 2.8 percentage points to forecast CAGR as curricula embed high-repetition, risk-free practice sessions into core learning.
Rising Focus on Patient-Safety & Error-Reduction Mandates
Simulation-based catheter insertion curricula cut 9.95 bloodstream infections per facility each year, saving more than USD 700,000 and delivering a seven-to-one ROI. Such proof reframes simulation from educational overhead to financial imperative. Accrediting bodies like the Joint Commission now require documented competency metrics, which simulation uniquely provides through standardized scenarios and automated scoring. Hospitals leverage these metrics to satisfy value-based reimbursement schemes, shrinking malpractice exposure while elevating care quality.
Adoption of VR/AR Hardware Breakthroughs in Simulators
Apple’s Vision Pro enables mixed-reality overlays that blend virtual patients and real clinical tools, marking a watershed moment for immersive training. Higher-resolution screens, lower latency, and enhanced haptics remove prior fidelity barriers and dampen cybersickness incidence. Collaborations such as GE HealthCare’s alliance with NVIDIA illustrate how AI-enhanced imaging is embedding into simulators to reproduce true-to-life disease variants. The resulting uptick in device purchases and software licensing directly lifts the medical simulation market.
Shortage of Clinical Faculty Driving Simulation Hours
Eighty-four percent of deans cite clerkship shortages, forcing schools to raise simulation quotas. Modern centers let one instructor oversee multiple learners via adaptive scenarios and analytics dashboards, multiplying teaching reach. The COVID-19 disruption validated simulation’s role as curricular backbone rather than ancillary tool. Long-term faculty gaps therefore sustain elevated demand well beyond pandemic pressures.
Restraints Impact Analysis*
| Restraint | (~) % Impact on CAGR Forecast | Geographic Relevance | Impact Timeline |
|---|---|---|---|
| High upfront capital & maintenance cost of high-fidelity units | -1.8% | Global, particularly affecting smaller institutions | Short term (≤ 2 years) |
| Lack of interoperability standards across simulation platforms | -1.2% | North America & EU primarily | Medium term (2-4 years) |
| Limited faculty training & change-management bandwidth | -0.9% | Global, with varying intensity by region | Long term (≥ 4 years) |
| VR-induced cybersickness impacting learner acceptance | -0.7% | Global, with higher impact in VR-intensive programs | Medium term (2-4 years) |
| Source: Mordor Intelligence | |||
High Upfront Capital & Maintenance Cost of High-Fidelity Units
Premium patient simulators frequently exceed USD 100,000 per unit, with lifecycle support costs often matching the original purchase price. Community hospitals and small colleges struggle to clear such hurdles when competing priorities include core equipment and staff salaries. Shared regional centers and simulation-as-a-service contracts partially offset the capital pain, but budget sign-offs remain a gating factor and subtract 1.8 percentage points from forecast CAGR.
VR-Induced Cybersickness Impacting Learner Acceptance
Nausea, dizziness, and visual discomfort still affect 45% of VR learners, undermining satisfaction and limiting session lengths. Studies show pre-exposure routines cut nausea by 47% and oculomotor strain by 34%, yet widespread implementation lags. As hardware latency improves and design guidelines mature, the restraint’s impact is expected to fade, but in the near term it trims 0.7 percentage points from overall growth.
*Our forecasts treat driver/restraint impacts as directional, not additive. The impact forecasts reflect baseline growth, mix effects, and variable interactions.
Segment Analysis
By Products & Services: Services Accelerate Despite Product Dominance
Products commanded 53.12% of 2025 revenue as the physical backbone of academic and hospital labs. Within that total, interventional and surgical simulators remain the cornerstone, supplemented by task trainers and physiologic manikins. Yet the services category is expanding at a 13.41% CAGR, propelled by institutions favoring turnkey subscriptions over capital outlay. Cloud licensing, curriculum design, and managed-lab services convert episodic purchases into predictable operating budgets, a pivotal shift for the medical simulation market.
Interventional simulator demand mirrors the growth of robotic and laparoscopic procedures, while patient simulators evolve toward wireless, physiology-rich models that integrate with real monitoring devices. Services momentum is most evident in SaaS ultrasound platforms such as 3B Scientific’s e Sono, which illustrates how pay-as-you-go access democratizes advanced training. As recurring revenue rises, the medical simulation industry expands its addressable audience to smaller institutions once priced out of the high-fidelity hardware segment.

By Fidelity: High-Fidelity Solutions Gain Momentum
Low-fidelity tools hold 46.92% of 2025 spend thanks to affordability and quick deployment. Nevertheless, high-fidelity simulators are logging a 13.68% CAGR as empirical studies tie realism to measurable learning gains. The high-fidelity cohort now includes manikins like Gaumard’s HAL S3201 with dynamic lung compliance and drug recognition, bridging the gap between simulation suites and real ICU beds. Institutions justify higher outlays by quantifying error-reduction savings, thereby growing this share of the medical simulation market size.
Medium-fidelity systems remain important for core skills drills, but advanced programs are fast-tracking toward high-immersion experiences that synchronize vitals, imaging, and electronic records. That migration signals a long-run pivot of procurement budgets toward ultra-realism that better prepares clinicians for increasingly complex patient populations.
By Delivery Mode: Cloud Platforms Transform Access Models
On-premise labs still produce 57.10% of 2025 expenditure, yet cloud-delivered content is rising at a 14.05% CAGR. Pandemic disruptions showcased how web-native portals keep curricula uninterrupted, and cloud hosting now underpins adaptive analytics, cohort benchmarking, and cross-campus content sharing. The Scientific World Journal describes architectures like Usalpharma that let quality-assurance trainees access virtual-world exercises from any device, erasing geography as a limiting factor.
Scalability also spares institutions from perpetual hardware refresh cycles, making cloud adoption a central storyline in the medical simulation market. Vendors respond with subscription bundles that package content, analytics, and support into single per-user fees, turning capital planning into operating-expense forecasting.
By End User: Hospitals Accelerate Training Internalization
Academic and research institutes controlled 50.20% of 2025 revenue, reflecting long-standing reliance on simulation for undergraduate and postgraduate programs. Hospitals and surgical centers, however, are growing at 14.27% CAGR as staffing shortages and quality mandates force bedside-level upskilling. Integrated delivery networks embed simulation labs near critical-care units so clinicians can cycle through micro-learning sessions between shifts, weaving practice into daily routines.
Military and defense organizations leverage hyper-realistic casualty models and AI-enhanced incident documentation tools like AutoDoc, underscoring the field’s importance for combat readiness. Device and pharmaceutical firms employ simulation to fast-track product adoption and investigator training, adding further volume to the medical simulation market.
Geography Analysis
The United States remains the engine of regional demand, supported by more than 150 medical schools, extensive residency structures, and federal funding streams. Joint Commission accreditation rules and Veterans Affairs adoption of 40+ VR applications both reinforce simulation’s regulatory anchor. Canada contributes meaningful incremental growth as provincial systems deploy simulation to serve dispersed populations, while Mexico’s private hospitals and medical-tourism hubs adopt high-fidelity suites to attract global patients.
Spill-over effects include cross-border faculty exchanges and shared simulation centers in metropolitan corridors spanning international boundaries. These patterns widen the customer base and lift the overall medical simulation market
Regulatory Landscape
In the United States, the FDA has increased the compliance bar for simulation software and computational modeling used alongside medical devices. A major anchor is the FDA Quality Management System Regulation (QMSR) final rule published in February 2024, which harmonizes 21 CFR Part 820 with ISO 13485:2016, and increases the emphasis on design controls, validation, and documented quality processes across hardware simulators and regulated software components.
FDA oversight also directly affects simulation and modeling tools used in submissions, supported by final guidance on assessing credibility of computational modeling and simulation in medical device submissions. The guidance uses a risk-informed credibility approach and references the ASME V&V 40 framework. In Canada, Health Canada tightened submission and evidence processes: effective April 1, 2026, manufacturers must use the Regulatory Enrolment Process and the Common Electronic Submission Gateway (CESG) for regulatory submissions, alongside updated guidance on clinical evidence requirements for Class II, III, and IV medical devices. These shifts increase the operational need for validated datasets, auditable training content, and submission-ready documentation across North America.
Value Chain Analysis
The medical simulation value chain in North America spans component and content inputs (medical-grade polymers for manikins, embedded sensors, haptics, imaging content, and scenario libraries), product engineering and manufacturing (patient simulators, task trainers, interventional and ultrasound simulators, and associated software), and integration into delivery modes (on-premise labs and cloud-based platforms). Established vendors such as CAE (including Elevate Healthcare), Laerdal Medical, Gaumard Scientific, and 3D Systems operate alongside VR-first platform developers such as SimX, with growing emphasis on bundling hardware, software licenses, and services into turnkey programs.
Downstream, distribution and commercialization partnerships shape access to hospital and academic procurement channels. PRESTAN partnering with Nasco Healthcare for broader distribution (October 2024) and Eurosets entering an exclusive US distribution partnership with Detroit-based Orion Medical tied to US commercialization (March 2026) reinforce how channel partners influence buying cycles. Systems integration is a key value-added layer as institutions connect manikins, VR modules, learning management systems, and analytics dashboards; the Elevate Healthcare and SimX partnership (April 2025) highlights how vendors use alliances to reduce deployment friction and expand account penetration without building all capabilities in-house.
Competitive Landscape
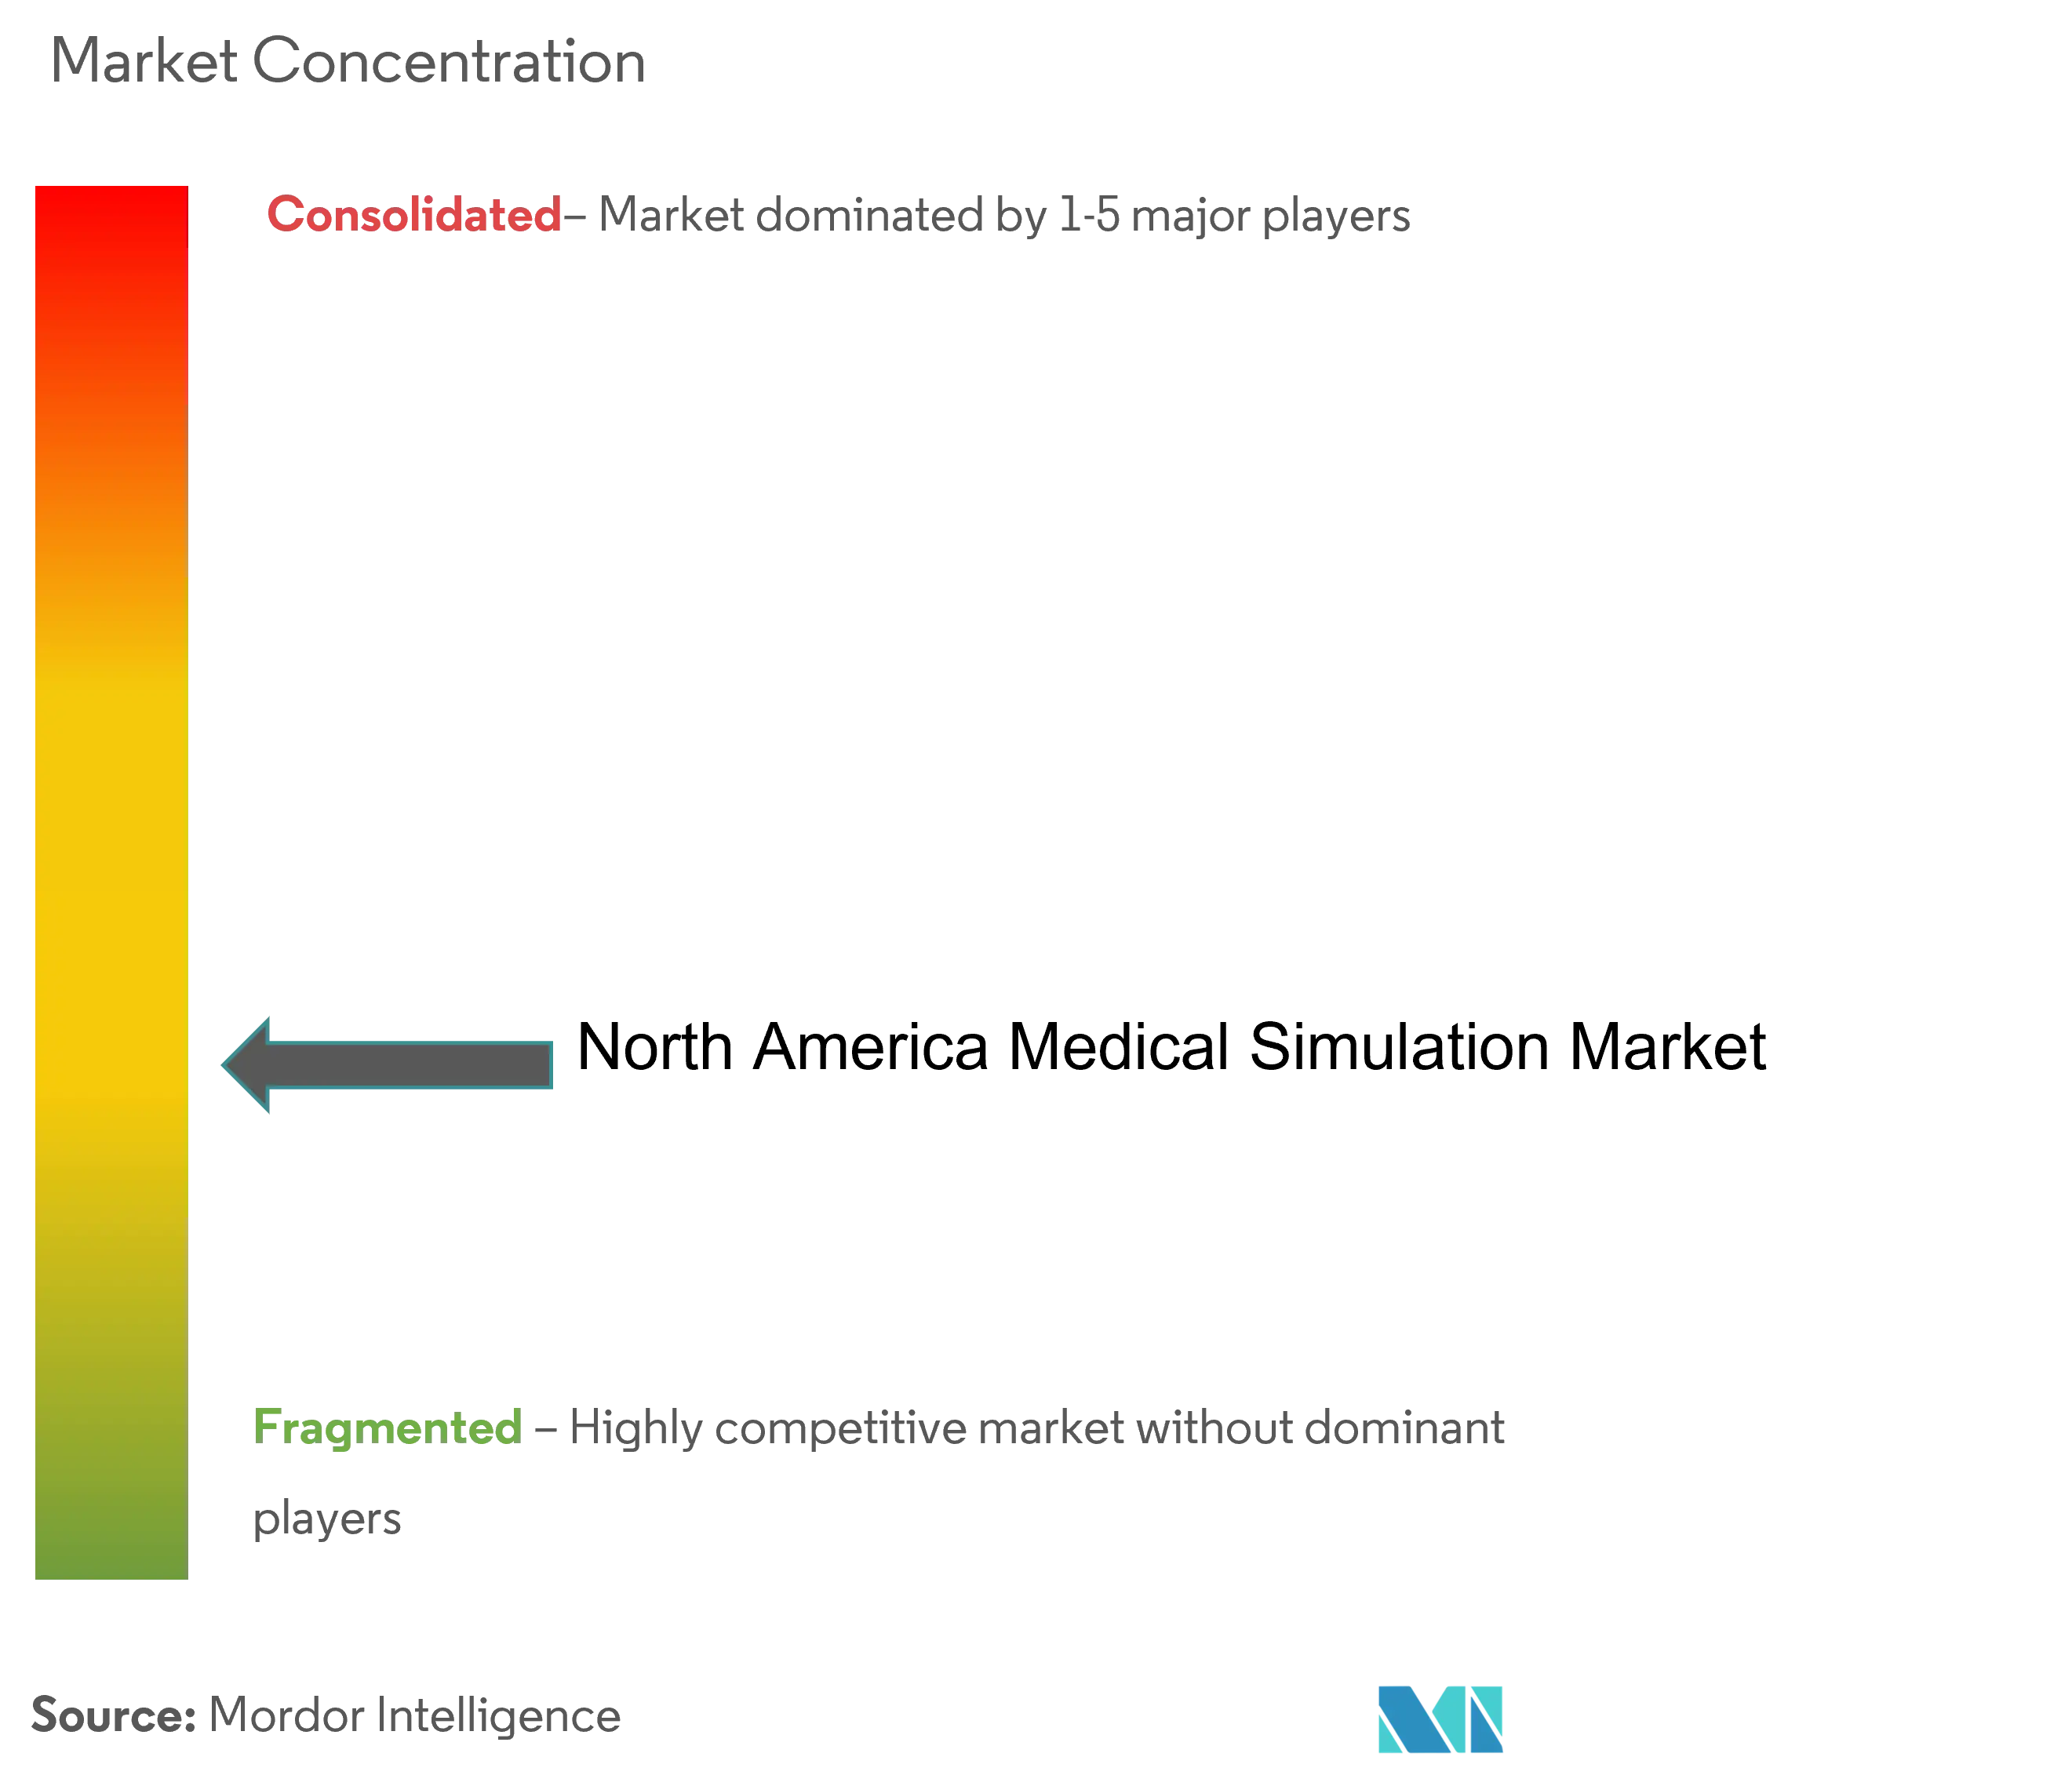
Incumbents like CAE Healthcare recently changed ownership as part of Madison Industries’ CAD 311 million acquisition, highlighting a market in realignment. Partnerships—GigXR linking with CAE, GE HealthCare purchasing Intelligent Ultrasound’s AI assets, and Laerdal aligning with the American Hospital Association—signal a shift toward solution ecosystems rather than isolated products. Cloud-native and VR-first entrants challenge hardware heavyweights on agility and price, while established vendors answer with service bundles and AI integration. The market therefore balances fragmentation with consolidation impulses, generating competitive churn that stimulates product innovation without allowing any single firm to dominate the medical simulation market.
North America Medical Simulation Industry Leaders
-
3D Systems
-
Canadian Aviation Electronics (CAE) Inc.
-
Gaumard Scientific
-
Kyoto Kagaku Co. Ltd
-
Laerdal Medical
- *Disclaimer: Major Players sorted in no particular order
Market Opportunities and Future Outlook
A visible opportunity is capacity build-out of simulation facilities by universities, community colleges, and hospital systems, aimed at training throughput constraints and workforce gaps. Recent anchors include the $75 million Knox Regional Health Science Education and Simulation Center opening in Knoxville, Tennessee (April 2026), Western Governors University opening the 15,000-square-foot DeLuca WGU Clinical Learning and Simulation Center in Orlando, Florida (January 2026), and HCA Healthcare unveiling the 6,000-square-foot HCA Healthcare Center for Clinical Advancement in Roanoke, Virginia (July 2026) to train more than 900 nurses. These projects expand demand for manikins, task trainers, interventional simulators, AV capture, and managed services that keep labs operational and curricula updated.
A second opportunity is scaling simulation delivery with VR and AI to reduce dependency on scarce instructors and physical space. The University of Alberta completed a VR pilot training nearly 900 nursing students (June 2026) and cited plans to expand equipment and room capacity, while SimX introduced an AI assistant within its VR platform (July 2026) to automate patient and multi-character interactions under educator control. On the standardization side, institutions pursuing Society for Simulation in Healthcare accreditation, such as the University of Texas at Arlington Smart Hospital receiving international accreditation (July 2026), create demand for performance measurement, competency documentation, and interoperable reporting across platforms, aligning with the market shift toward data-rich, auditable training.
Recent Industry Developments
- July 2026: SimX launched an AI-powered assistant within its VR simulation platform to automate patient and multi-character interactions while keeping educators in control. The release targets scaling constraints in simulation programs by enabling more scenario throughput without matching increases in instructor time. The move also reinforces the shift toward software-led differentiation and subscription-driven expansion in immersive training.
- December 2025: 3D Systems received US FDA 510(k) clearance expanding VSP Orthopedics indications to include skeletally mature adolescents. The clearance broadens the addressable clinical planning and training use cases for its virtual surgical planning and patient-specific instrumentation workflows. It also strengthens the company's regulated footprint, which can influence adoption by institutions that align training tools with cleared clinical pathways.
- September 2024: 3D Systems received US FDA 510(k) clearance for TOTAL ANKLE patient-matched guides for use with Smith+Nephew SALTO TALARIS and CADENCE total ankle systems. The approval supports wider deployment of patient-specific guides tied to digital planning workflows, which can be integrated into surgical education and preoperative rehearsal. It adds momentum to regulated, procedure-specific simulation and planning offerings linked to orthopedic care pathways.
Research Methodology Framework and Report Scope
Market Definition and Coverage
This market covers revenue generated from medical simulation solutions used to train and assess healthcare learners and professionals in North America, including simulation hardware, simulation software, and related training services used in academic and clinical settings.
Scope exclusions: It excludes general medical education content that is not simulation-based and any broader hospital IT spend not directly tied to simulation training outcomes.
Segmentation Overview
- By Products & Services
- Products
- Interventional/Surgical Simulators
- Laparoscopic
- Robotic & Endoscopic
- Orthopaedic
- Patient Simulators
- Task Trainers
- Other Products
- Interventional/Surgical Simulators
- Services & Software
- Web-based Simulation
- Simulation Software Licences
- Training & Consulting Services
- Products
- By Fidelity
- High-fidelity
- Medium-fidelity
- Low-fidelity
- By End User
- Academic & Research Institutes
- Hospitals & Surgical Centres
- Military & Defence Organisations
- Medical-device & Pharma Companies
- By Delivery Mode
- On-premise Simulation Labs
- Cloud-based /Remote Platforms
- By Country
- United States
- Canada
- Mexico
Data Sources, Market Sizing, and Validation
Desk Research
Desk research was used to set the structure for the market model and to anchor basic demand signals that can be checked year to year. We referenced public sources such as the US FDA device databases for relevant simulation products, the US Bureau of Labor Statistics for healthcare workforce trends, Centers for Medicare and Medicaid Services spending context, and education and accreditation materials published by healthcare and nursing associations.
Along with these, company annual reports, investor presentations, press releases, and conference proceedings were reviewed to track product launches, the direction of pricing, and where adoption is moving, for example from classroom labs to remote and cloud-supported simulation. Patent databases and a paid subscription for company financials and news were used selectively to validate ownership changes and to reduce the risk of missed revenue when reporting lines shift. This list is not exhaustive, and many other sources were also used to collect, cross-check, and clarify data points.
Primary Interviews and Surveys
Primary work focused on cross-checking adoption and budgeting realities across the United States, Canada, and Mexico, since procurement cycles and training standards differ by country. We spoke with a mix of simulation lab leaders, clinical educators, procurement and training managers, and product-side experts to pressure test assumptions such as typical replacement cycles, utilization levels, and the split of spend between software and services versus equipment.
Distribution of primary research fieldwork respondents
| Company type | Respondent position |
|---|---|
| Top tier: 36% | CXOs: 16% |
| Mid tier: 47% | Functional/Unit leaders: 27% |
| Smaller Players: 17% | Managers: 57% |
Market-Sizing & Forecasting
Sizing started with a top-down build where education and training demand pools were reconstructed using healthcare staffing and training throughput signals, and then translated into simulation spending using penetration and replacement assumptions. To keep the totals realistic, the outputs were corroborated with selective bottom-up checks, such as sampled average selling prices for key simulator categories multiplied by estimated unit volumes, followed by channel and end-user checks to adjust outliers.
The inputs that carried the most weight were the number of training seats and program capacity in medical and nursing education, hospital training intensity tied to patient safety, installed base replacement cycles for physical simulators and task trainers, the mix shift toward VR and software-enabled learning, and typical service and maintenance attach rates. Forecasts were built using scenario analysis linked to these drivers, and the final path was selected after validating direction and magnitude with expert views on budgets, accreditation pressure, and technology adoption. Where bottom-up visibility was weaker, for example on smaller institutional purchases, gaps were handled using conservative penetration bands that were re-tested in interviews before finalizing.
Data Validation & Update Cycle
Outputs were validated through triangulation across multiple checks, including consistency with training demand indicators, realistic pricing ranges, and year-over-year growth patterns observed in public filings and procurement signals. Variances were flagged and reworked through analyst reviews, and follow-up calls were triggered when a major assumption changed, such as a shift in delivery model or a material change in replacement timing.
The report is refreshed annually, and interim updates are made when material events occur, such as large policy moves, major technology shifts, or notable corporate actions that can change reported revenue lines. Before delivery, a final analyst pass is completed so clients receive the most current view available at that time.
Mordor Intelligence's North America Medical Simulation Market Market Size Measured Against Other Published Estimates
Published market values for medical simulation in North America can look far apart, even when the same end users are being discussed, because the counting rules and timing are not aligned. Differences usually show up in what gets included as simulation revenue, whether services are counted in full, and which year is treated as the anchor for prices and currency.
The main gap comes from whether training services and recurring software are counted alongside equipment. Mordor Intelligence counts simulation software and training services only when they are directly tied to simulation programs rather than being bundled into broader education spend.
Benchmark comparison
| Source | Market Size | Gaps in Research Methodology |
|---|---|---|
| Mordor Intelligence | USD 1.14 B (2025) | |
| Industry Publisher A | USD 1.12 B (2024) | Uses a different base year and mixes regional growth claims with broad segment coverage, which can shift the modeled price level and adoption timing versus a 2025 anchored build. |
| Industry Publisher B | USD 0.75 B (2025) | Often applies a narrower scope that emphasizes core simulation solutions and may exclude certain services or higher-fidelity categories, which reduces the counted revenue pool for the same year. |
The spread in the table is mainly explained by scope choice and year anchoring, rather than a single demand signal moving in opposite directions. By keeping inclusions tied to simulation-specific spending and then cross-checking totals with practical pricing and utilization inputs, the estimate stays traceable to clear steps that can be repeated when assumptions are updated.
Key Questions Answered in the Report
How fast are cloud platforms expanding in the medical simulation market?
Cloud delivery is rising at a 14.05% CAGR as institutions value lower capital burden and pandemic-validated remote access.
What is the typical return on investment for high-fidelity simulation?
A simulation program preventing catheter infections saved over USD 700,000 annually, equating to a 7:1 ROI.
How prevalent is cybersickness in immersive training?
Around 45% of learners report symptoms, though graded exposure protocols reduce nausea by 47% and eye strain by 34%.
Which segment shows the strongest growth momentum?
Services post the steepest 13.41% CAGR, reflecting a shift toward turnkey subscription models.
Why are hospitals ramping up internal simulation centers?
Hospitals aim to offset staffing shortages and comply with competency mandates, driving a 14.27% CAGR within the segment.
What technologies underpin next-generation simulators?
Mixed-reality headsets, AI-driven adaptive analytics, and high-fidelity haptic mannequins form the core of emerging platforms.