
Market Overview
| Study Period | 2020 - 2031 |
|---|---|
| Forecast Data Period | 2026 - 2031 |
| Base Year Market Size (2025) | USD 583.94 Billion |
| Market Size (2026) | USD 606.84 Billion |
| Market Size (2031) | USD 735.48 Billion |
| Growth Rate (2026 - 2031) | 3.92 % |
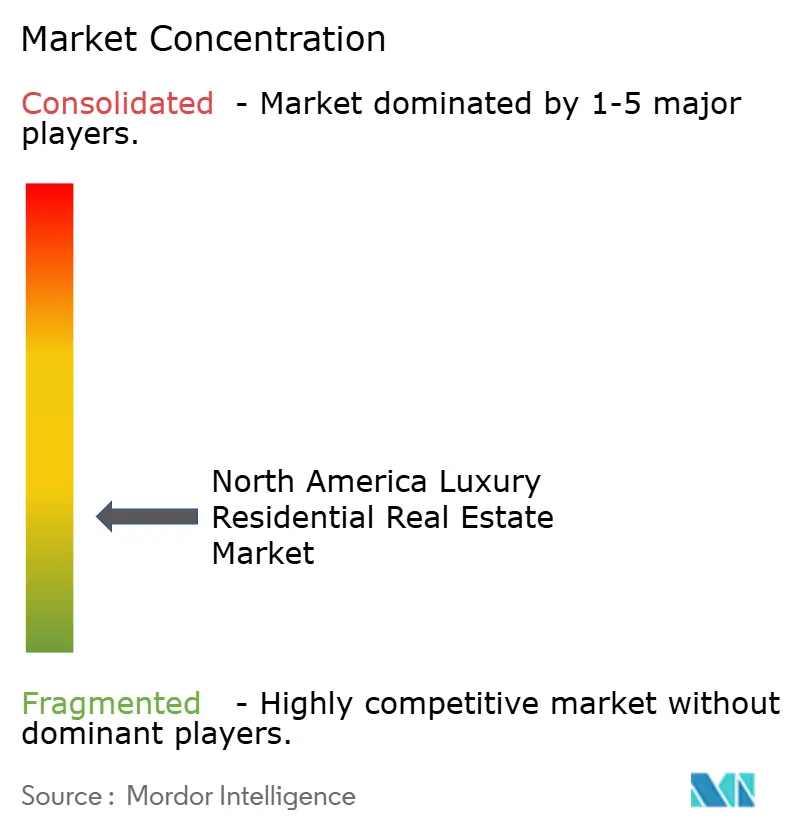
| Market Concentration | Low |
Major Players *Disclaimer: Major Players sorted in no particular order Image © Mordor Intelligence. Reuse requires attribution under CC BY 4.0. | |
North America Luxury Residential Real Estate Market Analysis by Mordor Intelligence
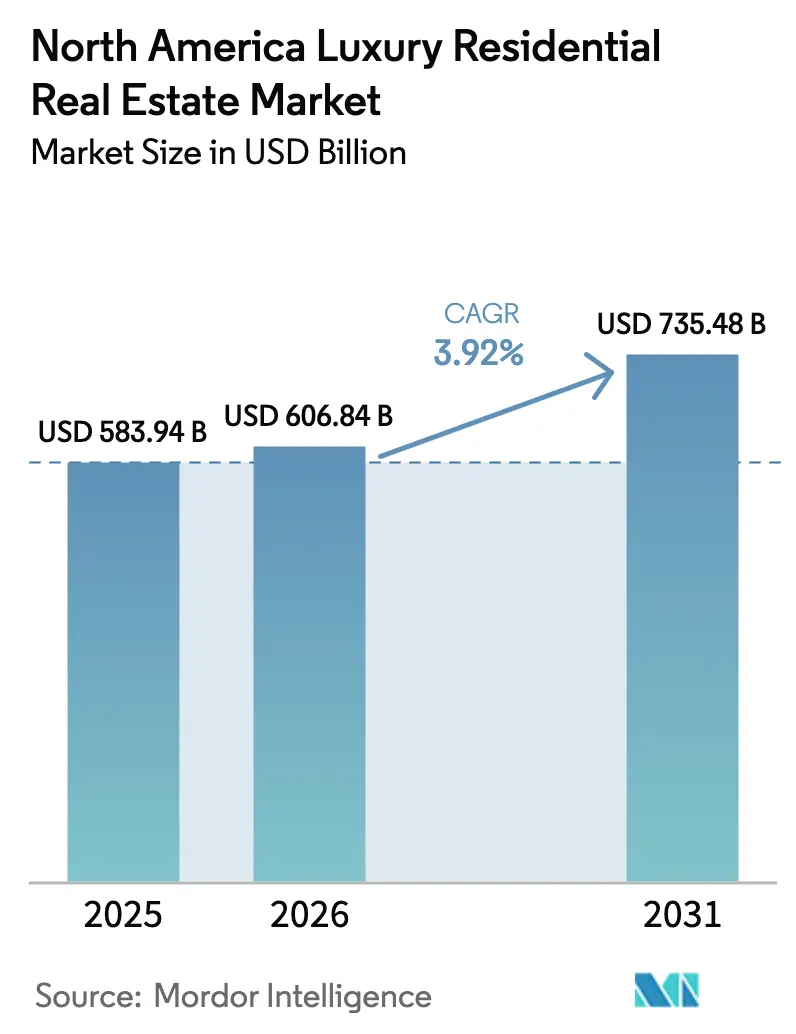
The North America Luxury Residential Real Estate Market size was valued at USD 583.94 billion in 2025 and estimated to grow from USD 606.84 billion in 2026 to reach USD 735.48 billion by 2031, at a CAGR of 3.92% during the forecast period (2026-2031). Growing millionaire migration, tokenized ownership pilots, and a reallocation of institutional capital from offices to high-end housing are reshaping competitive dynamics. Fractionalization lowers the minimum ticket size, broadening the buyer base and adding liquidity. Sunbelt inflows have pushed prime home prices in Miami, Austin, and Las Vegas to record highs, while zero-income-tax policies reinforce the shift. At the same time, ESG mandates are steering developers toward WELL- and LEED-certified schemes that command pricing premiums and support longer-term value preservation.
Key Report Takeaways
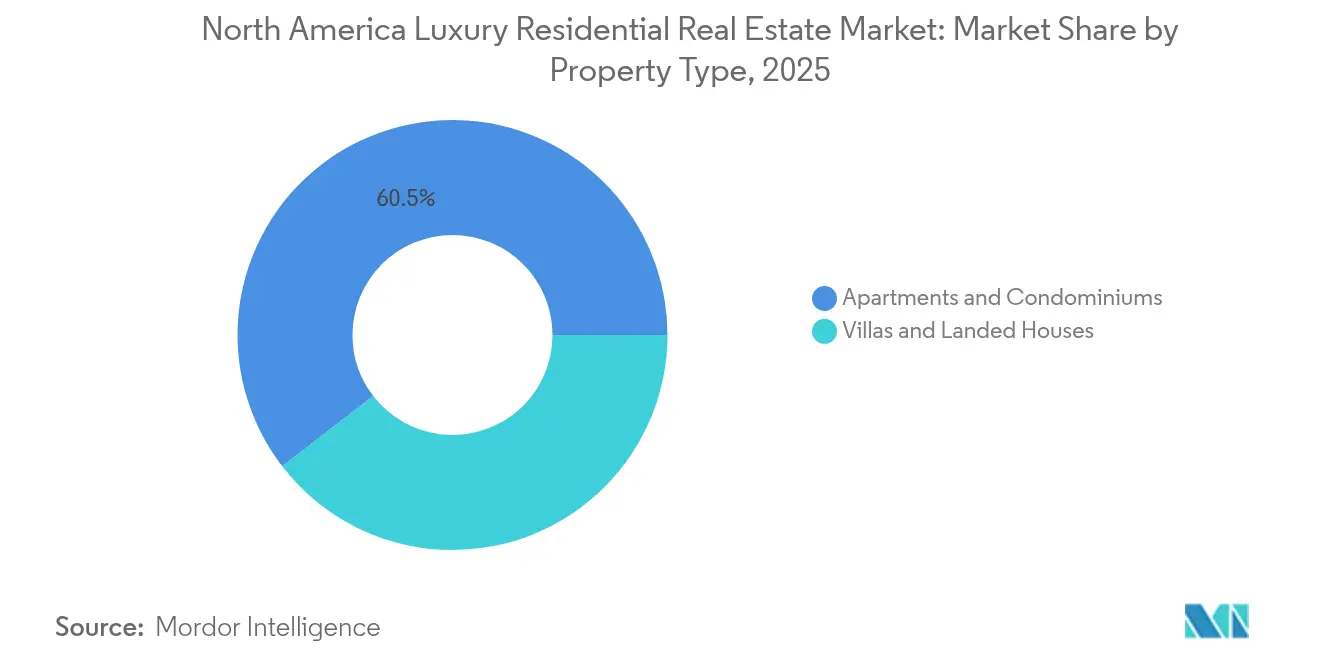
- By property type, apartments and condominiums led with a 60.45% North America luxury residential real estate market share in 2025, while villas and landed houses deliver the fastest 4.05% CAGR to 2031.
- By business model, the sales segment held 69.20% of the North America luxury residential real estate market size in 2025; rentals are expanding at a 4.12% CAGR through 2031.
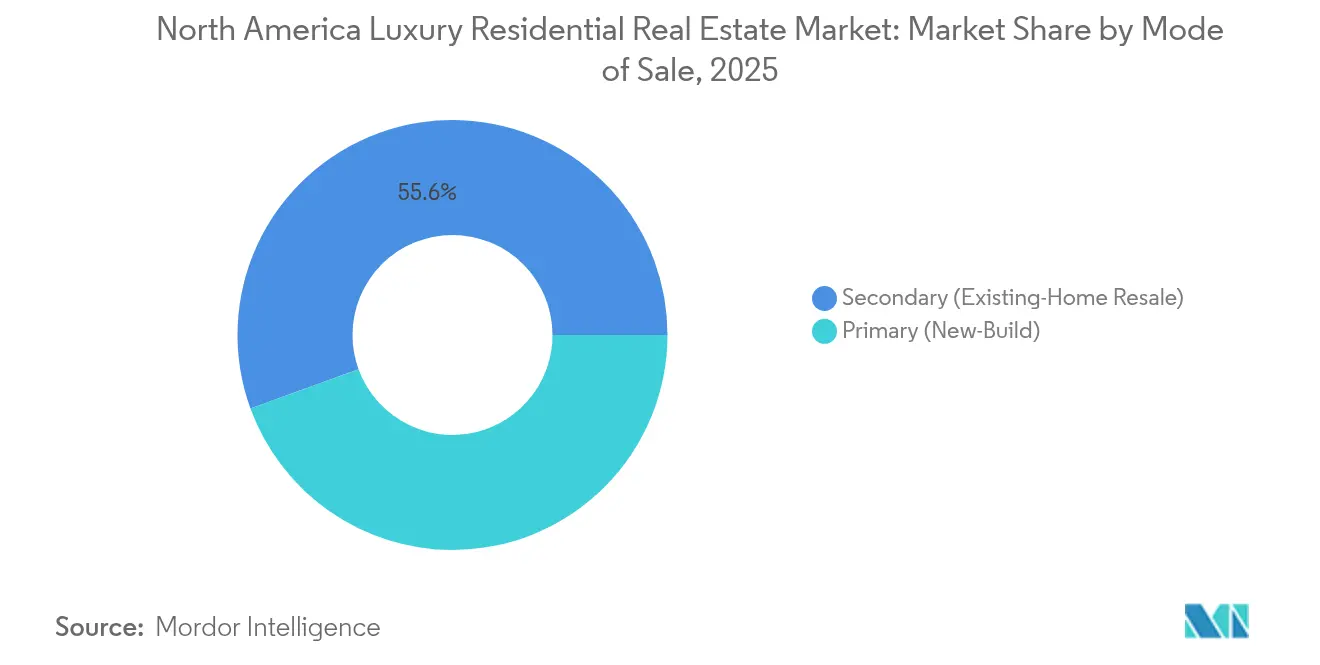
- By mode of sale, secondary transactions accounted for 55.55% of the North America luxury residential real estate market in 2025, whereas primary developments recorded a 4.18% CAGR.
- By geography, the United States dominated with 78.60% revenue share in 2025; Mexico posts the swiftest 4.08% CAGR to 2031.
Note: Market size and forecast figures in this report are generated using Mordor Intelligence’s proprietary estimation framework, updated with the latest available data and insights as of 2026.
North America Luxury Residential Real Estate Market Trends and Insights
Drivers Impact Analysis*
| Driver | (~) % Impact on CAGR Forecast | Geographic Relevance | Impact Timeline |
|---|---|---|---|
| Zero-income-tax Sunbelt migration | +1.2% | Florida, Texas, Nevada; spillover to Mexico | Short term (≤ 2 years) |
| Geopolitical capital flight of UHNWIs | +0.9% | US and Canadian gateway metros | Medium term (2-4 years) |
| Tokenized luxury pipelines unlocking fractional ownership | +0.8% | US & Canada gateway cities | Medium term (2-4 years) |
| Post-pandemic estate expansions | +0.6% | US suburban luxury belts | Short term (≤ 2 years) |
| Institutional ESG mandates pushing WELL Platinum supply | +0.5% | Urban cores in US & Canada | Long term (≥ 4 years) |
| Luxury build-to-rent resorts for digital nomads | +0.4% | US coasts & ski markets, Canadian resorts | Medium term (2-4 years) |
| Source: Mordor Intelligence | |||
USD 1 trillion tokenized luxury pipelines unlocking fractional ownership
Blockchain-enabled tokenization is lowering entry barriers by splitting prime residences into digital shares that can be traded without conventional escrow delays. Deloitte highlights that a single Canadian tower raised USD 300 million through token sales, demonstrating institutional appetite for the model. Smart contracts automate dividend distribution and compliance checks, cutting middle-agent costs. The St. Regis Aspen precedent further eases regulatory concerns, and North American securities watchdogs are drafting sandbox frameworks expected to go live within three years. Taken together, tokenization increases velocity of capital and broadens participation in the North America luxury residential real estate market.
Surging demand for zero-income-tax Sunbelt states
Florida captured 29,771 high-income households averaging USD 907,013 in adjusted gross income during the latest filing year. Texas and Nevada post similar trends, propelled by corporate relocations such as Citadel’s headquarters move to Miami. Over six hundred USD 10 million-plus closings in South Florida last year underscore structural rather than seasonal demand. Builders respond with turnkey condos offering marina berths and private wellness suites, inflating land prices yet sustaining absorption. The pattern accelerates cross-border interest in Mexican resort towns, reinforcing the North America luxury residential real estate market’s Sunbelt bias[1].
Geopolitical capital flight of UHNWIs from LATAM & APAC
Henley & Partners forecasts 142,000 high-net-worth relocations in 2025, an all-time peak, with 7,500 heading to the US and 3,200 to Canada. Vancouver benefits from its Asian diaspora base, while New York and Los Angeles remain safe-haven hubs despite tax headwinds. Multiple-property purchases are common, lifting transaction volumes in both primary and secondary brackets. This inflow underpins steady demand even during equity-market swings, cementing the North America luxury residential real estate market as a global wealth reservoir.
Institutional ESG mandates accelerating WELL Platinum projects
WELL-certified inventory is still under 9% of global certified floor area, signalling room to scale. Hines pledges net-zero operational carbon across its USD 62.16 billion portfolio and delivered New York’s greenest residential tower last year. Oxford Properties embeds decarbonisation plans in more than half of its USD 62.16 billion assets, channelling capital toward heat-pump systems, biophilic design, and low-carbon concrete. Energy-efficient homes cut operating costs 20-30%, supporting price resilience and broadening the investor pool for the North America luxury residential real estate market.
Restraints Impact Analysis*
| Restraint | (~) % Impact on CAGR Forecast | Geographic Relevance | Impact Timeline |
|---|---|---|---|
| Proposed mansion & vacancy taxes | -0.7% | Select US metros; Vancouver, Toronto, Honolulu | Short term (≤ 2 years) |
| Equity-market volatility cutting stock-option buys | -0.6% | US tech hubs; Canadian finance centers | Short term (≤ 2 years) |
| Supply crunch in imported bespoke finishes | -0.5% | North America with global inputs | Medium term (2-4 years) |
| Escalating WELL/LEED compliance costs | -0.3% | Urban luxury corridors | Long term (≥ 4 years) |
| Source: Mordor Intelligence | |||
Proposed mansion & vacancy taxes in major metros
In Los Angeles, a new tax called Measure ULA, aimed at property sales over USD 5 million, led to a steep 68% drop in those sales within a year. The tax only managed to raise USD 215 million, which was much lower than expected. On the other hand, Honolulu is considering a 3% tax on vacant homes, which could bring in up to USD 306 million in revenue. Investors may route capital toward lower-tax jurisdictions, dampening short-run price momentum in affected nodes of the North America luxury residential real estate market.
Supply crunch in imported bespoke finishes
Italian marble waste surpasses 70% of quarried volume, inflating extraction and logistics costs. Steel prices leapt 11.2% last year, while lumber tariffs added USD 3,000 to each multifamily unit. Smart-glass capacity remains limited to a handful of plants globally, stretching lead times for curtain-wall residences. Developers either accept margin compression or raise asking prices, tempering absorption in parts of the North America luxury residential real estate market.
*Our forecasts treat driver/restraint impacts as directional, not additive. The impact forecasts reflect baseline growth, mix effects, and variable interactions.
Segment Analysis
By Property Type: Condominiums command urban dominance while villas accelerate suburban sprawl
Apartments and condominiums held a 60.45% slice of the North America luxury residential real estate market in 2025, propelled by demand for lock-and-leave convenience, shared security, and amenity-rich towers. Vista Pointe on New Jersey’s Gold Coast exemplifies the model with 73 glass-wrapped units, an infinity pool, and a 24-hour concierge. Institutional buyers back such schemes for stable rental yields, reinforcing pipeline depth. Secondary resales remain active, especially for branded residences that preserve service standards over time. At the opposite end, villas and landed houses outpace at a 4.05% CAGR as clients seek acreage for wellness pavilions and multigenerational living.
Estate lots in Palm Beach, Scottsdale, and Muskoka now feature accessory dwelling units and tech-integrated spas, lifting replacement costs and resale potential. Developers pivot with gated communities offering curated landscaping and private docks, blending privacy with community governance. This mix enables villas to capture lifestyle-centric spending, a tailwind for the overall North America luxury residential real estate market expansion.

By Business Model: Sales supremacy meets rental agility
Sales transactions comprised 69.20% of the North America luxury residential real estate market in 2025, reflecting the asset-preservation instinct of UHNWIs and family offices. Trophy purchases hedge inflation and provide inter-generational wealth storage, keeping turnover healthy even when rates rise. Meanwhile, rentals log a 4.12% CAGR as flexibility gains favour. Build-to-rent resorts in Jackson Hole and Whistler furnish five-star services without ownership burdens, an attractive set-up for globe-trotters.
Developers secure long-dated credit lines and structure lease programs with hospitality operators, aligning cash flows with investor demands. Younger millionaires rotate between tech hubs and leisure hotspots, sustaining occupancy. Rental platforms also test blockchain-driven security-deposit models that speed check-in and reduce friction. Both channels coexist, broadening the audience for the North America luxury residential real estate market.
By Mode of Sale: Secondary maturity versus primary innovation
Secondary deals represented 55.55% of transactions in 2025, confirming ample legacy stock across high-end zip codes. Historic co-ops on Central Park West and 1990s-era penthouses in Toronto trade at premiums when retrofit with smart-home upgrades. Familiar neighbourhood brands, school districts, and cultural institutions anchor liquidity.
Primary developments, however, move ahead at a 4.18% CAGR, often wrapped in global hotel brands that deliver food-and-beverage, yacht-charter concierge, and medical partnerships. Waldorf Astoria Residences Pompano Beach, scheduled for a 2027 handover, sold 60% of its inventory within nine months. ESG-ready design gives new builds an edge as investors prioritise carbon footprints. The dual-track structure enriches choice within the North America luxury residential real estate market.
Geography Analysis
The United States captured 78.60% of the North America luxury residential real estate market in 2025, underscored by concentrated domestic wealth and policy incentives in zero-income-tax states. Florida, Texas, and Nevada led net in-migration, with Miami alone adding nearly 600 USD 10 million-plus trades over 12 months. Capital flight from Latin America solidified demand in Coral Gables and Brickell, while tech relocations energised Austin’s lakefront enclaves. Builders responded with branded towers offering valet boat slips and private seaplane docks, amplifying price resilience even as borrowing costs climbed.
Canada benefits from 3,200 millionaire entries a year under its immigration investor programs. Vancouver’s west side fetches premium valuations, buoyed by Chinese and South Asian communities seeking education and stability. Toronto’s Yorkville corridor posts record condo launches, although proposed vacancy levies add caution. Developers offset regulatory drag by targeting Toronto-born diaspora now working in US tech hubs, yet retaining familial ties. This cross-border capital circulation strengthens the integrated fabric of the North America luxury residential real estate market.
Mexico registers the fastest 4.08% CAGR to 2031, driven by currency arbitrage and proximity to US buyers. Los Cabos, Punta Mita, and Tulum attract retirees and remote executives who split time between US headquarters and coastal sanctuaries. Developers bundle property stewardship, medical concierge, and remote-work infrastructure, easing ownership complexities. Joint-venture financing with US private equity accelerates construction pipelines, underlining Mexico’s strategic role in the broader North America luxury residential real estate market.
Regulatory Landscape
Regulation affecting luxury residential transactions and development in North America is tightening around transparency, while some jurisdictions pursue faster approvals and tighter controls on local charges. In the United States, the Financial Crimes Enforcement Network (FinCEN) moved toward nationwide anti-money-laundering reporting requirements for certain non-financed residential real estate transfers involving legal entities and trusts (implementation noted in March 2026), which raises compliance expectations for high-value purchases commonly structured through entities. Separately, Executive Order 14394 (signed March 13, 2026) directed federal agencies to reduce residential regulatory barriers and asked the Department of Housing and Urban Development to promote best-practice approaches for state and local permitting, reinforcing the policy direction toward shorter permitting timelines.
Canada is showing a similar emphasis on transparency and development streamlining. British Columbia continues to operate the Land Owner Transparency Registry administered by the Land Title and Survey Authority of BC to identify beneficial owners behind land-holding structures, a key touchpoint for luxury transactions in Vancouver and other high-value markets. In Ontario, the Building Homes and Improving Transportation Infrastructure Act, 2026 received Royal Assent on June 2, 2026, aiming to standardize planning and streamline approvals, while also exempting non-profit retirement housing from development charges, which can affect the feasibility of certain senior-living and mixed-use residential concepts in premium nodes. At the state level in the US, legislation such as Maryland HB 548 (2026 Regular Session) targets how local development excise taxes and impact fees can be collected, adding another layer to the permitting and pro forma process for new-build luxury communities.
Value Chain Analysis
The luxury residential value chain in North America runs from land sourcing and entitlement through design, specialty construction, marketing, brokerage, and transaction closing. Developers and master-planned community sponsors coordinate architects, interior designers, and general contractors, then rely on specialist suppliers for high-end finishes and systems (stone, bespoke millwork, smart glass, premium appliances, and advanced HVAC). Distribution and monetization are routed through luxury brokerages and digital marketing platforms, with closings supported by lenders (where financed), escrow and title, and legal and compliance providers, especially when purchases are made via entities or trusts.
In 2025-2026, the most visible friction points sit upstream in materials and labor. Tariffs and import volatility have elevated costs on high-end inputs, and extended lead times for key MEP equipment have pushed builders toward earlier procurement and higher contingencies. Competition for skilled labor and materials is intensified by large non-residential workstreams, including data centers and advanced manufacturing, which affects scheduling and contract structures for luxury residential builds. Developers and contractors increasingly favor domestic sourcing in the US and Canada for select categories of finishes and systems, while still preserving brand and design intent required for ultra-prime positioning.
Competitive Landscape
The North America Luxury Residential Real Estate Market is fragmented, with no single brokerage or developer controlling more than a single-digit share across the continent. Regional specialists such as Sotheby’s International Realty, Coldwell Banker Global Luxury, and Howard Hughes compete on local knowledge, while technology-enabled entrants seek scale. Compass completed a series of acquisitions, including Washington Fine Properties and @properties, lifting agent count past 50,000 and annual closed volume to USD 127 billion. The playbook blends brand retention with data-driven marketing, setting a precedent for platform consolidation inside the North America luxury residential real estate market.
Private-equity funds pivot toward high-end housing as office yields compress. KKR deployed USD 2.1 billion for an 18-property multifamily set spanning California, Florida, and Texas, signaling a belief in luxury-adjacent rental stability. VICI Properties and Eldridge invested USD 300 million in One Beverly Hills, uniting the Aman flag with retail and gardens that meet WELL benchmarks. These moves indicate rising institutional appetite and intensify rivalry for prime land parcels.
Disruptors introduce blockchain escrow, AI-driven valuation and fractional-share trading platforms. Early pilots, while small, highlight potential fee compression for legacy agents. Established firms counter by pairing white-glove service with tech enhancements such as virtual-reality tours and predictive pricing dashboards. This innovation cycle preserves market fluidity and ensures healthy competitiveness across the North America luxury residential real estate market.
North America Luxury Residential Real Estate Industry Leaders
-
Toll Brothers City Living
-
Lennar Corp (CalAtlantic Luxury)
-
Howard Hughes Corp
-
Related Companies
-
Extell Development
- *Disclaimer: Major Players sorted in no particular order
Market Opportunities and Future Outlook
Tokenization and fractional ownership pilots remain a clear whitespace in luxury residential, because they lower minimum ticket size and broaden participation beyond traditional whole-asset buyers, while still aligning with trophy-asset demand in gateway cities. The report context highlights tokenized luxury pipelines and references institutional appetite demonstrated by large token-sale fundraising in Canada. As compliance requirements for entity-based purchases tighten, platforms that embed KYC/AML and automate distributions via smart contracts have a clearer pathway to partner with developers and brokers, rather than compete only on disintermediation.
Sustainability and resilience features are also shifting toward a practical design-and-marketing lever for new luxury supply and renovation activity, anchored by the April 2026 release of the ICC 700-2025 National Green Building Standard (NGBS) by the National Association of Home Builders (NAHB) and International Code Council (ICC). Demonstration projects such as The New American Home 2026, verified with Emerald-level NGBS certification and a negative HERS outcome, offer a tangible template for ultra-efficient envelopes, electrification-ready systems, and on-site generation that can be productized for premium condos and villas. On the demand side, brokerage signals point to a wider buyer funnel for prime US inventory in 2026, as Coldwell Banker Global Luxury reported that international luxury-buyer interest in US residential real estate doubled in the first five months of 2026. This supports opportunities for cross-border marketing, turnkey property management, and hospitality-led service layers in California, New York, and other gateway markets.
Recent Industry Developments
- July 2026: Lennar announced The Towns at West End, a 53-homesite boutique townhome community in historic Lancaster City, Pennsylvania, with an opening targeted for fall 2026. The launch expands luxury-leaning product into walkable, infill-style submarkets where scarcity and lifestyle amenities can support premium pricing.
- June 2026: Toll Brothers announced Peapack Crossing, a new luxury community planned for Somerset County, New Jersey, with pricing starting at USD 1.4 million. The move reinforces the builder focus on high-income suburban corridors near major employment centers, and adds supply positioned for buyers seeking newer construction without sacrificing established location advantages.
- December 2025: Howard Hughes completed 1 Riva Row, a 268-unit multifamily project in The Woodlands, Texas, comprising a 13-story tower, a four-story residential building, and private-entry townhomes. The completion adds high-end rental and for-sale-adjacent inventory in a master-planned environment, supporting the broader shift toward amenity-rich community ecosystems that compete with urban-core luxury offerings.
Research Methodology Framework and Report Scope
Market Definition and Coverage
For this study, the market covers the annual value created from luxury residential property sales and rental activity across North America, where luxury is treated as the top-end price bracket within each metro (not a single national cutoff).
Scope exclusions: We exclude mixed-use buildings where residential units are a minor share of the total built-up area, along with non-residential real estate activity.
Segmentation Overview
- By Property Type
- Apartments & Condominiums
- Villas & Landed Houses
- By Business Model
- Sales
- Rentals
- By Mode of Sale
- Primary (New-Build)
- Secondary (Existing-Home Resale)
- By Country
- United States
- Canada
- Mexico
Data Sources, Market Sizing, and Validation
Desk Research
Desk work starts by locking the boundary of what counts as luxury in each country and major metro, and then mapping how transactions and rentals are tracked in public statistics. We referenced sources such as national housing and price releases from the US Census Bureau, the US Bureau of Economic Analysis, Statistics Canada, and Mexico INEGI, followed by monetary and mortgage indicators from the Federal Reserve and central bank publications.
To keep the model grounded in real activity, we also reviewed non-paywalled sources like MLS and Realtor association dashboards where available, city or state land registry summaries, and public company filings and investor presentations from listed residential developers and brokerages. In parallel, we used paid subscriptions for company financials and intelligence, a patent database for demand-side features that can shift premium pricing (energy efficiency and smart-home systems), and a news and financials feed to time policy or rate shocks. These examples are not exhaustive, and many other public sources were used to collect data, cross-check assumptions, and clarify open points.
Primary Interviews and Surveys
Primary inputs came from interviews and short surveys with brokers, developers, property managers, appraisers, mortgage and wealth-advisory professionals, and transaction support firms that see luxury deal flow and rental demand. We used these conversations to confirm how luxury thresholds shift by metro, how discounts to list price behave, and how the split between primary new-build and secondary resale changes when rates and inventory move.
Distribution of primary research fieldwork respondents
| Company type | Respondent position |
|---|---|
| Top tier: 32% | CXOs: 18% |
| Mid tier: 46% | Functional/Unit leaders: 33% |
| Smaller Players: 22% | Managers: 49% |
Market-Sizing & Forecasting
Sizing starts with a top-down build where housing activity data is reconstructed into a luxury demand pool by applying metro-specific luxury cutoffs and then translating activity into value using price and rent signals. The model is then checked with selective bottom-up approximations, including sampled listings and closings to validate price-per-square-foot ranges, and channel checks with market participants to confirm realistic turnover and rental absorption.
Inputs that mattered most include high-end price indices and median sale prices, transaction counts and months of inventory, new-build starts and completions, mortgage rate levels and jumbo loan availability, and observed spreads between list and close prices for luxury homes. Since luxury pricing moves fast, we treat average selling price changes as a combination of mix shifts (condo versus landed houses, prime versus non-prime neighborhoods) and true price movement, instead of using one flat inflation factor.
For forecasting, we used scenario analysis anchored to rate paths, inventory normalization, and cross-border buyer appetite, and then aligned the scenario weights to what primary respondents expect for closings and rental renewals. Where local data is thinner, gaps are handled through proxy series like regional permits, published broker market reports, and structured assumptions that are re-tested in validation calls.
Data Validation & Update Cycle
Validation is done through multiple checks where outputs are compared with independent signals such as luxury price trend direction, publicly reported transaction volumes, and developer booking commentary, before totals are finalized. Outliers are flagged when price growth or volume shifts break historical relationships, and then the drivers are reviewed again so one unusual metro does not distort the wider North America result.
Our update cadence is annual for full refreshes, and interim updates are triggered when material events occur, such as sharp rate changes, tax rule adjustments, or sudden inventory swings in major metros. Before delivery, the dataset and assumptions receive a final pass so the estimates reflect the latest available releases and market feedback.
Mordor Intelligence's North America Luxury Residential Real Estate Market Size Versus Other Published Estimates
Published market values for luxury residential real estate often vary because the word luxury is not fixed, and because some studies mix listing values, transaction values, and rental contract values in the same total. Differences also come from how exchange rates are applied, which months of data are included for the current year, and whether resales and rentals are both counted.
A major spread-driver is refresh timing, since luxury prices and volumes can shift within quarters, and a model that updates the ASP and close-rate assumptions using the most recent releases will land on a different year value than one locked earlier. Currency timing also matters when Canada and Mexico are included, and the checks used to avoid double-counting primary sales versus secondary resales will push totals up or down, depending on how the boundary is set in each approach, which is why the cadence and validation checks used by Mordor Intelligence are a practical part of the gap.
Benchmark comparison
| Source | Market Size | Gaps in Research Methodology |
|---|---|---|
| Mordor Intelligence | USD 583.94 B (2025) | |
| Industry Publisher A | USD 276.51 B (2024) | Uses an earlier base year and a narrower luxury definition in practice, and the value appears closer to a transaction subset that can undercount rentals and parts of the resale market across North America. |
| Regional Consultancy B | USD 5443.30 B (2025) | Represents the broader North America real estate market rather than the luxury residential subset, and it likely includes non-luxury residential activity and additional real estate categories that expand the total. |
The comparison shows that the largest gaps are explained by scope first, and then by timing choices like which months are used for the current year and how FX is converted for Canada and Mexico. By keeping the steps tied to observable transaction and rental signals, and by re-checking price and volume assumptions when new data prints arrive, the final number stays traceable to a repeatable set of inputs.
Key Questions Answered in the Report
What is the current size of the North America luxury residential real estate market?
The market is valued at USD 606.84 billion in 2026 and is forecast to reach USD 735.48 billion by 2031.
Which property type dominates the market?
Apartments and condominiums command 60.45% share, reflecting urban buyers’ preference for amenity-rich, low-maintenance living.
Why are zero-income-tax states important for luxury housing growth?
States such as Florida and Texas attract high-income migrants, increasing prime-home demand and supporting above-average price appreciation.
How does ESG influence new luxury developments?
Institutional investors prioritise WELL and LEED certifications, pushing developers to integrate energy efficiency and health-focused design to secure funding and pricing premiums.
What role does tokenization play in the sector?
Tokenization fractionalises ownership, lowers entry costs and enhances liquidity, drawing new capital pools into luxury real estate.
Which geography is the fastest-growing?
Mexico posts a 4.08% CAGR through 2031, buoyed by US wealth spillover, currency advantages and luxury resort expansion.