
Market Overview
| Study Period | 2021 - 2031 |
|---|---|
| Forecast Data Period | 2026 - 2031 |
| Base Year Market Size (2025) | USD 158.95 Billion |
| Market Size (2026) | USD 163.48 Billion |
| Market Size (2031) | USD 188.14 Billion |
| Growth Rate (2026 - 2031) | 2.85 % |
| Market Concentration | Medium |
Major Players *Disclaimer: Major Players sorted in no particular order Image © Mordor Intelligence. Reuse requires attribution under CC BY 4.0. | |
North America Luxury Goods Market Analysis by Mordor Intelligence
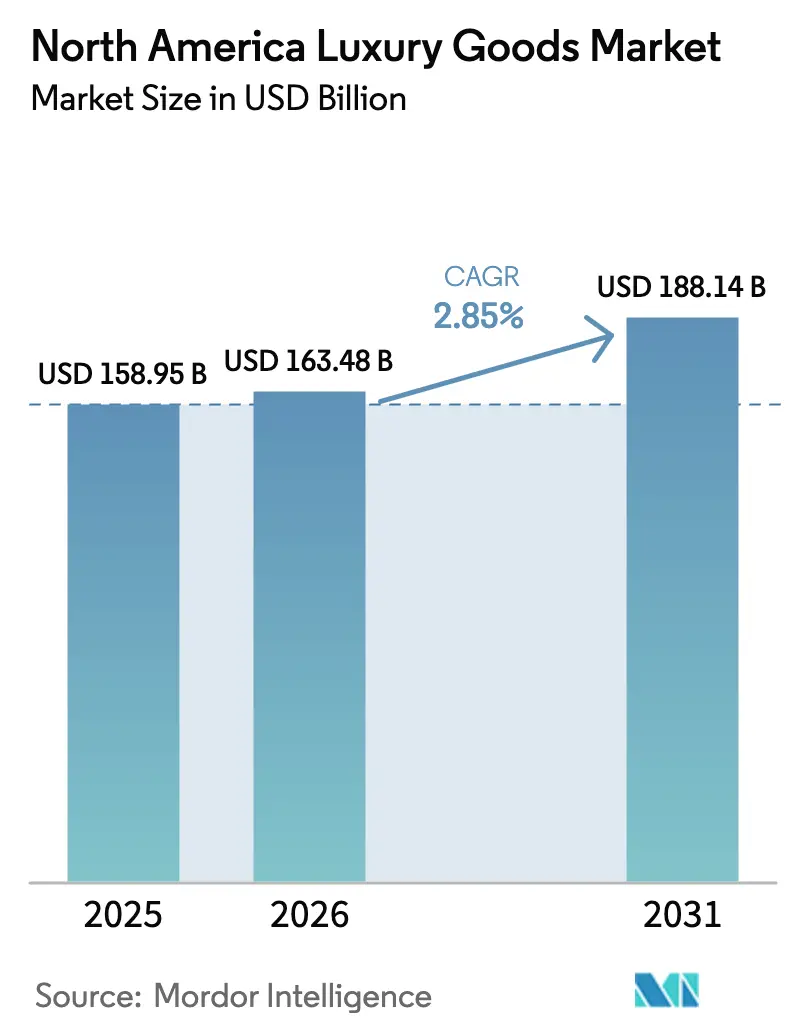
The North American luxury goods market size was valued at USD 158.95 billion in 2025 and is estimated to grow from USD 163.48 billion in 2026 to USD 188.14 billion by 2031, at a CAGR of 2.85% during the forecast period (2026-2031). This measured trajectory reflects a maturing consumer base that prioritizes experiential retail and authenticated provenance over volume-driven consumption, even as inbound tourist flows from Latin America and Asia rebound to pre-pandemic levels. Clothing and apparel accounted for 34.55% of 2025 revenues; however, leather goods are expected to outpace all product categories at a 2.94% CAGR through 2031, driven by Coach's regenerative-leather partnerships and Hermès's waitlist-driven scarcity model, as noted in Tapestry's 2024 SEC 10-K. Flagship refurbishments in New York and Toronto have reinforced the appeal of single-brand stores, yet augmented-reality try-ons and invite-only digital drops are propelling the online channel. Geographic expansion centers on Mexico, where a widening upper-middle class and record department-store revenues signal runway for boutiques beyond traditional resort corridors.
Key Report Takeaways
- By product type, clothing and apparel led with 34.55% of the North America luxury goods market share in 2025. Leather goods are forecast to expand at a 2.94% CAGR through 2031, the fastest growth among product categories.
- By end-user, women accounted for 55.05% of 2025 revenue; the men’s segment is projected to grow at 3.07% annually to 2031.
- By distribution channel, single-brand stores held 40.68% of 2025 revenue, while online stores are poised for a 3.48% CAGR through 2031.
- By geography, the United States captured 70.33% of 2025 revenue, whereas Mexico is expected to register a 3.61% CAGR to 2031.
Note: Market size and forecast figures in this report are generated using Mordor Intelligence’s proprietary estimation framework, updated with the latest available data and insights as of January 2026.
Market Trends and Insights
Drivers Impact Analysis of North America Luxury Goods Market*
| Driver | (~) % Impact on CAGR Forecast | Geographic Relevance | Impact Timeline |
|---|---|---|---|
| Brand heritage reinforcing premium perception | +0.6% | United States, Canada; selective adoption in Mexico City, Monterrey | Long term (≥ 4 years) |
| Social media influence boosting brand desirability | +0.5% | United States (coastal metros), Canada (Toronto, Vancouver); emerging in Mexico | Medium term (2-4 years) |
| High demand from inbound tourists | +0.4% | United States (New York, Miami, Los Angeles), Canada (Toronto, Vancouver) | Short term (≤ 2 years) |
| Luxury seen as status and self-expression | +0.5% | United States (Gen Z, Millennials), Mexico (aspirational middle class) | Medium term (2-4 years) |
| Rising online direct-to-consumer luxury engagement | +0.4% | United States, Canada; mobile-first adoption in Mexico | Medium term (2-4 years) |
| Sustainability preferences shaping purchase decisions | +0.3% | United States (coastal urban centers), Canada (Vancouver, Toronto) | Long term (≥ 4 years) |
| Source: Mordor Intelligence | |||
Brand Heritage Reinforcing Premium Perception
Heritage narratives justify price premiums that defy inflationary pressures. Hermès maintained double-digit revenue growth in North America through 2025 by anchoring each leather-goods launch in its 1837 saddlery origins, a tactic that converts waitlists into social currency. Chanel executed 8 to 10% price increases across handbags in 2024 without volume erosion, leveraging Coco Chanel's interwar legacy to frame each hike as a preservation of craft rather than margin expansion. Louis Vuitton's March 2025 collaboration with Swiss watchmaker Voutilainen, priced at EUR 550,000, sold out within hours, demonstrating that provenance-driven storytelling can command ultra-luxury premiums even in a cautious spending environment. This dynamic creates a moat: newer entrants lack the archival depth to justify similar markups, forcing them into volume-based strategies that erode perceived exclusivity.
Social Media Influence Boosting Brand Desirability
Instagram and TikTok drive discovery and purchase intent, particularly among consumers under 40. Luxury brands generated the majority of total earned media value across fashion categories in 2024, with influencer partnerships delivering measurable conversion rates that justify six-figure endorsement deals. Gucci's collaboration with Hot Wheels in early 2025, a limited-edition die-cast car priced at USD 120, garnered 2.3 million TikTok impressions within 48 hours, translating into a 14% uptick in website traffic for Gucci's accessories line. Brands that master short-form video and micro-influencer seeding capture younger cohorts before competitors can replicate the playbook.
High Demand from Inbound Tourists
International visitors remain a disproportionate source of revenue for flagship stores in gateway cities. The U.S. National Travel and Tourism Office projects 90.3 million inbound arrivals in 2026, with visitor spending forecast to reach USD 233 billion, a 5.2% increase over 2025[1]. Latin American and Asian travelers concentrate purchases in New York, Miami, and Los Angeles, where tax-refund programs and currency advantages amplify buying power. Bank of America credit-card data revealed that the top 5% of U.S. earners increased overseas luxury spending by 10.5% in 2024, even as domestic fashion outlays fell 9% year-on-year, underscoring a bifurcated demand pattern[2]. Brands that cluster boutiques near hotels and tourist corridors capture impulse purchases that domestic foot traffic alone cannot sustain.
Luxury Seen as Status and Self-Expression
Luxury goods are increasingly perceived as powerful symbols of social status and personal self-expression, making this perception a key driver of market growth. Consumers use luxury products not only to signal wealth or success but also to communicate individuality, taste, and lifestyle choices, especially in categories such as fashion, accessories, beauty, and watches. The shift toward identity-driven consumption has strengthened demand for distinctive designs, limited editions, personalization, and heritage branding. Additionally, social media visibility and public self-presentation have amplified the role of luxury goods as markers of prestige and uniqueness, encouraging aspirational purchases across both mature and emerging economies.
Restraints Impact Analysis of North America Luxury Goods Market*
| Restraint | (~) % Impact on CAGR Forecast | Geographic Relevance | Impact Timeline |
|---|---|---|---|
| Availability of counterfeit products | -0.4% | United States (border states, e-commerce), Canada (Pacific Mall corridor), Mexico (USMCA gaps) | Short term (≤ 2 years) |
| Unregulated resale undermining perceived exclusivity | -0.3% | United States (online platforms), Canada (Toronto, Vancouver) | Medium term (2-4 years) |
| Stringent government regulations | -0.2% | United States (CBP enforcement), Canada (RFA compliance), Mexico (IP enforcement gaps) | Long term (≥ 4 years) |
| Regulatory and tariff complexity hindering imports | -0.3% | United States-Mexico-Canada tri-national supply chains | Medium term (2-4 years) |
| Source: Mordor Intelligence | |||
Availability of Counterfeit Products
U.S. Customs and Border Protection seized counterfeit goods with a manufacturer's suggested retail price of USD 5.4 billion in fiscal 2024, with watches, handbags, and jewelry representing the top three categories [3]. This volume erodes brand equity and diverts revenue, particularly in border states where cross-border smuggling routes remain active. Canada's Pacific Mall in Toronto has long been flagged for counterfeit sales, yet enforcement remains inconsistent; only 23% of Canadian retailers adopted the Retail Federation of America's authentication protocols by 2024, leaving gaps that sophisticated counterfeiters exploit. E-commerce platforms amplify the challenge: counterfeit listings often rank higher in search results than authorized sellers, confusing consumers and forcing brands to allocate legal budgets to takedown notices rather than product innovation. Mexico's placement on the Priority Watch List reflects persistent intellectual-property gaps under USMCA, delaying shipments and raising compliance costs for brands operating tri-national supply chains.
Unregulated Resale Undermining Perceived Exclusivity
Unregulated platforms lack authentication standards, flooding the market with counterfeits that masquerade as authenticated resale. These dynamics compress primary-market pricing power: when consumers can acquire a Chanel flap bag on resale for a large share of retail within months of release, brands lose the scarcity premium that justifies waitlists. Hermès and Rolex have responded by tightening allocation to boutiques and requiring purchase histories for high-demand SKUs, but these measures alienate first-time buyers and push them toward resale channels. The resale surge also shortens product life cycles; brands must refresh collections more frequently to maintain novelty, raising design and production costs without corresponding revenue uplifts.
*Our forecasts treat driver/restraint impacts as directional, not additive. The impact forecasts reflect baseline growth, mix effects, and variable interactions.
North America Luxury Goods Market Segment Analysis
By Product Type:
Leather Goods Lead InnovationLeather goods will expand at a 2.94% CAGR through 2031, the fastest among product categories, as brands integrate regenerative sourcing and circularity programs that resonate with sustainability-conscious buyers. Clothing and apparel held 34.55% of 2025 revenues, anchored by Chanel's tweed jackets and Ralph Lauren's tailored suiting, yet growth remains constrained by inventory cycles and markdown pressures in department-store channels. Footwear benefits from athleisure collaborations; Gucci's partnership with Adidas in 2025 sold out within hours, but faces margin compression as sneaker resale platforms normalize discounting. Eyewear and beauty each capture single-digit shares, though L'Oréal Luxe's Lancôme and YSL Beauty lines posted double-digit North America growth in 2024, driven by prestige skincare and fragrance launches. Watches remain a high-value segment: Rolex increased production to 1.3 million units in 2024, shrinking waitlists and compressing secondary-market premiums, a tactical shift that underscores how even ultra-premium brands must balance exclusivity with volume. Jewelry benefits from bridal and gifting occasions, with Cartier and Van Cleef & Arpels maintaining pricing power through limited-edition collections and heritage storytelling.
Coach's partnership with Gen Phoenix to source regenerative leather material from ranches that sequester carbon exemplifies how product innovation can drive category leadership. The brand achieved Leather Working Group Gold certification for 95% of its tanneries, a credential that resonates with millennial and Generation Z buyers who scrutinize supply-chain transparency. Hermès piloted a leather-goods take-back program in select North American stores during 2024, refurbishing returned items for resale at 70% of the original price, a move that captures secondary-market margin while reinforcing brand stewardship. These initiatives suggest that leather goods will continue to outpace apparel and footwear, where sustainability claims remain harder to verify, and consumer skepticism runs higher.


By End-User:
Men's Segment Gains MomentumMen's luxury will grow at a 3.07% CAGR through 2031, outpacing women's and unisex, as grooming, athleisure collaborations, and high-complication timepieces attract younger male buyers. Women accounted for 55.05% of 2025 revenues, driven by handbags, ready-to-wear, and beauty, yet saturation in these categories limits incremental growth. Unisex offerings, fragrances, sneakers, and minimalist leather goods appeal to Generation Z consumers who reject binary gender norms, yet this segment remains nascent and lacks the volume to move market-wide metrics.
Rolex's production increase to 1.3 million units in 2024 directly addressed pent-up male demand, shrinking waitlists for Submariner and GMT-Master II models, and compressing secondary-market premiums by 15 to 20%. Gucci's collaboration with North Face in 2025, a technical outerwear line priced at USD 2,500 to USD 4,000, sold out within 72 hours, demonstrating that men will pay luxury premiums for functional innovation. Estée Lauder's Tom Ford Beauty acquisition in 2022 has since driven double-digit growth in men's grooming, with North America representing the largest regional market for fragrances and skincare. These trends suggest that brands underweighting men's assortments risk ceding share to competitors who recognize the segment's untapped potential.

By Distribution Channel:
Online Gains ShareOnline stores will expand at a 3.48% CAGR through 2031, the fastest distribution channel, as brands deploy augmented-reality try-ons and invite-only drops that bypass wholesale markups. Burberry's virtual scarf try-on feature, launched in November 2024, reduced return rates by 18% and increased average order value by 12% within the first quarter, demonstrating that digital tools can replicate in-store service levels. Single-brand stores held 40.68% of 2025 revenues, anchored by flagship renovations in New York and Toronto, where experiential retail, private shopping suites, in-store cafés, and art installations justify premium rents. Multi-brand stores face structural headwinds: department-store traffic declined 8% year-on-year in 2024, forcing landlords to convert space to entertainment and food-and-beverage tenants.
Mexico's luxury e-commerce surged to 71% mobile penetration in 2024, with male buyers over 36 comprising the majority of online transactions, a demographic skew that favors watches and leather accessories over apparel. Louis Vuitton's digital platform launched exclusive online-only SKUs in 2025, capturing margin uplifts of 25% per unit by eliminating wholesale intermediaries. Direct-to-consumer platforms yield richer customer data, enabling brands to test limited releases and adjust inventory in real time, a capability that multi-brand retailers cannot match. This dynamic pressures wholesale partnerships, forcing brands to allocate top-tier inventory to owned channels and reserve secondary assortments for department stores.
Geography Analysis
Mexico, United States and Canada Luxury Goods Market
Mexico will grow at a 3.61% CAGR through 2031, the fastest geographic segment, fueled by El Palacio de Hierro's MXN 40.39 billion nine-month revenue, up 11.3% year-on-year, and a wave of boutique openings in Monterrey and Guadalajara. The United States captured 70.33% of 2025 revenues, anchored by New York, Miami, and Los Angeles, where international tourist spending amplifies domestic demand. Canada benefits from Toronto's Bloor Street rental surge, up 16% in 2024, and Yorkdale Shopping Centre's per-square-foot rents exceeding USD 2,400, signaling landlord confidence in foot traffic recovery.
Caribbean, Central America and North America Luxury Goods Market
The rest of North America, comprising smaller Caribbean and Central American markets, remains subscale but offers niche opportunities for resort-focused luxury. Hermès opened a second Mexico City boutique in 2024, while Chanel expanded its Polanco flagship by 30%, moves that signal confidence in sustained demand. The U.S. National Travel and Tourism Office forecasts 90.3 million inbound arrivals in 2026, with visitor spending reaching USD 233 billion, a 5.2% increase over 2025. Latin American and Asian travelers concentrate purchases in gateway cities, where tax-refund programs and currency advantages amplify buying power. Canada's market maturity limits volume growth, yet Yorkdale's luxury tenant mix, including Hermès, Chanel, and Louis Vuitton, demonstrates that high-net-worth consumers will support premium retail in select corridors.
Urban centers such as New York, Los Angeles, Miami, Toronto, and San Francisco act as key luxury consumption hubs, benefiting from high-income populations, tourism inflows, and brand concentration. These cities attract global luxury brands seeking visibility and brand positioning, while also fostering demand for experiential luxury through exclusive in-store services and limited-edition offerings. Cross-border shopping and international tourism further reinforce regional demand, particularly in major metropolitan areas.
Regulatory Landscape
Luxury goods players in North America face tighter scrutiny on labeling, origin, and product-composition claims, alongside continued import and customs enforcement. In April 2026, the US Federal Trade Commission announced a Made in USA sweep that included three law enforcement actions targeting allegedly false origin claims, underscoring the need for substantiated marketing and compliant labeling. The FTC also continues to police requirements under the Textile Fiber Products Identification Act, Wool Products Labeling Act, and Fur Products Labeling Act, which affect apparel, leather, and fur-adjacent luxury categories sold through single-brand and online channels.
Chemical rules add further complexity, particularly for prestige beauty. Maine and Vermont restrictions on cosmetics with intentionally added PFAS took effect January 1, 2026, and Connecticut added requirements effective July 1, 2026 related to labeling and notification to the Connecticut Department of Energy and Environmental Protection. In Canada, the Select Luxury Items Tax Regulations, 2026 (SOR-2026-3175) were modified in June 2026 to align with the Select Luxury Items Tax Act, affecting pricing, invoicing, and compliance processes for taxable high-value items. Trade-policy uncertainty remains a planning variable for brands managing tri-national supply chains, with the USMCA scheduled for a formal review beginning in July 2026.
Competitive Landscape
Market concentration indicates moderate fragmentation where conglomerates like LVMH and Kering coexist with independent houses such as Hermès and Rolex, each pursuing distinct pricing and scarcity strategies. LVMH's LIFE 360 program targets 100% renewable energy by 2030 and has already enrolled 1,200 suppliers in circularity audits, setting a compliance benchmark that smaller players struggle to match. Competitive intensity hinges less on price wars than on heritage storytelling, limited-edition collaborations, and direct-to-consumer platforms that bypass multi-brand retailers. White-space opportunities include men's grooming, where Estée Lauder's Tom Ford Beauty acquisition has driven double-digit growth, and regenerative leather goods, where Tapestry's Coach brand leads with Leather Working Group Gold certification for 95% of tanneries.
Technology adoption varies: Burberry's augmented-reality scarf try-on reduced return rates by 18%, while Louis Vuitton's blockchain-based authentication pilot, launched in 2024, aims to combat counterfeits and resale fraud. Emerging disruptors include resale platforms like Vestiaire Collective and The RealReal, which captured USD 210 billion to USD 220 billion globally in 2024, with U.S. consumers holding 32% of their closets in pre-owned items. These platforms compress primary-market pricing power by normalizing discounting and shortening product life cycles, forcing brands to refresh collections more frequently.
Rolex's production increased to 1.3 million units in 2024, exemplifying a tactical response: by shrinking waitlists, the brand recaptured margin from secondary markets and stabilized dealer networks. Strategy patterns cluster around three axes: conglomerates leverage scale to invest in sustainability infrastructure; independent houses maintain scarcity through allocation controls; and digitally native brands deploy augmented reality and invite-only drops to replicate in-store exclusivity online. Brands that fail to integrate technology risk ceding younger cohorts to competitors who master short-form video and micro-influencer seeding.
North America Luxury Goods Industry Leaders
-
LVMH Moët Hennessy Louis Vuitton
-
Hermès
-
Kering
-
Chanel Limited
-
Prada S.p.A.
- *Disclaimer: Major Players sorted in no particular order

North America Luxury Goods Market Companies Covered in this Report
- LVMH Moët Hennessy Louis Vuitton SE
- Hermès
- Kering
- Compagnie Financière Richemont S.A.
- Chanel Limited
- The Estée Lauder Companies Inc.
- Rolex SA
- Prada S.p.A.
- Burberry Group plc
- Ralph Lauren Corporation
- Capri Holdings Limited
- L’Oréal Group (Luxe division)
- Shiseido Company, Limited
- The Swatch Group Ltd.
- Tapestry, Inc.
- Hudson’s Bay Company
- Zino Davidoff SA
- Birks Group Inc.
- Salvatore Ferragamo S.p.A.
- Ferrari N.V.
Market Opportunities and Future Outlook
Retail network optimization is increasingly concentrating around high-productivity luxury nodes and shifting toward brand-controlled environments. In Canada, June 2026 brought Chanel's largest Canadian boutique opening at Oakridge Park in Vancouver, consolidating fashion, watches, fine jewelry, fragrance, and beauty under one roof, while in July 2026 Chrome Hearts acquired a Yorkville property at 121 Scollard Street in Toronto for USD 12.65 million to establish its first standalone Canadian flagship. These store decisions strengthen the case for investment in premium retail corridors in Toronto and Vancouver, and for brands seeking tighter control over merchandising, clienteling, and inventory allocation versus multi-brand distribution.
Customer-experience technology and data-led clienteling represent a concrete whitespace as online engagement expands and authenticity concerns persist. Bain & Company (with Comite Colbert) reported in June 2026 that AI adoption in customer-facing luxury functions rose from 16% in 2024 to 21% in 2026, and operational adoption increased from 10% to 19% over the same period, alongside a finding that 54% of US luxury consumers used AI during their most recent luxury purchase. This supports opportunities for brands and platforms to incorporate AI into discovery, personalization, and service workflows, while also improving authentication, compliance-ready product information, and after-sales support across channels.
Recent Industry Developments in North America Luxury Goods Market
- July 2026: Hermès inaugurated a new store at Westfield UTC in San Diego, expanding its directly operated footprint in California. The opening reinforces the shift toward single-brand environments where clienteling and controlled assortment support scarcity-led pricing models.
- October 2025: Hermès opened its first store in Nashville, Tennessee, in the Wedgewood-Houston district, marking its 43rd US location. The move extends luxury retail expansion beyond traditional coastal hubs and targets fast-growing regional wealth pockets through a full-service boutique format.
- September 2024: Canada Goose partnered with Marchon to launch its first sunglasses and prescription frames. The entry into premium eyewear broadens category exposure and supports cross-selling to existing outerwear customers through a higher-frequency accessory segment.
North America Luxury Goods Market Report Scope and Research Methodology
Market Definition and Coverage
For this study, the market covers retail sales value of luxury goods purchased by consumers across North America, where products are positioned and priced as premium and brand-led.
Scope exclusions: We exclude luxury travel, hospitality, fine dining, and other experience-led spending that is sometimes grouped under luxury in lifestyle studies.
Segments Covered in This Report
- Product Type
- Clothing and Apparel
- Footwear
- Eyewear
- Leather Goods
- Jewelry
- Watches
- Beauty and Personal Care
- End-User
- Men
- Women
- Unisex
- Distribution Channel
- Single-Brand Stores
- Multi-Brand Stores
- Online Stores
- Geography
- United States
- Canada
- Mexico
- Rest of North America
Data Sources, Market Sizing, and Validation
Desk Research
Desk research starts by setting the demand boundary for luxury goods and then checking whether the value path makes sense across the region. We used public reference points such as the US Census Bureau retail series, Bureau of Economic Analysis consumption data, Statistics Canada retail indicators, Mexico's INEGI retail and income statistics, and USITC trade data for relevant import flows, which help explain product availability and pricing pressure.
We also reviewed annual reports, 10-Ks and investor presentations of key listed brands and retailers, along with press releases and association websites that discuss category trends and channel shifts. In a few places, paid subscriptions were used to normalize company financials, review news timelines, and scan patent activity tied to materials and authentication. These desk sources are not exhaustive, and many other public and paid references were used to collect data, validate assumptions, and clarify open questions.
Primary Interviews and Surveys
Primary work was used to pressure-test category and channel splits, and to confirm how premium pricing and discounting move through the year. We spoke with brand teams, retailers, distributors, and industry specialists across the United States, Canada, and Mexico, followed by checks with managers who track store performance and online sell-through.
Distribution of primary research fieldwork respondents
| Company type | Respondent position |
|---|---|
| Top tier: 37% | CXOs: 14% |
| Mid tier: 46% | Functional/Unit leaders: 39% |
| Smaller Players: 17% | Managers: 47% |
Market-Sizing & Forecasting
Sizing is built using a top-down and bottom-up blend, where macro spending signals are translated into luxury-goods value for North America and then checked using supplier and channel approximations. The top-down side relies on consumption and retail indicators to form a demand pool, followed by category splits that are aligned to what is actually sold through stores and online.
To keep the totals realistic, we corroborate results using selective bottom-up checks such as sampled brand and retailer revenue roll-ups where disclosures exist, plus ASP x volume logic for a few visible categories like leather goods, jewelry, and premium beauty. Key inputs that move the model include discretionary spending direction, luxury price progression and promotional intensity, tourist shopping recovery in major cities, online versus store mix, and the pace of growth in affluent households.
For forecasting, scenario analysis is used to reflect different paths for inflation, consumer confidence, and premium price acceptance, which are then anchored with a simple multivariate regression against the most stable macro drivers. When company disclosures are incomplete, gaps are handled using peer benchmarks and channel checks, and then adjusted after expert validation so the final series stays consistent year to year.
Data Validation & Update Cycle
Model outputs are checked against independent signals like retail sales direction, trade and inventory cues, and company-reported regional performance, and then variances are investigated before final sign-off. When an input looks inconsistent, we re-check the source logic and, if needed, re-contact respondents to understand what changed in pricing, demand, or channel mix.
Each report is refreshed annually, and interim updates are made when a material event affects demand or pricing (for example, sharp currency moves or a broad pullback in discretionary spending). Before delivery, a final pass is completed so clients receive a current view aligned with the latest available data.
Mordor Intelligence's North America Luxury Goods Market Sizing Compared With Other Published Estimates
It is normal to see different market sizes for luxury goods because publishers do not always treat the same products, channels, and price thresholds in the same way. Differences in base year choice and how inflation is handled can also shift the final number, even when the headline geography looks identical.
By tracking retail value in USD and refreshing channel mix and premium price assumptions with respondent checks, Mordor Intelligence keeps the North America total tied to consumer spending rather than wholesale shipments. The biggest gaps usually come from whether beauty and fragrances are fully included, whether resale is counted, and whether values reflect consumer prices or trade values, which can inflate or compress totals depending on the method.
Benchmark comparison
| Source | Market Size | Gaps in Research Methodology |
|---|---|---|
| Mordor Intelligence | USD 158.95 B (2025) | |
| Trade Wire Service A | USD 107.83 B (2024) | Uses an earlier base year and a different growth window, and it is less clear whether consumer-price retail value is consistently used across categories and channels. |
| Industry Publisher B | USD 140.45 B (2025) | Applies a longer forecast horizon with higher implied growth, and rollups can differ if category definitions and price floors for luxury classification are set differently. |
Looking across the table, the spread is mainly explained by what is counted as luxury goods, when the base year is set, and how pricing is translated into USD. A market model that stays traceable to retail value, channel mix, and realistic price steps tends to land in a balanced range that can be repeated and re-checked as conditions change.
Key Questions Answered in the Report
How big is the North America luxury goods market in 2026?
The market is valued at USD 163.48 billion in 2026 and is projected to reach USD 188.14 billion by 2031.
Which product segment is growing the fastest?
Leather goods are expected to post the fastest CAGR at 2.94% through 2031, supported by regenerative sourcing and circularity programs.
What channel will capture the most incremental revenue?
Online direct-to-consumer platforms are forecast to advance at a 3.48% CAGR, outpacing all physical formats as brands invest in augmented-reality tools.
Why is Mexico considered a key growth market?
Mexico is projected to grow at 3.61% CAGR through 2031, buoyed by rising upper-middle-class disposable income and aggressive boutique expansion.