North America LFP Battery Pack Market Size and Share
Market Overview
| Study Period | 2017 - 2029 |
|---|---|
| Base Year For Estimation | 2024 |
| Forecast Data Period | 2025 - 2029 |
| Market Size (2025) | USD 0.76 Billion |
| Market Size (2029) | USD 2.06 Billion |
| Growth Rate (2025 - 2029) | 28.27% CAGR |
| Market Concentration | Low |
Major Players*Disclaimer: Major Players sorted in no particular order Image © Mordor Intelligence. Reuse requires attribution under CC BY 4.0. | |

North America LFP Battery Pack Market Analysis by Mordor Intelligence
The North America LFP Battery Pack Market size is estimated at 0.76 billion USD in 2025, and is expected to reach 2.06 billion USD by 2029, growing at a CAGR of 28.27% during the forecast period (2025-2029).
The North American LFP battery pack industry is experiencing a significant transformation driven by technological advancements and improved performance characteristics. Lithium iron phosphate batteries have emerged as a compelling alternative to traditional battery chemistries, offering enhanced safety features, extended cycle life, and superior thermal stability. These LFP battery packs now deliver impressive ranges of 320-480 kilometers per charge, making them increasingly viable for various electric vehicle applications. The technology continues to evolve, with manufacturers focusing on improving energy density and charging capabilities while maintaining the inherent safety advantages of LFP chemistry. Advancements in manufacturing processes and materials science have also contributed to making LFP cell technology more cost-competitive and efficient.
Government initiatives and regulatory frameworks are playing a pivotal role in shaping the market landscape. A notable example is Quebec's substantial investment of USD 3,679.23 million in EV battery production and recycling infrastructure, demonstrating strong governmental commitment to developing the domestic battery supply chain. California's ambitious mandate requiring all new passenger vehicles sold in the state to be zero-emission by 2035 exemplifies the regulatory push toward electrification. These policy measures are creating a supportive environment for sustainable battery adoption while encouraging domestic manufacturing capabilities and technological innovation. The implementation of these initiatives is accelerating the transition toward sustainable transportation solutions.
The market is witnessing increased collaboration between battery manufacturers and automotive OEMs to develop and optimize LFP battery pack solutions. Major automotive manufacturers are actively incorporating lithium iron phosphate batteries into their electric vehicle portfolios, recognizing their potential for mass-market applications. The industry is experiencing a shift in battery design philosophy, with manufacturers focusing on modular and scalable battery pack architectures that can accommodate different vehicle platforms and requirements. This collaborative approach is fostering innovation in battery management systems, thermal management solutions, and manufacturing processes, leading to improved product performance and cost efficiency.
The adoption patterns of LFP battery packs are diversifying across various vehicle segments, with particularly strong traction in commercial and fleet applications. The technology's attributes of long cycle life and robust performance make it especially suitable for high-utilization scenarios such as electric buses and commercial delivery vehicles. The market is witnessing a projected annual increase in battery energy storage system energy density of approximately 7.5% through 2028, with average vehicle ranges expected to expand from 350 kilometers to 450 kilometers by 2025. This improvement in performance metrics, coupled with decreasing production costs, is making LFP cell technology increasingly attractive for both commercial and passenger vehicle applications, driving broader market adoption.
North America LFP Battery Pack Market Trends and Insights
The major players in the North American electric vehicle market include Tesla, Toyota, Ford, Hyundai, and Honda
- The North American electric vehicle market is majorly driven by the five major players, accounting for more than 70% of the market in 2023. These prominent players include Tesla, Toyota Group, Ford Group, Hyundai, and Honda. Tesla is the highest seller of electric vehicles in the various North American countries, accounting for around 33% of the market. The company focuses on strong innovation technologies and has strong strategic partnerships with various EV components (such as a battery) manufacturers. Being a US-based company, it has a strong customer base with great product and service offerings in major countries like the United States and Canada across North America.
- Toyota Group is the second largest seller of electric vehicles, accounting for around 30.8% market share across North America. The company has a strong supply chain and distribution network. Toyota has a reliable brand image among its customers. It ranks third in EV sales across various countries in North America. Ford Group acquired it with around 9.9% of the market share. The company has a large customer base in North American countries due to its strong brand image and diverse offerings.
- Hyundai is the fourth largest player, acquiring around 5.48% of the market share in EV sales across North America. The company has a strong production and supply chain network, with wide innovative and diverse products offered for various types of customers looking from reasonable to premium pricing. The fifth-largest player operating in the EV market is Honda, maintaining its market share at around 5.22%. Some of the other players selling EVS in North America include Jeep, Chevrolet, BMW, and Volvo.

The United States was the largest market with huge EV demand and captured more than 60% of the battery pack market across the region in 2023
- In 2023, the demand for batteries surged as the number of electric vehicles steadily climbed across several North American countries. Many other brands and models are sold in the region, but the top five models in 2023, the Tesla Model Y, Tesla Model 3, Toyota Rav 4, Toyota Sienna, and Honda CRV, acquired a significant portion of the market. With 247,344 units sold in the United States in 2023, the Tesla Model Y maintained its top spot. The Model Y is very well-liked because of its long range, strong seating capacity, and huge luggage capacity.
- The Tesla Model 3 took second place with 215,500 sales in the United States in 2023. The rear-wheel drive and performance versions of the vehicle are available. Due to its strong performance characteristics, Model 3 is drawing customers. The Toyota Rav4 took third position in electric car sales, with sales of 149,938 in the United States and throughout North America. The vehicle has plug-in hybrid technology and several ADAS features, including Toyota Safety Sense.
- The Toyota Sienna has acquired fourth place in the electric vehicle models’ sales, with 69,720 in the United States. The car comes with the option of a 2.5 l engine with a hybrid powertrain. Consumers with big families looking for seven-seater cars have positively responded to the Toyota Sienna. The fifth place was acquired by the Honda CRV, selling 69,720 units in 2023 in the United States. Other top-selling models include Toyota Highlander, Jeep Wrangler, Toyota Camry, Honda Accord, and Ford Mustang Mach-E.

OTHER KEY INDUSTRY TRENDS COVERED IN THE REPORT
- Surging demand for electric vehicles in North America is driven by government support and growing environmental concerns
- Declining prices of lithium-ion batteries drive the demand for electric vehicles in North America
- Battery prices in North America may continue to decline through 2029, driven by advancements in technology, increasing production efficiency, and rising demand for electric vehicles and renewable energy
- Rising demand for electric vehicles spurs new product launches and market entry in North America, driving battery pack demand
- The dominance of NMC batteries, along with the growing adoption of NCA, LFP, and NCM chemistries in the EV battery market in North America
- Rising electric vehicle sales drive increased demand for battery materials in North America
- Increasing demand and advancements in battery technology drive the growth of electric vehicles in North America
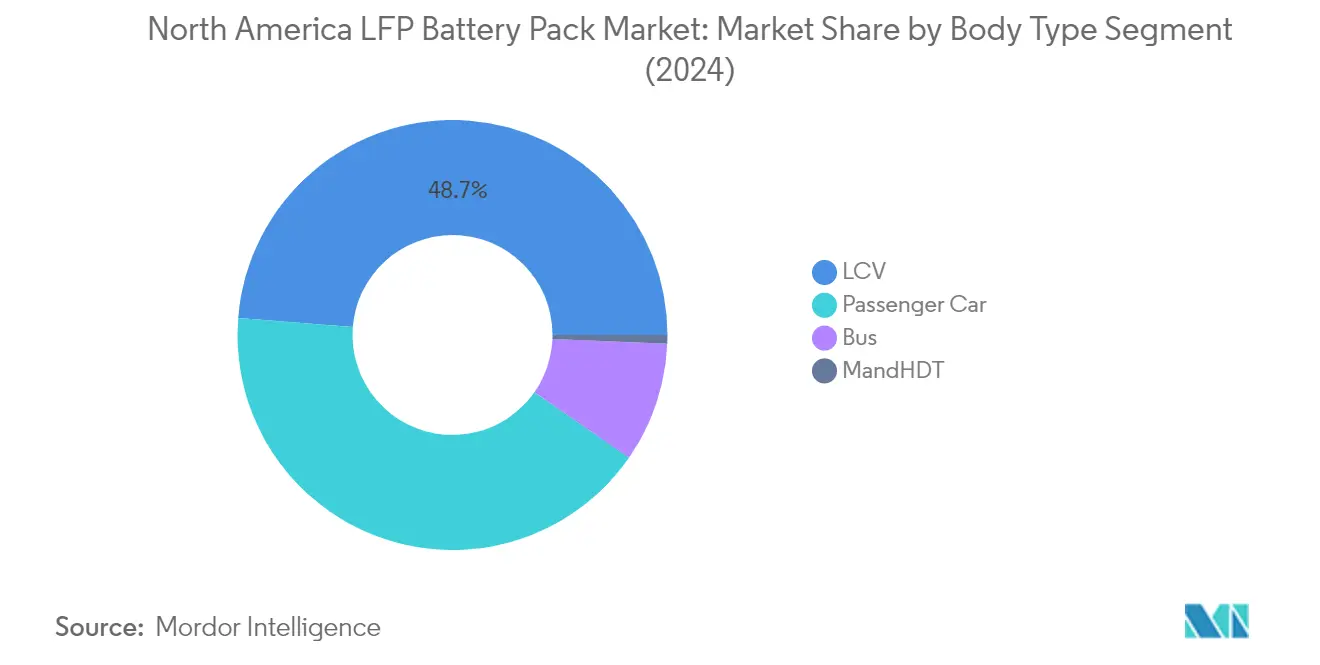
Segment Analysis: Body Type
LCV Segment in North America LFP Battery Pack Market
The Light Commercial Vehicle (LCV) segment dominates the North America LFP battery pack market, commanding approximately 49% of the total market share in 2024. This significant market position is primarily driven by the increasing adoption of electric delivery vans and commercial fleet vehicles by major logistics companies and e-commerce giants. The segment's growth is further supported by favorable government initiatives promoting zero-emission commercial vehicles and the expanding infrastructure for electric vehicle charging. Companies like Amazon, UPS, and FedEx are actively transitioning their delivery fleets to electric vehicles, contributing substantially to the segment's dominance. The lower total cost of ownership, reduced maintenance requirements, and environmental benefits of electric LCVs continue to attract fleet operators and businesses across North America.
M&HDT Segment in North America LFP Battery Pack Market
The Medium and Heavy-Duty Truck (M&HDT) segment is emerging as the fastest-growing segment in the North America LFP battery pack market, projected to expand at a remarkable rate during 2024-2029. This exceptional growth is driven by increasing regulatory pressure to reduce emissions in the commercial transportation sector and growing interest from fleet operators in electric truck battery pack solutions. Major truck manufacturers are introducing new electric models with LFP battery technology, recognizing its advantages in terms of cost-effectiveness and durability. The segment's growth is further supported by government incentives specifically targeting the electrification of heavy-duty vehicles and the development of charging infrastructure along major transportation corridors. The improving total cost of ownership metrics and advancements in battery technology are making electric M&HDTs increasingly attractive for long-haul operations.
Remaining Segments in Body Type
The passenger car and bus segments also play crucial roles in shaping the North America LFP battery pack market. The passenger car segment represents a substantial portion of the market, driven by increasing consumer adoption of electric vehicles and growing manufacturer preference for LFP technology due to its cost advantages and safety features. The bus segment, while smaller in market share, is experiencing significant traction, particularly in public transportation and school bus fleets, as municipalities and educational institutions increasingly transition to electric alternatives. Both segments benefit from ongoing technological improvements in LFP battery technology, growing charging infrastructure, and supportive government policies promoting electric vehicle adoption across different vehicle categories.
Segment Analysis: Propulsion Type
BEV Segment in North America LFP Battery Pack Market
The Battery Electric Vehicles (BEV) segment dominates the North America LFP battery pack market, commanding approximately 99% market share in 2024. This overwhelming dominance can be attributed to several factors, including the superior performance characteristics of LFP batteries in BEVs, enhanced safety features, and longer lifespan compared to other battery chemistries. The segment is also experiencing the fastest growth trajectory, expected to grow at nearly 42% during 2024-2029, driven by increasing consumer adoption of pure electric vehicles, supportive government policies, and expanding charging infrastructure across North America. Major automotive manufacturers are increasingly incorporating LFP battery technology in their BEV models, particularly appreciating its cost-effectiveness and thermal stability. The segment's growth is further bolstered by advancements in LFP battery technology, improving energy density and charging capabilities, making BEVs more practical for everyday use.
PHEV Segment in North America LFP Battery Pack Market
The Plug-in Hybrid Electric Vehicle (PHEV) segment, while smaller in market share, plays a crucial role in the transition towards electrification. PHEVs serve as a bridge technology, offering consumers the flexibility of both electric and conventional powertrains. The segment benefits from consumers who desire the advantages of electric mobility while maintaining the security of a traditional internal combustion engine as backup. Manufacturers are optimizing LFP battery packs specifically for PHEV applications, focusing on achieving the right balance between electric range and overall vehicle performance. The integration of LFP batteries in PHEVs is driven by their inherent safety characteristics, cost advantages, and ability to withstand frequent charging cycles typical in PHEV usage patterns.
Segment Analysis: Capacity
40-80 kWh Segment in North America LFP Battery Pack Market
The 40-80 kWh segment dominates the North American LFP battery pack market, commanding approximately 66% market share in 2024. This segment's prominence can be attributed to its optimal balance between range and cost-effectiveness for electric vehicles. The capacity range is particularly well-suited for passenger vehicles and light commercial vehicles, offering sufficient range for daily commuting and medium-distance travel while maintaining reasonable battery costs. Major automotive manufacturers are increasingly adopting this capacity range in their mainstream electric vehicle models, recognizing it as the sweet spot that meets consumer expectations for range while keeping vehicle prices competitive. The segment's growth is further supported by advancements in battery technology that have improved energy density and charging capabilities within this capacity range.
Above 80 kWh Segment in North America LFP Battery Pack Market
The above 80 kWh segment is experiencing the most rapid growth in the North American LFP battery pack market, with projections indicating robust expansion from 2024 to 2029. This accelerated growth is driven by increasing demand for long-range electric vehicles, particularly in the premium and luxury segments. The segment's expansion is supported by technological advancements in LFP chemistry that have improved energy density and charging capabilities. Automotive manufacturers are increasingly incorporating high-capacity battery packs to address range anxiety concerns and meet the requirements of long-distance travel. The segment is also benefiting from growing adoption in commercial vehicles, particularly electric buses and trucks, where higher capacity electric bus battery pack and electric truck battery pack solutions are essential for maintaining operational efficiency over extended routes.
Remaining Segments in Capacity
The less than 15 kWh and 15-40 kWh segments serve distinct market niches in the North American LFP battery pack market. The less than 15 kWh segment caters primarily to urban mobility solutions, including electric scooters, small city cars, and hybrid vehicles where smaller battery capacities are sufficient for short-distance travel. Meanwhile, the 15-40 kWh segment targets the entry-level electric vehicle market and plug-in hybrid vehicles, offering a balance between affordability and practical range for urban and suburban use. These segments play crucial roles in market diversification, providing solutions for various vehicle types and use cases while contributing to the overall electrification of transportation in North America.
Segment Analysis: Method
Laser Segment in North America LFP Battery Pack Market
The laser method has emerged as the dominant segment in the North American LFP battery pack market, commanding approximately 64% of the market share in 2024. This method has gained significant traction due to its superior precision in cell assembly and enhanced thermal management capabilities, which contribute to improved battery pack efficiency and longevity. The laser method's popularity is driven by its ability to ensure optimal performance and reliability in battery pack manufacturing, while also enabling higher production volumes in shorter timeframes. The segment's growth is further supported by increasing government incentives and stricter emission regulations across North America. Looking ahead through 2029, the laser segment is expected to maintain its strong growth trajectory with a projected growth rate of around 40%, driven by advancements in laser welding technology, increasing adoption of electric vehicles, and the method's ability to deliver improved energy efficiency and enhanced safety standards in battery pack manufacturing.
Wire Segment in North America LFP Battery Pack Market
The wire method represents a traditional yet reliable approach in the North American LFP battery pack market, offering manufacturers a cost-effective solution for battery pack assembly. This segment has maintained its position by providing robust electrical connections and mechanical stability in battery pack manufacturing. The wire method's adoption is particularly strong in applications where cost optimization is a primary consideration, while still maintaining acceptable quality standards. The method continues to be relevant due to its proven track record in delivering consistent performance and its compatibility with existing manufacturing infrastructure. Manufacturers appreciate the wire method's straightforward implementation and lower initial investment requirements compared to laser-based solutions. The segment's value proposition is further enhanced by its ability to accommodate various battery cell sizes and configurations, making it a versatile choice for different applications in the electric vehicle and energy storage markets.
Segment Analysis: Component
Cathode Segment in North America LFP Battery Pack Market
The cathode segment has emerged as the dominant component in the North American LFP battery pack market, commanding approximately 50% market share in 2024. This substantial market position can be attributed to cathodes' crucial role in determining the performance, energy density, and overall efficiency of LFP batteries. The segment's growth is driven by continuous technological advancements in cathode materials, focusing on enhancing energy density and lowering costs. Major OEMs and manufacturers in the North American EV market, including Tesla, General Motors, and BYD, have embraced LFP batteries with advanced cathode technologies. The push for enhanced cathode materials aims to boost energy density and optimize cost efficiency, making LFP batteries more competitive in the electric vehicle market.
Separator Segment in North America LFP Battery Pack Market
The separator segment is projected to experience the fastest growth in the North American LFP battery pack market during 2024-2029, with an expected CAGR of approximately 30%. This remarkable growth trajectory is driven by increasing emphasis on battery safety and performance optimization. The development of advanced separator materials, including ultra-thin and high-performance variants utilizing nanotechnology, is expected to fuel market expansion. The segment is also witnessing innovation through the incorporation of sustainable and recyclable materials, such as bio-based polymers, addressing environmental concerns. Leading manufacturers are investing in research and development to enhance separator properties, including improved porosity, reduced resistance, and enhanced thermal stability, contributing to better overall battery performance and safety standards.
Remaining Segments in Component
The anode and electrolyte segments also play vital roles in the North American LFP battery pack market. The anode segment continues to evolve with the development of advanced carbon-based materials, including hard carbon and graphite oxide, focusing on improving charging speeds and battery longevity. Meanwhile, the electrolyte segment contributes significantly to battery performance through innovations in electrolyte formulations that enhance ionic conductivity and thermal stability. Both segments are witnessing substantial technological advancements and research initiatives aimed at improving overall battery performance, with manufacturers focusing on developing more efficient and cost-effective solutions for next-generation LFP batteries.
Segment Analysis: Material Type
Other Materials Segment in North America LFP Battery Pack Market
The Other Materials segment, which includes aluminum, copper, and various other components, dominates the North American LFP battery pack market with approximately 50% market share in 2024. This segment's prominence can be attributed to the essential role these materials play in ensuring optimal battery performance, particularly in electrical connections and power transmission within LFP battery packs. The segment's leadership position is reinforced by the increasing demand for high-performance battery materials that can enhance conductivity, thermal management, and overall battery efficiency. Manufacturers are particularly focused on optimizing the use of aluminum and copper components to improve power density and reduce weight, while maintaining structural integrity. The segment's dominance is further supported by ongoing advancements in material science and manufacturing processes that continue to improve the quality and cost-effectiveness of these essential components.
Nickel Segment in North America LFP Battery Pack Market
The Nickel segment is experiencing remarkable growth in the North American LFP battery pack market, with a projected growth rate of approximately 46% during 2024-2029. This exceptional growth is driven by nickel's crucial role in enhancing battery performance, particularly in improving energy density and extending battery life. The segment's expansion is further supported by technological advancements in nickel processing and integration techniques, which are making it increasingly viable for large-scale battery production. Manufacturers are investing heavily in research and development to optimize nickel content in battery chemistry, leading to improved performance metrics and cost efficiency. The segment's growth is also bolstered by the increasing demand for high-performance electric vehicles that require superior battery capabilities, where nickel plays a crucial role in achieving desired performance parameters.
Remaining Segments in Material Type
The other significant segments in the material type category include Natural Graphite, Lithium, Cobalt, and Manganese, each playing vital roles in the LFP battery ecosystem. Natural Graphite serves as a crucial anode material, offering excellent conductivity and stability. Lithium remains fundamental to the battery chemistry, providing the essential ionic transport mechanism. Cobalt contributes to structural stability and performance enhancement, though its usage is relatively limited in LFP chemistry compared to other battery types. Manganese adds to the thermal stability and overall performance of the battery system. These materials collectively contribute to the advancement of LFP battery technology, with manufacturers continuously optimizing their usage to achieve the perfect balance between performance, cost, and sustainability.
North America LFP Battery Pack Market Geography Segment Analysis
North America LFP Battery Pack Market in United States
The United States dominates the North American LFP battery pack market, commanding approximately 86% of the total market value in 2024. The country's leadership position is underpinned by robust electric vehicle adoption rates and substantial investments in battery manufacturing capabilities. The presence of major automotive manufacturers and their commitment to electrification has created a strong demand for LFP battery packs. The country's advanced charging infrastructure, coupled with supportive government policies promoting clean energy adoption, has created a conducive environment for market growth. The United States has also witnessed significant investments in domestic battery production facilities, aimed at reducing dependency on imports and strengthening the local supply chain. The increasing focus on energy storage solutions and grid modernization initiatives has further expanded the application scope of LFP battery packs beyond the automotive sector. The market has also benefited from technological advancements in battery chemistry and manufacturing processes, leading to improved performance and cost-effectiveness.
North America LFP Battery Pack Market in Canada
Canada emerges as the fastest-growing market in the North American LFP battery pack industry, with a projected CAGR of approximately 99% from 2024 to 2029. The country's remarkable growth trajectory is driven by its rich mineral resources, particularly lithium and other battery materials, positioning it as a crucial player in the battery supply chain. Canada's commitment to reducing carbon emissions has led to aggressive electric vehicle adoption targets and supportive policy frameworks. The country has attracted significant investments in battery manufacturing facilities, with several international players establishing production bases to leverage local resources and expertise. The government's focus on developing a comprehensive battery ecosystem, from mining to recycling, has created numerous opportunities for market expansion. The presence of well-established research institutions and innovation centers has facilitated continuous technological advancement in battery technology. Canada's strategic location and trade relationships with the United States have also contributed to its growing importance in the North American battery supply chain. The integration of renewable energy storage solutions further enhances Canada's position in the market.
North America LFP Battery Pack Market in Other Countries
Beyond the United States and Canada, the North American LFP battery pack market encompasses other regions that contribute to the overall market dynamics. These regions have shown increasing interest in adopting battery energy storage systems, particularly in the electric vehicle and energy storage sectors. The growing awareness of environmental sustainability and the shift towards clean energy solutions have been key drivers in these markets. Local governments have implemented various initiatives to promote electric vehicle adoption and develop supporting infrastructure. The presence of manufacturing facilities and research centers has helped create a robust ecosystem for battery technology development. These regions have also benefited from knowledge transfer and technological collaborations with established players in the US and Canadian markets. The increasing focus on renewable energy integration and grid modernization has created additional opportunities for energy storage battery pack applications. The development of local supply chains and manufacturing capabilities has helped reduce dependency on imports and create new employment opportunities in the battery sector. The emergence of utility-scale battery projects is also noteworthy in these regions.
Competitive Landscape
Top Companies in North America LFP Battery Pack Market
The North American LFP battery pack market is characterized by intense innovation and strategic developments among key players. Companies are focusing on enhancing battery energy storage system capabilities, improving charging capabilities, and optimizing overall performance through sustained R&D investments. Operational excellence is being achieved through vertical integration of supply chains and the establishment of local manufacturing facilities to reduce dependence on imports. Strategic partnerships with automotive OEMs and energy storage providers are becoming increasingly common to secure long-term market positions. Companies are expanding their production capacities through new facility establishments and existing plant expansions, particularly in the United States and Canada. The industry is also witnessing significant investments in developing next-generation battery technologies, including advanced separator materials and enhanced electrolyte formulations, to improve battery life and performance.
Market Dominated by Global Battery Specialists
The North American LFP battery module market exhibits a relatively concentrated structure dominated by established global players with specialized battery manufacturing expertise. These companies leverage their extensive R&D capabilities, technological know-how, and established relationships with automotive manufacturers to maintain their market positions. The market is characterized by a mix of pure-play battery manufacturers and diversified technology companies, with Asian manufacturers particularly prominent due to their advanced manufacturing capabilities and established supply chains.
The industry is witnessing increased consolidation through strategic acquisitions and partnerships, particularly as companies seek to strengthen their technological capabilities and expand their market presence. Joint ventures between battery manufacturers and automotive companies are becoming more common, enabling vertical integration and secured supply chains. Local players are gradually emerging in the market, supported by government initiatives to develop domestic battery manufacturing capabilities and reduce dependence on imports. The competitive landscape is evolving with new entrants focusing on specialized applications and innovative battery technologies.
Innovation and Localization Drive Future Success
Success in the North American LFP battery pack market increasingly depends on companies' ability to innovate while maintaining cost competitiveness. Incumbent players must focus on continuous technological advancement, particularly in areas such as energy density improvement and fast-charging capabilities. Building strong relationships with automotive manufacturers through long-term supply agreements and joint development projects is crucial. Companies need to invest in local manufacturing facilities to benefit from government incentives and reduce supply chain vulnerabilities. Developing comprehensive recycling programs and sustainable manufacturing practices will become increasingly important for maintaining market position.
For emerging players and contenders, success lies in identifying and serving specific market niches while building technological differentiation. Companies must focus on developing innovative solutions for specific applications or customer segments rather than competing directly with established players in the mass market. Building strong partnerships with raw material suppliers and investing in advanced manufacturing capabilities will be crucial. The regulatory environment, particularly regarding environmental standards and local content requirements, will significantly influence market dynamics. Companies must also prepare for potential shifts in lithium iron phosphate battery chemistry preferences and maintain flexibility in their manufacturing capabilities to adapt to changing market demands.
North America LFP Battery Pack Industry Leaders
A123 Systems LLC
Clarios International Inc.
Contemporary Amperex Technology Co. Ltd. (CATL)
LG Energy Solution Ltd.
Primearth EV Energy Co. Ltd.
- *Disclaimer: Major Players sorted in no particular order

North America LFP Battery Pack Market Report Scope
Bus, LCV, M&HDT, Passenger Car are covered as segments by Body Type. BEV, PHEV are covered as segments by Propulsion Type. 15 kWh to 40 kWh, 40 kWh to 80 kWh, Above 80 kWh, Less than 15 kWh are covered as segments by Capacity. Cylindrical, Pouch, Prismatic are covered as segments by Battery Form. Laser, Wire are covered as segments by Method. Anode, Cathode, Electrolyte, Separator are covered as segments by Component. Cobalt, Lithium, Manganese, Natural Graphite, Nickel are covered as segments by Material Type. Canada, US are covered as segments by Country.| Bus |
| LCV |
| M&HDT |
| Passenger Car |
| BEV |
| PHEV |
| 15 kWh to 40 kWh |
| 40 kWh to 80 kWh |
| Above 80 kWh |
| Less than 15 kWh |
| Cylindrical |
| Pouch |
| Prismatic |
| Laser |
| Wire |
| Anode |
| Cathode |
| Electrolyte |
| Separator |
| Cobalt |
| Lithium |
| Manganese |
| Natural Graphite |
| Nickel |
| Other Materials |
| Canada |
| US |
| Body Type | Bus |
| LCV | |
| M&HDT | |
| Passenger Car | |
| Propulsion Type | BEV |
| PHEV | |
| Capacity | 15 kWh to 40 kWh |
| 40 kWh to 80 kWh | |
| Above 80 kWh | |
| Less than 15 kWh | |
| Battery Form | Cylindrical |
| Pouch | |
| Prismatic | |
| Method | Laser |
| Wire | |
| Component | Anode |
| Cathode | |
| Electrolyte | |
| Separator | |
| Material Type | Cobalt |
| Lithium | |
| Manganese | |
| Natural Graphite | |
| Nickel | |
| Other Materials | |
| Country | Canada |
| US |
Market Definition
- Battery Chemistry - LFP battery type is considred under the scope of battery chemistry.
- Battery Form - The types of battery forms offered under this segment include Cylindrical, Pouch and Prismatic.
- Body Type - Body types considered under this segment include, passenger cars, LCV (light commercial vehicle), M&HDT (medium & heavy duty trucks)and buses.
- Capacity - Various types of battery capacities inldude under theis segment are 15 kWH to 40 kWH, 40 kWh to 80 kWh, Above 80 kWh and Less than 15 kWh.
- Component - Various components covered under this segment include anode, cathode, electrolyte, separator.
- Material Type - Various material covered under this segment include cobalt, lithium, manganese, natural graphite, other material.
- Method - The types of method covered under this segment include laser and wire.
- Propulsion Type - Propulsion types considered under this segment include BEV (Battery electric vehicles), PHEV (plug-in hybrid electric vehicle).
- ToC Type - ToC 4
- Vehicle Type - Vehicle type considered under this segment include passenger vehicles, and commercial vehicles with various EV powertrains.
| Keyword | Definition |
|---|---|
| Electric vehicle (EV) | A vehicle which uses one or more electric motors for propulsion. Includes cars, buses, and trucks. This term includes all-electric vehicles or battery electric vehicles and plug-in hybrid electric vehicles. |
| PEV | A plug-in electric vehicle is an electric vehicle that can be externally charged and generally includes all electric vehicles as well as plug-electric vehicles as well as plug-in hybrids. |
| Battery-as-a-Service | A business model in which the battery of an EV can be rented from a service provider or swapped with another battery when it runs out of charge |
| Battery Cell | The basic unit of an electric vehicle's battery pack, typically a lithium-ion cell, that stores electrical energy. |
| Module | A subsection of an EV battery pack, consisting of several cells grouped together, often used to facilitate manufacturing and maintenance. |
| Battery Management System (BMS) | An electronic system that manages a rechargeable battery by protecting the battery from operating outside its safe operating area, monitoring its state, calculating secondary data, reporting data, controlling its environment, and balancing it. |
| Energy Density | A measure of how much energy a battery cell can store in a given volume, usually expressed in watt-hours per liter (Wh/L). |
| Power Density | The rate at which energy can be delivered by the battery, often measured in watts per kilogram (W/kg). |
| Cycle Life | The number of complete charge-discharge cycles a battery can perform before its capacity falls under a specified percentage of its original capacity. |
| State of Charge (SOC) | A measurement, expressed as a percentage, that represents the current level of charge in a battery compared to its capacity. |
| State of Health (SOH) | An indicator of the overall condition of a battery, reflecting its current performance compared to when it was new. |
| Thermal Management System | A system designed to maintain optimal operating temperatures for an EV's battery pack, often using cooling or heating methods. |
| Fast Charging | A method of charging an EV battery at a much faster rate than standard charging, typically requiring specialized charging equipment. |
| Regenerative Braking | A system in electric and hybrid vehicles that recovers energy normally lost during braking and stores it in the battery. |
Research Methodology
Mordor Intelligence follows a four-step methodology in all its reports.
- Step-1: Identify Key Variables: To build a robust forecasting methodology, the variables and factors identified in Step-1 are tested against available historical market numbers. Through an iterative process, the variables required for market forecast are set and the model is built based on these variables.
- Step-2: Build a Market Model: Market-size estimations for the historical and forecast years have been provided in revenue and volume terms. Market revenue is calculated by multiplying the volume demand with volume-weighted average battery pack price (per kWh). Battery pack price estimation and forecast takes into account various factors affecting ASP, such as inflation rates, market demand shifts, production costs, technological developments, and consumer preferences, providing estimations for both historical data and future trends.
- Step-3: Validate and Finalize: In this important step, all market numbers, variables, and analyst calls are validated through an extensive network of primary research experts from the market studied. The respondents are selected across levels and functions to generate a holistic picture of the market studied.
- Step-4: Research Outputs: Syndicated Reports, Custom Consulting Assignments, Databases & Subscription Platforms


