North America Juices Market Size and Share
Market Overview
| Study Period | 2018 - 2030 |
|---|---|
| Base Year For Estimation | 2024 |
| Forecast Data Period | 2025 - 2030 |
| Market Size (2025) | USD 46.94 Billion |
| Market Size (2030) | USD 49.31 Billion |
| Growth Rate (2025 - 2030) | 0.99% CAGR |
| Market Concentration | Low |
Major Players*Disclaimer: Major Players sorted in no particular order Image © Mordor Intelligence. Reuse requires attribution under CC BY 4.0. |
|

North America Juices Market Analysis by Mordor Intelligence
The North America Juices Market size is estimated at 46.94 billion USD in 2025, and is expected to reach 49.31 billion USD by 2030, growing at a CAGR of 0.99% during the forecast period (2025-2030).
The North American juice industry is experiencing a significant transformation driven by evolving consumer health consciousness and preferences for clean-label products. In 2022, approximately 70% of adults aged 20 and above consumed juice once or twice daily, indicating strong consumer engagement with the category. Major manufacturers are responding to this trend by reformulating their products to eliminate artificial ingredients, preservatives, and excessive sugars. Companies like Ocean Spray and Tropicana have expanded their portfolios to include organic juice variants and products with functional benefits, while smaller craft producers are gaining traction with cold-pressed and raw natural juice offerings that appeal to health-conscious consumers.
The distribution landscape for beverages is evolving rapidly, with retailers adopting innovative merchandising strategies and omnichannel approaches. Supermarkets and convenience stores are creating dedicated wellness beverage sections, while online platforms are experiencing substantial growth in juice sales. Major retailers like Walmart, Target, and Kroger are enhancing their e-commerce capabilities and implementing sophisticated cold chain management systems to ensure product quality. The industry is also witnessing the emergence of specialized juice bars and wellness centers that combine fresh juice offerings with lifestyle and nutrition services.
Sustainability has become a central focus for juice manufacturers, particularly in packaging innovation and waste reduction. Leading companies like Coca-Cola and PepsiCo have committed to making their packaging 100% recyclable, reusable, or compostable by 2025. The industry is witnessing increased adoption of eco-friendly packaging materials, with some manufacturers transitioning to plant-based PET bottles and reducing packaging weight. Suntory Group has made significant strides by introducing 100% sustainable PET bottles globally, with plans to develop prototypes using entirely plant-based materials by 2030.
Product innovation in the healthy beverage sector continues to accelerate, with manufacturers introducing novel flavor combinations and functional ingredients to meet diverse consumer preferences. The industry has seen a surge in products featuring exotic fruit blends, superfood ingredients, and enhanced nutritional profiles. In 2023, approximately 57% of consumers expressed interest in beverages offering comprehensive health benefits, including heart health, gut health, and immune support. This has led to the development of specialized product lines incorporating ingredients like probiotics, adaptogens, and natural energy boosters, while maintaining clean-label standards and minimal processing methods.
North America Juices Market Trends and Insights
Consumer perception of juices being healthier than other soft drinks, fuels segment sales
- In North America, especially in the United States, juices are often consumed, especially on special occasions, such as birthdays, holidays, and religious festivals. For example, orange juice is often served at Christmas breakfast, while cranberry juice is often served at dinner parties.
- Consumers are also interested in juices that contain specific functional ingredients, such as probiotics, antioxidants, vitamins minerals, flavonoids, and omega-3 fatty acids. These ingredients are perceived to have health benefits, such as boosting the immune system, reducing inflammation, and other benefits.
- Under the Juice segment, 100% juices have been gaining popularity among consumers due to the health benefits associated with it. The average selling price of 100% juices is valued at USD 2.65 per liter as of 2022.
- In the US, health-conscious juice trends are also on the rise. Around 40% of US juice and smoothie drinkers are drinking more juice compared to 2021 as a way of increasing their vitamin intake.
OTHER KEY INDUSTRY TRENDS COVERED IN THE REPORT
- The incorporation of superfoods, probiotics, and prebiotics has become a popular trend in the market, catering to the increasing focus on health and wellness
- Simply juice prioritizes taste and nutrition, resonating with consumers seeking natural and wholesome beverages
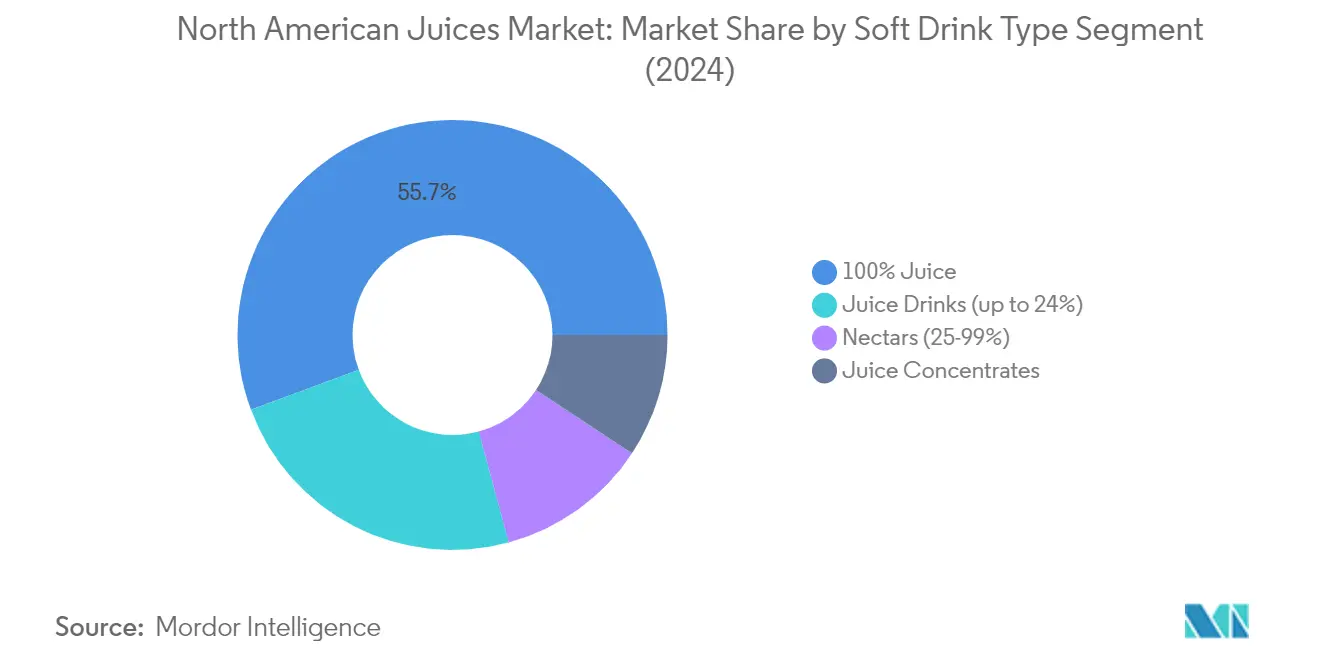
Segment Analysis: Soft Drink Type
100% Juice Segment in North American Juices Market
The 100% juice segment maintains its dominant position in the North American juices market, commanding approximately 56% of the market share in 2024. This substantial market leadership is primarily driven by increasing health consciousness among consumers who are actively seeking beverages with higher nutritional value. The segment's growth is further bolstered by the rising demand for clean-label products and natural ingredients, with consumers showing a strong preference for juices without artificial additives or preservatives. Major brands like Tropicana, Simply, and Ocean Spray have expanded their 100% juice portfolios to include innovative flavors and functional benefits, catering to evolving consumer preferences. The segment's success is also attributed to its strong presence across various distribution channels, particularly in supermarkets and convenience stores, where strategic product placement and marketing initiatives enhance visibility and accessibility.
Nectars Segment in North American Juices Market
The fruit nectar segment, comprising juices with 25-99% juice content, is emerging as the fastest-growing category in the North American juices market. This growth is driven by several factors, including increasing consumer preference for beverages that offer a balance between taste and health benefits. Manufacturers are innovating within this segment by introducing new flavor combinations and functional ingredients that appeal to health-conscious consumers. The segment's expansion is further supported by the rising popularity of exotic mixed juice blends and the incorporation of superfoods into nectar formulations. Additionally, companies are focusing on sustainable packaging solutions and clean-label ingredients to align with consumer preferences for environmentally responsible products. The segment's growth is particularly notable in premium and organic varieties, where consumers are willing to pay more for high-quality ingredients and innovative flavor profiles.
Remaining Segments in Soft Drink Type
The juice drinks (up to 24% juice) and concentrated juice segments complete the market landscape, each serving distinct consumer needs and preferences. Juice drinks cater to price-sensitive consumers and those seeking lighter beverage options, often featuring innovative flavors and functional benefits despite lower juice content. These products frequently target younger consumers and are popular in on-the-go consumption occasions. Meanwhile, the concentrated juice segment serves both retail and foodservice channels, offering convenience and cost-effectiveness. This segment has evolved to include premium varieties and organic options, responding to changing consumer preferences while maintaining its traditional appeal for budget-conscious consumers and bulk users in the foodservice industry.
Segment Analysis: Packaging Type
PET Bottles Segment in North American Juices Market
PET bottles dominate the North American juices market, commanding approximately 66% of the market share in 2024. This significant market position can be attributed to several key advantages that PET bottles offer over other packaging alternatives. Their lightweight nature and cost-effectiveness in both production and transportation make them particularly appealing to manufacturers and distributors. PET bottles also provide excellent protection against UVA spectral radiation below 315 nm, which is crucial for preventing photo-oxidative degradation that could affect the taste, color, or odor of juices. The segment's strength is further reinforced by increasing recycling rates, with post-consumer PET recycling reaching 28.6% in recent years. Major beverage companies are actively incorporating recycled PET in their packaging, responding to growing consumer demand for sustainable packaging solutions.
Metal Cans Segment in North American Juices Market
The metal cans segment is experiencing robust growth in the North American juices market, projected to achieve a growth rate of approximately 2% from 2024 to 2029. This growth is driven by several key advantages that metal cans offer, including superior protection against light, oxygen, and contamination, ensuring optimal juice freshness and flavor preservation even without refrigeration. The segment's expansion is further supported by the increasing focus on sustainability, as aluminum cans boast the highest recycling rates among all beverage containers. Metal cans are particularly appealing for outdoor activities and travel due to their durability and space-efficient design. The segment's growth is also bolstered by the rising consumer preference for tamper-evident packaging features and the ability to create visually striking, on-brand packaging designs that enhance shelf appeal.
Remaining Segments in Packaging Type
The other packaging formats in the North American juices market include aseptic packages, glass bottles, and disposable cups, each serving distinct market needs. Aseptic packages are particularly valued for their ability to maintain juice quality and extend shelf life without requiring refrigeration. Glass bottles continue to appeal to premium brands and environmentally conscious consumers due to their recyclability and perceived quality. Disposable cups cater to the on-the-go consumption trend and are commonly found in foodservice establishments. These segments collectively contribute to market diversity by offering various options for different consumption occasions and consumer preferences, while also addressing specific requirements for preservation, portability, and sustainability.
Segment Analysis: Distribution Channel
Supermarket/Hypermarket Segment in North American Juices Market
Supermarkets and hypermarkets continue to dominate the North American juices market, commanding approximately 45% of the market value in 2024. This channel's prominence can be attributed to several key factors, including its ability to offer an extensive range of fruit drink products from various brands under one roof. Major retail chains like Walmart, Albertsons, Kroger, and Whole Foods have strengthened their position by maintaining wide product assortments and competitive pricing strategies. These retailers strategically position juice products in their stores, often placing them in high-traffic areas and refrigerated sections near checkout counters to drive impulse purchases. The segment's success is further bolstered by the implementation of loyalty programs, bulk purchase discounts, and regular promotional activities that attract value-conscious consumers. Additionally, supermarkets and hypermarkets have adapted to changing consumer preferences by expanding their offerings of organic, natural, and functional juice varieties.
Online Retail Segment in North American Juices Market
The online retail channel is experiencing remarkable growth in the North American juices market, projected to expand at approximately 2% through 2029. This growth is primarily driven by the increasing adoption of e-commerce platforms and changing consumer shopping behaviors. Major online platforms like Target, Kroger, Walmart, and Instacart have enhanced their digital presence by offering user-friendly interfaces and extensive product selections. The segment's growth is further supported by the rising internet penetration rates across North America, with the United States alone recording over 311 million internet users. Online retailers are capitalizing on this trend by offering exclusive deals, subscription services, and convenient delivery options. The channel has become particularly attractive to small-to-medium-sized enterprises in the soft drinks sector, who are establishing their online presence to expand their reach and compete with larger brands.
Remaining Segments in Distribution Channel
The other significant distribution channels in the North American juices market include convenience stores, other off-trade channels, and on-trade establishments. Convenience stores have established themselves as crucial points of sale, particularly for on-the-go consumption, with their strategic locations and 24/7 operations. The on-trade segment, comprising restaurants, cafes, and juice bars, plays a vital role in introducing new flavors and premium fruit beverage offerings to consumers. Other off-trade channels, including warehouse clubs, drug stores, vending machines, and specialty stores, contribute to the market's diversity by catering to specific consumer needs and preferences. These channels often differentiate themselves through unique product offerings, specialized service, or location-based convenience, adding depth to the overall distribution landscape of the juices market.
North America Juices Market Geography Segment Analysis
Juices Market in United States
The United States dominates the North American juice market, commanding approximately 72% of the total market value in 2024. The US juice market is primarily driven by increasing consumer awareness of health and wellness, with a notable shift towards nutritious ready-to-drink beverages. The 100% fruit juice segment holds particular prominence, especially in the premium juice and organic categories, with brands like Organic Valley, Naked Juice, and Bolthouse Farms gaining significant traction. American consumers are increasingly seeking juices that offer additional functional benefits, such as immune system support and stress relief. The 2020-2025 Dietary Guidelines for Americans' endorsement of 100% fruit juices as equivalent to a serving of fruit has further legitimized juice consumption in healthy diets. Supermarket chains like Walmart, Kroger, and Costco continue to expand their juice offerings, providing consumers with diverse options across different price points and health benefit categories. The market's evolution is also shaped by innovative packaging solutions and sustainable practices, with major players increasingly adopting eco-friendly packaging alternatives.
Juices Market in Mexico
Mexico's juice market is poised for robust expansion, with projections indicating a growth rate of approximately 2% from 2024 to 2029. The market's dynamism is fueled by increasing health consciousness among Mexican consumers, particularly their growing preference for nutrition-packed beverages. Major juice manufacturers are actively embracing sustainable packaging practices, with companies like Coca-Cola and PepsiCo setting ambitious targets for reusable and recyclable packaging. The country's juices market is witnessing significant innovation in product formulations, with manufacturers introducing new flavors and functional variants to meet evolving consumer preferences. The 100% juice segment is experiencing particularly strong growth, driven by consumers seeking products with minimal added sugars and maximum nutritional benefits. Distribution channels are expanding beyond traditional retail outlets, with modern trade formats and e-commerce platforms gaining prominence. Local producers are also playing a crucial role in market development, often specializing in regional fruit varieties and traditional Mexican flavors. The market's evolution is further supported by improvements in cold chain infrastructure and processing technologies.
Juices Market in Canada
Canada's juices market exhibits distinctive characteristics shaped by the country's unique consumer preferences and regulatory environment. The market is characterized by strong innovation in packaging, pack sizes, and flavor varieties, with leading brands like Tropicana, Bolthouse Farms, and Happy Planet driving product development. Canadian consumers show a marked preference for premium juice and natural products, particularly in the 100% juice category. Health-conscious customers are increasingly seeking out beverages that offer specific functional benefits, such as immune support and gut health. The distribution landscape is dominated by supermarkets and hypermarkets, which offer an extensive range of both domestic and international juice brands. Canadian juice manufacturers are placing increased emphasis on sustainable practices and transparent sourcing, responding to growing consumer demand for environmentally responsible products. The market also benefits from strong import relationships with various countries, including the United States, Germany, Turkey, and the Netherlands, ensuring a diverse product selection for consumers.
Juices Market in Other Countries
The juices market in other North American countries, including Cuba, Greenland, Jamaica, Costa Rica, and Panama, demonstrates unique characteristics influenced by local preferences and economic conditions. These markets are experiencing transformation driven by increasing urbanization and changing consumer lifestyles. The growing health consciousness among consumers in these regions is reshaping product offerings, with manufacturers introducing more natural and functional juice variants. Distribution networks are evolving, with modern retail formats gaining ground alongside traditional channels. Local fruit varieties play a significant role in product development, offering unique flavor profiles that appeal to both domestic and international consumers. The markets are also witnessing increased penetration of international brands, bringing global trends and innovation to local consumers. Digital transformation is gradually influencing purchasing patterns, with e-commerce emerging as a viable distribution channel in more developed markets within this group.
Competitive Landscape
Top Companies in North America Juices Market
The North American juices market is characterized by intense innovation and strategic developments among major players like Tropicana Brands Group, The Coca-Cola Company, The Kraft Heinz Company, and Keurig Dr Pepper Inc. Companies are actively pursuing product innovations, particularly in developing healthier variants with reduced sugar content and enhanced nutritional profiles. Operational agility is demonstrated through investments in advanced manufacturing facilities and sustainable packaging initiatives, with many players committing to recyclable and eco-friendly packaging solutions. Strategic moves in the market primarily revolve around portfolio diversification, with companies introducing new flavors and functional beverages to meet evolving consumer preferences. Expansion strategies include both geographical growth through new manufacturing facilities and distribution networks, as well as market penetration through strategic partnerships and collaborations with retailers and distributors.
Fragmented Market with Strong Regional Players
The North American juices market exhibits a mix of global beverage conglomerates and specialized regional players, creating a relatively fragmented competitive landscape. Global giants leverage their extensive distribution networks, brand recognition, and research capabilities to maintain market leadership, while regional specialists capitalize on their local knowledge and ability to cater to specific consumer preferences. The market structure is characterized by the presence of both publicly traded corporations and agricultural cooperatives, particularly in the fruit juice segment, where farmer-owned organizations play a significant role in the supply chain.
Merger and acquisition activities in the sector are primarily driven by larger companies seeking to expand their product portfolios and geographic reach. These strategic moves often target companies with a strong regional presence or those offering innovative products in growing segments like organic and functional beverages. The market also sees vertical integration efforts, with companies acquiring suppliers to ensure control over raw material quality and supply chain efficiency. Cooperative structures remain important, especially in specific fruit segments like cranberries and grapes, where grower-owned organizations maintain significant market presence.
Innovation and Sustainability Drive Future Growth
Success in the North American juices market increasingly depends on companies' ability to innovate while maintaining sustainability commitments. Incumbent players must focus on developing products that align with health and wellness trends, including reduced sugar content, functional benefits, and clean label ingredients. Market leaders need to invest in sustainable packaging solutions and efficient production processes while maintaining strong relationships with retailers and distributors. Additionally, established companies must balance premium and value offerings to address different consumer segments while maintaining profitability.
For contenders seeking to gain market share, differentiation through unique product offerings and targeted marketing strategies is crucial. This includes focusing on niche segments, such as organic or functional beverages, where larger players may have less presence. Success also requires building strong distribution networks and establishing partnerships with retailers while maintaining competitive pricing strategies. Companies must also consider potential regulatory changes regarding sugar content and packaging sustainability, which could impact product development and manufacturing processes. The market's future will be shaped by companies' ability to adapt to changing consumer preferences while maintaining operational efficiency and environmental responsibility. The US juice drink industry is expected to see significant growth as companies innovate and adapt to these trends.
North America Juices Industry Leaders
-
Keurig Dr Pepper, Inc.
-
Ocean Spray Cranberries, Inc.
-
The Coca-Cola Company
-
The Kraft Heinz Company
-
Tropicana Brands Group
- *Disclaimer: Major Players sorted in no particular order

Recent Industry Developments
- April 2023: Martinelli's is a manufacturer of premium apple juice and have recently added organic apple juice offering.
- January 2023: Wm. Bolthouse Farms, Inc. launched three new product innovations under Bolthouse’s new "Energy" category. Each bottle contains 3 ¾ servings of fruit and veg, anchored by the company’s signature carrot juice, plus balanced energy from natural green coffee bean extract and L-Theanine.
- January 2023: Wm. Bolthouse Farms, Inc. expanded its line of feel-good nutrition with "Golden Goodness". Golden is a blend of golden-hued fruits and vegetables, such as peach, banana, mango, and yellow carrots, with a hint of passion fruit for a new flavor experience.”
North America Juices Market Report Scope
100% Juice, Juice Drinks (up to 24% Juice), Juice concentrates, Nectars (25-99% Juice) are covered as segments by Soft Drink Type. Aseptic packages, Disposable Cups, Glass Bottles, Metal Can, PET Bottles are covered as segments by Packaging Type. Off-trade, On-trade are covered as segments by Distribution Channel. Canada, Mexico, United States are covered as segments by Country.| 100% Juice |
| Juice Drinks (up to 24% Juice) |
| Juice concentrates |
| Nectars (25-99% Juice) |
| Aseptic packages |
| Disposable Cups |
| Glass Bottles |
| Metal Can |
| PET Bottles |
| Off-trade | Convenience Stores |
| Online Retail | |
| Supermarket/Hypermarket | |
| Others | |
| On-trade |
| Canada |
| Mexico |
| United States |
| Rest of North America |
| Soft Drink Type | 100% Juice | |
| Juice Drinks (up to 24% Juice) | ||
| Juice concentrates | ||
| Nectars (25-99% Juice) | ||
| Packaging Type | Aseptic packages | |
| Disposable Cups | ||
| Glass Bottles | ||
| Metal Can | ||
| PET Bottles | ||
| Distribution Channel | Off-trade | Convenience Stores |
| Online Retail | ||
| Supermarket/Hypermarket | ||
| Others | ||
| On-trade | ||
| Country | Canada | |
| Mexico | ||
| United States | ||
| Rest of North America | ||
Market Definition
- Carbonated Soft Drinks (CSDs) - Carbonated soft drinks (CSDs) refer to non-alcoholic beverages that are carbonated and typically flavored, containing dissolved carbon dioxide to create effervescence. These beverages commonly include cola, lemon-lime, orange, and various fruit-flavored sodas. Marketed in cans, bottles, or fountain dispense.
- Juices - We have considered packaged juices which encompass non-alcoholic beverages derived from fruits, vegetables, or a combination thereof, processed and sealed in various packaging formats such as bottles, cartons, or pouches. Excluding fresh juices, this market segment involves commercially prepared and preserved juices, often with added preservatives and flavors.
- Ready-to-Drink (RTD) Tea and RTD Coffee - Ready-to-Drink (RTD) tea and RTD coffee are pre-packaged, non-alcoholic beverages that are brewed and prepared for consumption without further dilution. RTD tea typically includes various tea varieties, infused with flavors and sweeteners, and comes in bottles, cans, or cartons. Similarly, RTD coffee involves pre-brewed coffee formulations, often mixed with milk, sugar, or flavorings, and is conveniently packaged for on-the-go consumption.
- Energy Drinks - Energy drinks are non-alcoholic beverages formulated to provide a quick boost of energy and alertness. Whereas, sports drinks are beverages designed to hydrate and replenish electrolytes, particularly after physical exertion, exercise, or intense activity
| Keyword | Definition |
|---|---|
| Carbonated Soft Drinks | Carbonated soft drinks (CSDs) are a combination of carbonated water and flavouring, sweetened by sugar or a non-sugar sweeteners. |
| Standard Cola | Standard Cola is defined as the original flavor of cola soda. |
| Diet Cola | A cola-based soft drink containing no or low amounts of sugar |
| Fruit Flavored Carbonates | A carbonated beverage prepared from fruit juice/fruit flavor with carbonated water and containing sugar, dextrose, invert sugar or liquid glucose either singly or in combination. It may contain peel oil and fruit essences. |
| Juice | Juice is a drink made from the extraction or pressing of the natural liquid contained in fruit and vegetables. |
| 100% Juice | Fruit/vegetable juice made from fruit in the form of its juice with no water added to make up the volume. It is not permitted to add sugars, sweeteners, preservatives, flavourings or colourings to fruit juice. |
| Juice Drinks (up to 24% Juice) | Fruit/vegetable juice drinks with up to 24% fruits/vegetable extract. |
| Nectars (25-99% Juice) | Juices that can have between 25 and 99% of fruit, with the minimum legal limits defined depending on the type of fruit |
| Juice concentrates | Juice Concentrates are those form of juices when most of this liquid is removed resulting in a thick, syrupy product known as juice concentrate. |
| RTD Coffee | Packaged coffee beverages that are sold in a prepared form and are ready for consumption at the time of purchase. |
| Iced Coffee | An iced coffee is a cold version of coffee, usually a combination of hot espresso and milk with ice added to it. |
| Cold Brew Coffee | Cold brew also called cold water extraction or cold pressing is made by steeping ground coffee in room-temperature water for several hours. |
| RTD Tea | Ready-to-drink (RTD) tea is a packaged tea product ready for immediate consumption without brewing or preparation |
| Iced Tea | Ice tea or iced tea is a drink made from tea without milk but with sugar and sometimes fruit flavourings, drunk cold. |
| Green Tea | Green tea is a tea beverage which promotes mental alertness, relieving digestive symptoms and promoting weight loss. |
| Herbal Tea | Herbal tea beverages are made from the infusion or decoction of herbs, spices, or other plant material in hot water. |
| Energy Drink | A type of drink containing stimulant compounds, usually caffeine, which is marketed as providing mental and physical stimulation. They may or may not be carbonated and may also contain sugar, other sweeteners, or herbal extracts, among numerous possible ingredients. |
| Sugar-free or Low-calories Energy Drinks | Sugar-free or Low-calories Energy Drinks are sugar-free, artificially sweetened energy drinks with few or no calories. |
| Traditional Energy Drink | Traditional Energy Drinks are functional soft drinks containing ingredients designed to boost the consumer's energy. |
| Natural/Oraganic Energy Drinks | Natural/Organic energy drinks are energy drinks free of artificial sweeteners and synthetic colorings. Instead, they contain naturally derived ingredients such as green tea, yerba mate, and botanical extracts. |
| Energy Shots | A small but highly concentrated energy drink that contains large amounts of caffeine and/or other stimulants. The quantity is comparatively smaller compared to energy drinks. |
| Sports Drink | Sports drinks are beverages designed specifically for the rapid supply of fluid, carbohydrates, and electrolytes before, during or after exercise. |
| Isotonic | Isotonic drinks contain similar concentrations of salt and sugar as in the human body, and are designed to quickly replace fluids lost during exercise but with an increase of carbohydrate. |
| Hypertonic | Hypertonic drinks have a higher concentration of salt and sugar than the human body. They are best drunk after exercise as it is important to replace glycogen levels quickly after exercise. |
| Hypotonic | Hypotonic drinks are designed to quickly replace fluids lost during exercise. They have very low carbohydrate content and a lower concentration of salt and sugar than the human body. |
| Electrolyte-Enhanced Water | Electrolyte water is water infused with electrically-charged minerals, such as sodium, potassium, calcium, and magnesium. |
| Protein-based Sport Drinks | Protein-based sports drinks are those sports drinks which has added protein in it that will improve performance and reduce muscle protein breakdown. |
| On-Trade | The on-trade refers to places that sell beverages for immediate consumption on the premises like bars, restaurants, and pubs |
| Off-Trade | Off-trade usually means places like liquor stores, supermarkets and other places where you don't consume the beverage right away. |
| Convenience Store | A retail business that provides the public with a convenient location to quickly purchase a wide variety of consumable products and services, generally food and gasoline. |
| Specialty store | A specialty store is a shop/store that carries a deep assortment of brands, styles, or models within a relatively narrow category of goods |
| Online Retail | Online retail is a type of eCommerce whereby a business sells goods or services directly to consumers from a website. |
| Aseptic Packaging | Aseptic packaging refers to the filling of a cold, commercially sterile product under sterile conditions into a presterilized container and closure under sterile conditions to form a seal that effectively excludes microorganisms. These includes tetra packs, cartons, pouches etc. |
| PET Bottle | PET bottle means a bottle made of polyethylene terephthalate. |
| Metal Cans | Metal containers made of aluminum or tin- plated or zinc-plated steel, which are commonly used for packaging food, beverages or other products. |
| Disposable Cups | Disposable Cup means a cup or other container designed for single use to serve beverages, such as water, cold drinks, hot drinks and alcoholic beverages. |
| Gen Z | A way of referring to the group of people who were born in the late 1990s and early 2000s. |
| Millenial | Anyone born between 1981 and 1996 (ages 23 to 38 in 2019) is considered a Millennial |
| Taurine | Taurine is an amino acid that supports immune health and nervous system function. |
| Bars & Pubs | It is a drinking establishment licensed to serve alcoholic drinks for consumption on the premises. |
| Café | It is a foodservice establishment serving refreshments (mainly coffee) and light meals. |
| On the go | It means doing / dealing with while busily engaged with something and not diverting plans in order to accommodate. |
| Internet Penetration | The Internet Penetration Rate corresponds to the percentage of the total population of a given country or region that uses the Internet. |
| Vending Machine | A machine that dispenses small articles such as food, drinks, or cigarettes when a coin or token is inserted |
| Discount store | A discount store or discounter offers a retail format in which products are sold at prices that are in principle lower than an actual or supposed "full retail price". Discounters rely on bulk purchasing and efficient distribution to keep down costs. |
| Clean Label | Clean label on the beverage market are drinks that are made from few ingredients of natural origin and are not or only slightly processed. |
| Caffeine | An alkaloid compound which is a stimulant of the central nervous system. It is mainly used recreationally, as a mild cognitive enhancer to increase alertness and attentional performance. |
| Extreme sport | Action sports, adventure sports or extreme sports are activities perceived as involving a high degree of risk. |
| High-intensity interval training | It incorporates several rounds that alternate between several minutes of high intensity movements to significantly increase the heart rate to at least 80% of one's maximum heart rate, followed by short periods of lower intensity movements. |
| Shelf life | The length of time for which an item remains usable, fit for consumption, or saleable. |
| Cream Soda | Cream soda is a sweet soft drink. Generally flavored with vanilla and based on the taste of an ice cream float |
| Root Beer | Root beer is a sweet North American soft drink traditionally made using the root bark of the sassafras tree Sassafras albidum or the vine of Smilax ornata as the primary flavor. Root beer is typically, but not exclusively, non-alcoholic, caffeine-free, sweet, and carbonated. |
| Vanilla Soda | A carbonated soft drink flavoured with vanilla. |
| Dairy-Free | A product that does not contain any milk or milk products from cows, sheep or goats. |
| Caffeine-Free Energy Drinks | Caffeine-free energy drinks rely on other ingredients to boost the energy. Popular choices include amino acids, B vitamins, and electrolytes. |
Research Methodology
Mordor Intelligence follows a four-step methodology in all our reports.
- Step-1: IDENTIFY KEY VARIABLES: In order to build a robust forecasting methodology, the variables and factors identified in Step 1 are tested against available historical market numbers. Through an iterative process, the variables required for market forecast are set, and the model is built on the basis of these variables.
- Step-2: Build a Market Model: Market-size estimations for the forecast years are in nominal terms. Inflation is not a part of the pricing, and the average selling price (ASP) is kept constant throughout the forecast period for each country.
- Step-3: Validate and Finalize: In this important step, all market numbers, variables, and analyst calls are validated through an extensive network of primary research experts from the market studied. The respondents are selected across levels and functions to generate a holistic picture of the market studied.
- Step-4: Research Outputs: Syndicated reports, custom consulting assignments, databases & subscription platforms


