
Market Overview
| Study Period | 2020 - 2031 |
|---|---|
| Forecast Data Period | 2026 - 2031 |
| Base Year Market Size (2025) | USD 552 Billion |
| Market Size (2026) | USD 591.58 Billion |
| Market Size (2031) | USD 836.31 Billion |
| Growth Rate (2026 - 2031) | 7.17% CAGR |
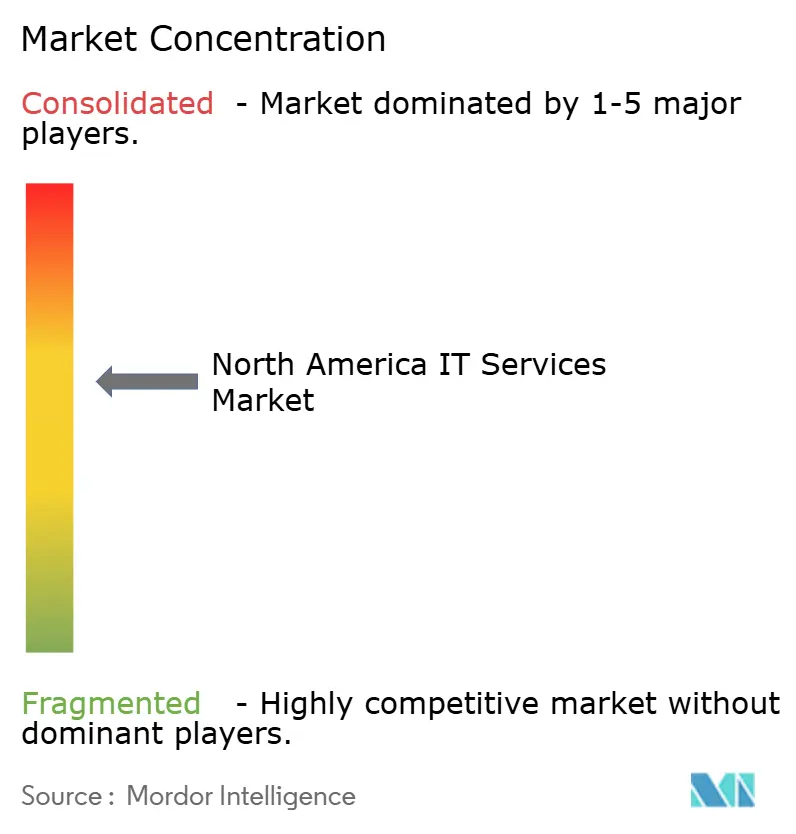
| Market Concentration | Medium |
Major Players *Disclaimer: Major Players sorted in no particular order Image © Mordor Intelligence. Reuse requires attribution under CC BY 4.0. | |
North America IT Services Market Analysis by Mordor Intelligence
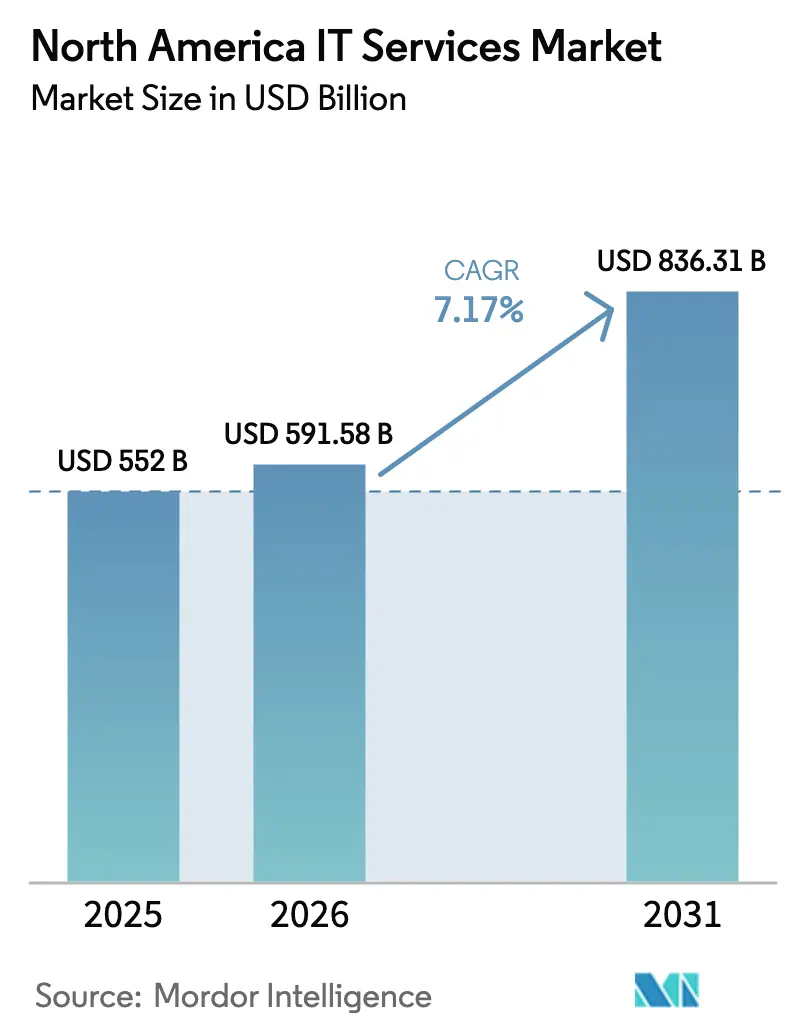
The North America IT Services market size was valued at USD 552 billion in 2025 and estimated to grow from USD 591.58 billion in 2026 to reach USD 836.31 billion by 2031, at a CAGR of 7.17% during the forecast period (2026-2031). Record enterprise outlays on large-scale cloud migration, intensifying adoption of AI-enabled platforms, and wide-scale zero-trust roll-outs underpin this momentum. North America accounts for 40% of global IT spending and posted a 10.2% increase in 2025, highlighting the region’s centrality to worldwide digital transformation. Boards are demanding technology projects that translate directly into revenue lift or cost take-out, steering contracts toward providers that can tie technical delivery to measurable outcomes. Near-shore talent hubs in Latin America, offering 25%-40% cost savings versus US rates, are easing the skills crunch while preserving real-time collaboration. Heightened cyber-threats, evolving data-sovereignty mandates, and higher capital costs introduce execution complexity but simultaneously create advisory opportunities for compliance-savvy providers.
Key Report Takeaways
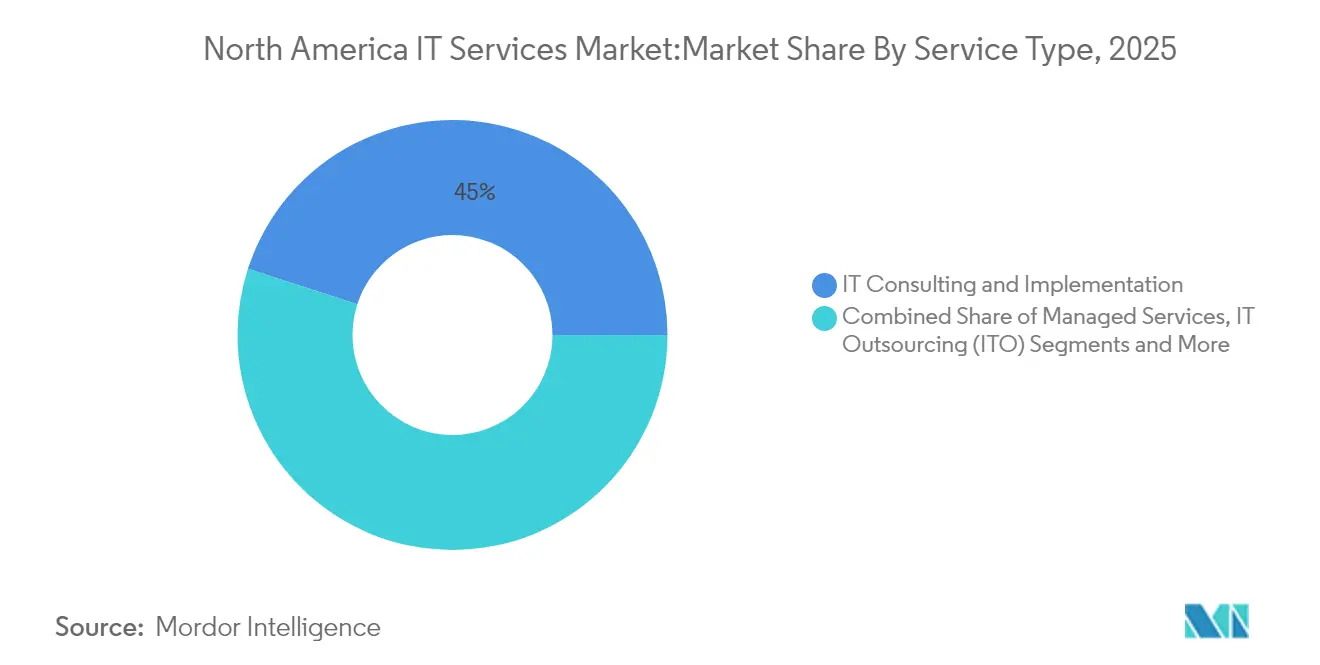
- By service type, IT consulting and implementation led with 45.02% of North America IT Services market share in 2025, while managed services is expanding fastest at an 8.22% CAGR through 2031.
- By deployment model, on-premise solutions commanded 67.12% share of the North America IT Services market size in 2025, but cloud deployment is advancing at a 8.71% CAGR.
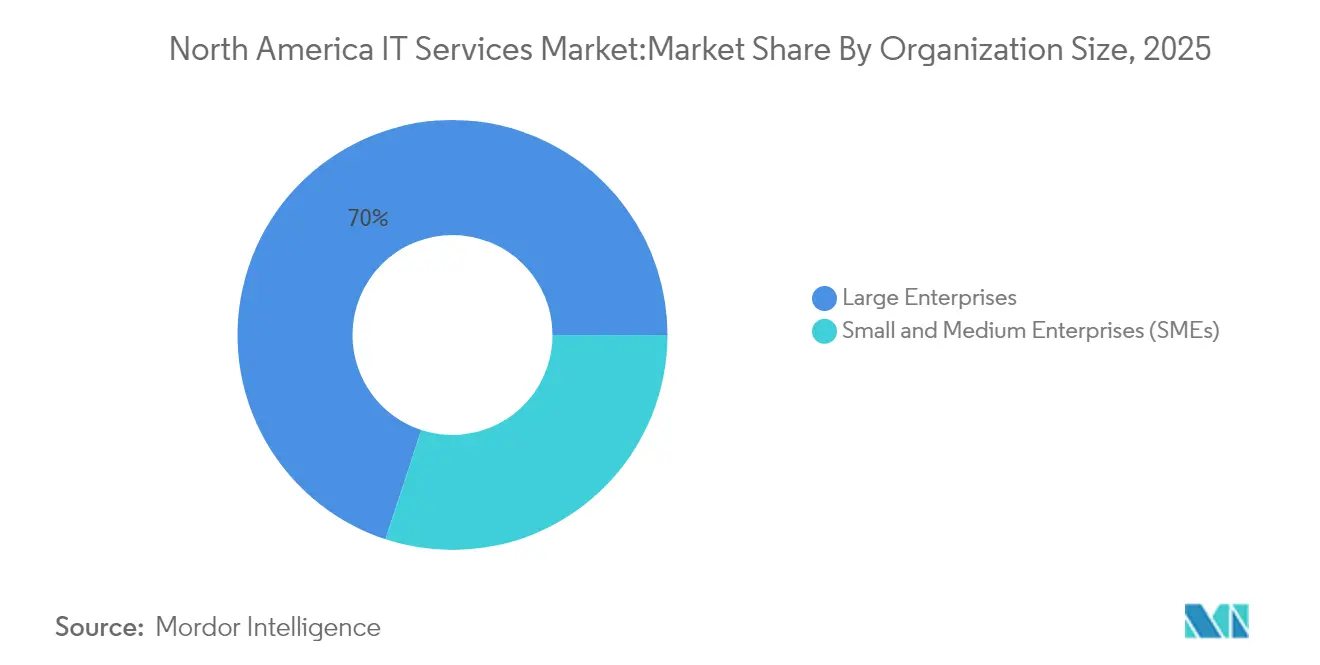
- By organization size, large enterprises held 69.95% revenue share in 2025, whereas SMEs are poised to grow at an 8.36% CAGR through 2031.
- By end-user industry, BFSI captured 29.55% of the North America IT Services market size in 2025; healthcare and life sciences is tracking the highest CAGR at 7.42% through 2031.
- By country, the United States retained 40.60% of North America IT Services market share in 2025, while Canada is projected for an 7.86% CAGR to 2031.
Note: Market size and forecast figures in this report are generated using Mordor Intelligence’s proprietary estimation framework, updated with the latest available data and insights as of 2026.
North America IT Services Market Trends and Insights
Drivers Impact Analysis*
| Driver | (~) % Impact on CAGR Forecast | Geographic Relevance | Impact Timeline |
|---|---|---|---|
| Acceleration of enterprise-wide digital transformation | +2.1% | North America and EU | Medium term (2-4 years) |
| Rapid cloud and hybrid-multi-cloud migration | +1.8% | Global, early gains in US, Canada | Short term (≤2 years) |
| Escalating cyber-security and zero-trust adoption | +1.4% | North America core, spill-over LATAM | Medium term (2-4 years) |
| Near-shore talent hubs ease US skills gap | +0.9% | US-LATAM corridor, Canada-Mexico | Long term (≥4 years) |
| Outcome-based pricing unlocks mid-market demand | +0.7% | North America, expanding Mexico | Medium term (2-4 years) |
| Managed GenAI accelerators as a service | +1.2% | US-led, Canada following | Short term (≤2 years) |
| Source: Mordor Intelligence | |||
Acceleration of Enterprise-Wide Digital Transformation
Seventy-two percent of digital leaders expect bigger 2025 budgets, signaling that transformation has evolved into full business-model reinvention. North American firms spend an average of USD 33 million annually on IT, reflecting higher adoption rates and labor costs. Contracts increasingly embed AI-driven decision support, autonomous operations, and real-time customer-engagement platforms, granting providers multi-year revenue visibility.
Rapid Cloud and Hybrid-Multi-Cloud Migration
Hybrid architectures balance performance, compliance, and cost across hyperscalers; 75% of IT workloads are forecast to run in the cloud by 2027. Enterprises adopt multi-cloud to avoid vendor lock-in, prompting demand for orchestration and governance services. The top three hyperscalers hold 67% market share, yet users diversify to lower concentration risk.
Escalating Cyber-Security and Zero-Trust Adoption
Ninety percent of cloud-migrating organizations embrace zero-trust, but only 22% of IT leaders feel confident about their cloud security posture[1]Zscaler, “Zero-Trust State of Adoption 2024,” zscaler.com. US federal Executive Order 14028 requires agencies to implement zero-trust, catalyzing private-sector adoption.
Near-Shore Talent Hubs Ease US Skills Gap
The US faces a projected 1.2 million developer shortfall by 2026, motivating enterprises to tap Latin American hubs where Mexico alone supports 723,000 software engineers. Near-shoring delivers 25%-40% savings and aligns working hours, accelerating 20% annual outsourcing growth.
Restraints Impact Analysis*
| Restraint | (~) % Impact on CAGR Forecast | Geographic Relevance | Impact Timeline |
|---|---|---|---|
| Data-sovereignty and compliance complexity | -1.6% | US-EU corridors, global | Long term (≥4 years) |
| Acute talent shortage and wage inflation | -2.3% | North America core, near-shore hubs | Medium term (2-4 years) |
| Carbon-disclosure rules hinder data-center outsourcing | -0.8% | North America and EU | Medium term (2-4 years) |
| Higher interest-rate-driven contract risk aversion | -1.1% | North America, spill-over Canada | Short term (≤2 years) |
| Source: Mordor Intelligence | |||
Data-Sovereignty and Compliance Complexity
Fragmented privacy rules are forcing enterprises to operate overlapping frameworks that raise cost and architectural complexity. Region-specific mandates such as enhanced AI transparency rules in the EU and state-level statutes in California, Oregon, and Texas demand localized processing and real-time auditability. Multi-cloud environments must integrate data-localization controls, adding orchestration overhead[2]Secure Privacy, “US State-Level Privacy Tracker,” secureprivacy.ai. Specialized governance platforms and legal advisory services are increasingly bundled into transformation deals, influencing project timelines and pricing in the North America IT Services market.
Acute Talent Shortage and Wage Inflation
Median IT wages are projected to rise 3.3% in 2025, with AI and software engineering premiums exceeding 5%. Scarcity-driven salary inflation squeezes provider margins and lifts project costs for clients. Upskilling programs, low-code automation, and academic alliances are mitigating the gap but cannot fully offset near-term pressure. Labor scarcity remains the single largest brake on delivery capacity across the North America IT Services industry.
*Our forecasts treat driver/restraint impacts as directional, not additive. The impact forecasts reflect baseline growth, mix effects, and variable interactions.
Segment Analysis
By Service Type: Consulting Drives Transformation Complexity
IT consulting and implementation held 45.02% of North America IT Services market share in 2025, underlining the premium placed on strategic guidance and change management. Engagements now encompass AI-infused business-process redesign, regulatory alignment, and data-governance blueprints. Managed services, forecasting an 8.22% CAGR, capture demand for predictable, outcome-linked operations across hybrid estates. Growth is fueled by AI-enabled service desks, AIOps platforms, and proactive incident prevention. The IT outsourcing segment remains resilient, offering cost optimization and access to scarce skills, while BPO is evolving toward intelligent automation. Emergent categories such as AI-as-a-service and quantum advisory signal future white-space, though they collectively account for a modest slice of the current North America IT Services market.
Providers are reshaping portfolios via M&A, deploying roughly USD 20 billion annually to bolt on automation, cybersecurity, and vertical-domain capabilities. Successful integrators standardize delivery frameworks early, accelerate cross-selling, and embed unified service catalogs. Those who stumble on post-merger integration leave value on the table for nimble competitors.


By Deployment Model: Hybrid Architectures Reshape Infrastructure
On-premise installations still represent 67.12% of 2025 revenue, but their role has shifted to anchor nodes within highly distributed fabrics. The cloud cohort, slated for parity by 2031 on a 8.71% CAGR, centers on workload portability, data-resident compliance, and elastic scaling for AI training. The North America IT Services market size for cloud services is expanding fastest in regulated verticals, where sovereign-cloud variants provide compliance assurance without sacrificing hyperscale benefits.
Market-leading providers differentiate through end-to-end observability, edge-to-core data integration, and cross-platform policy enforcement. Demand is especially strong for re-platforming legacy applications onto Kubernetes, implementing service mesh architectures, and instituting FinOps practices that optimize spend against value benchmarks.
By Organization Size: SMEs Accelerate Digital Adoption
Large enterprises generated 69.95% of 2025 revenue by orchestrating multi-tower transformation programs spanning cloud modernization, AI analytics, and zero-trust security. Yet SMEs, propelled by an 8.36% CAGR, are the fastest-expanding customer cohort as self-service cloud portals and outcome-based contracts level the playing field. The North America IT Services market size for SME-focused offerings is buoyed by bundled managed services that simplify compliance and cybersecurity.
Providers targeting this segment streamline onboarding through automation, standardized templates, and verticalized best-practice libraries. Price transparency, modular add-ons, and pay-as-you-grow options resonate with budget-conscious owners, driving penetration in manufacturing, professional services, and digital-native retail.
By End-User Industry: Financial Services Lead Digital Investment
BFSI contributed 29.55% of North America IT Services market size in 2025, driven by mandates to modernize payment rails, combat fraud, and comply with evolving regulations. Banks are embedding AI into underwriting and KYC, adopting blockchain for settlement, and migrating core platforms to cloud environments certified for high-risk workloads. Healthcare and life sciences, posting a 7.42% CAGR, accelerates digital front-door initiatives, clinical decision support, and data-driven research. Providers with HIPAA-aligned architectures and FDA-compliant validation services win share.
Government programs prioritize citizen-experience portals, cybersecurity hardening, and open-data initiatives, sustaining stable spend despite budget scrutiny. Manufacturing invests in Industry 4.0—IoT sensors, digital twins, and predictive maintenance—while retail focuses on supply-chain visibility and omnichannel personalization. Cross-industry, demand converges on AI governance, data-trust frameworks, and sustainability analytics.
Geography Analysis
The United States anchors the North America IT Services market, delivering unabated demand across Fortune 500 modernization programs, mid-market cloud migrations, and federal-agency cyber mandates. Project pipelines concentrate on AI-assisted DevOps, low-code platform roll-outs, and secure software supply chain frameworks. Government incentives for semiconductor reshoring and critical-infrastructure hardening amplify spending on edge computing and OT security.
Canada’s growth outpaces regional averages as public-sector modernization dovetails with private-sector AI experimentation in fintech, clean-tech, and digital commerce. The Canadian cybersecurity space, valued at USD 12.96 billion in 2024, is driving vendor investment in SOC-as-a-service and zero-trust consulting. Government sponsorship of quantum research labs seeds next-generation opportunities, although a 3.2% pullback in federal S&T budgets for 2024 introduces short-term funding pressure.
Mexico’s momentum stems from its expanding engineer base, stable macro-fundamentals, and proximity to US demand centers. Hybrid-cloud adoption in the country is forecast to rise from 45% in 2024 to 58% by 2026, fueling demand for migration, managed security, and latency-optimized network services. Hyperscaler commitments from Microsoft, Google, and AWS are turning the region into a data-center hub, although energy-supply constraints and skills availability remain watchpoints. With AI spending expected to rise 2.4 times by 2025, Mexico offers providers both delivery-center leverage and a growing domestic client base.
Regulatory Landscape
North America IT services delivery is shaped by federal guidance and state-by-state requirements, especially on AI, privacy, and cybersecurity. In 2026, multiple US states enacted restrictions on certain AI uses in healthcare and insurance, including Alabama and Georgia for health insurance, and Colorado and Nebraska for mental healthcare. That has expanded compliance and model-governance workstreams inside broader transformation programs.
On cybersecurity, NIST frameworks remain the backbone for many private-sector security and privacy programs, and federal procurement continues to pull commercial practices forward, particularly for zero-trust and secure cloud operations. IoT and critical-infrastructure security requirements are also becoming more formalized through labeling and coordination mechanisms. The FCC named the ioXt Alliance as the lead administrator for the US Cyber Trust Mark IoT labeling program on April 13, 2026, reinforcing demand for testing, compliance documentation, and secure-by-design engineering services across connected-device ecosystems. For government IT buying, the US General Services Administration (GSA) uses the Federal Integrated Business Framework (FIBF) and the IT Cost Transparency Taxonomy to manage IT investment data, while the IT Sector Coordinating Council (IT SCC) supports collaboration between industry and CISA/DHS on resilience. This influences vendor qualification, reporting expectations, and delivery controls for public-sector contracts.
Value Chain Analysis
The North America IT services value chain covers strategy and architecture consulting, application and data engineering, cloud and platform migration, cybersecurity and risk services, and ongoing operations via managed services. Hyperscalers, including AWS and Microsoft Azure, and platform vendors sit upstream as infrastructure and toolchain providers, while global integrators and specialist firms handle systems integration, DevSecOps, FinOps, and verticalized solutions. Delivery is increasingly organized around unified delivery platforms that connect proprietary assets, including provider AI tooling, with hyperscaler services, supported by partner ecosystems used to accelerate migration factories, security operations modernization, and data-platform rollouts.
Assurance, governance, and supply-chain security are embedded across the chain, from design through operations. US government emphasis on ICT supply chain resilience has raised scrutiny of software components, open-source dependency, and third-party infrastructure. As a result, providers are incorporating automated controls, continuous compliance, and third-party risk management into delivery lifecycles. On the buyer side, procurement requirements and public-private coordination bodies such as CISA-linked sector structures shape service qualification, reporting, and incident response expectations, which increases the prominence of compliance advisory and managed security within end-to-end contracts.
Competitive Landscape
Competitive intensity remains high yet structurally nuanced. Global integrators—IBM, Accenture, and Microsoft—maintain breadth across consulting, cloud, and managed services, capturing scale efficiencies and wallet share. Mid-tier challengers leverage deep vertical expertise and platform-centric delivery to outmaneuver larger rivals in specific niches. Annual deal flow of roughly 100 acquisitions worth USD 20 billion underscores a race to secure advanced analytics, cybersecurity, and automation capabilities.
Despite the volume, fewer than 20% of acquisitions fully unlock cross-sell synergies, creating an opening for agile firms with disciplined integration playbooks. Cloud-native entrants harness infrastructure-as-code, AIOps, and DevSecOps pipelines to deliver faster, cheaper, and more transparent services. Near-shore specialists combine cost competitiveness with aligned time zones, while AI-native consultancies exploit proprietary large-language-model frameworks to accelerate delivery and differentiate intellectual property.
Strategic investments focus on outcome-based service frameworks, AI-driven service catalogs, and sustainability dashboards that quantify carbon savings. Providers embedding predictive analytics into managed contracts can guarantee uptime and performance, translating technical SLAs into board-level KPIs. Emerging battlegrounds include hybrid-cloud data-fabric orchestration, AI ethics and compliance advisory, and industry-specific digital twins.
North America IT Services Industry Leaders
IBM
Microsoft Corporation
TCS Limited
Wipro Limited
Amazon Web Services (AWS) Professional Services
- *Disclaimer: Major Players sorted in no particular order

Market Opportunities and Future Outlook
Enterprise adoption of Copilot-style productivity and agentic workflows is widening the addressable scope for IT services, spanning operating-model redesign, security hardening, and application refactoring in addition to deployment. As of December 2025, Microsoft reported that companies including TCS, Wipro, Cognizant, and Infosys had deployed over 50,000 Microsoft Copilot licenses each. That base supports follow-on demand for identity governance, SOC modernization, data-platform readiness, and change management linked to measurable business outcomes. Providers are responding with packaged accelerators and managed operations around these tools, creating whitespace for mid-market buyers that want standardized implementation patterns and ongoing governance without building large internal AI operations teams.
Partner-led transformation motions are also generating new entry points for multi-year managed services and modernization programs, particularly in cloud, security, and mainframe-to-cloud modernization. IBM launched a dedicated Microsoft Practice in July 2026 for AI and cloud transformation, and AWS and IBM showcased joint agentic AI and modernization solutions at IBM Think 2026, reinforcing that hyperscaler alliances are a key route to market for complex hybrid estates. In parallel, the US public sector continues to anchor large-scale modernization and cybersecurity work, supported by structured IT investment management approaches within GSA, including FIBF. That approach increases demand for providers that can translate compliance and transparency requirements into repeatable delivery, controls, and reporting.
Recent Industry Developments
- July 2026: IBM announced general availability of Lightwell, a $5 billion investment in frontier AI capabilities and engineering resources to address open-source software vulnerabilities. The initiative expands IBM's AI platform and risk mitigation services, potentially reshaping competitive dynamics in AI-enabled IT services.
- July 2026: IBM Consulting and Microsoft strengthened their partnership to help clients modernize security operations and protect hybrid cloud identities using Microsoft Sentinel and Microsoft Defender XDR combined with IBM TDR Cloud Native services. The collaboration embeds IBM and Microsoft offerings in security operations, potentially driving cross-sell and larger managed-security wins in North American IT services.
- July 2026: IBM Consulting launched a dedicated Microsoft Practice within IBM Consulting to deliver solutions for AI, cloud, and security transformations, utilizing Microsoft Copilot, Azure OpenAI, and Fabric. The focused practice signals targeted capability expansion in AI, cloud, and security projects, potentially shifting project mix toward IBM-led Microsoft-enabled pipelines.


Research Methodology Framework and Report Scope
Market Definition and Coverage
For this study, the market includes spending on outsourced and project-based IT services delivered to organizations across North America, covering planning, building, running, and securing IT environments in value terms.
Scope exclusions: We exclude packaged software license revenue, pure connectivity services, and sales of IT hardware as standalone products.
Segmentation Overview
- By Service Type
- IT Consulting and Implementation
- Managed Services
- IT Outsourcing (ITO)
- Business Process Outsourcing (BPO)
- Other Service Types
- By Deployment Model
- On-premise
- Cloud
- By Organization Size
- Large Enterprises
- Small and Medium Enterprises (SMEs)
- By End-user Industry
- BFSI
- Government and Public Sector
- Manufacturing
- Healthcare and Life Sciences
- Retail and Consumer Goods
- Logistics and Transportation
- Other End-user Industries
- By Country
- United States
- Canada
- Mexico
Data Sources, Market Sizing, and Validation
Desk Research
We start with desk research to pin down the demand context and the boundaries of what gets counted as an IT service versus adjacent tech spend. Public sources are used to ground the model in repeatable indicators, such as official IT spending series and macro drivers for the US, Canada, and Mexico.
Sources referenced include publications and datasets such as the US Bureau of Economic Analysis, the US Census Bureau (including services-related series where applicable), Statistics Canada, the OECD, and the World Bank, followed by supporting reads from company annual reports, investor presentations, and reputable business press. Where it helps with company revenue splits and cross-checking service line exposure, we also use paid databases for company financials and news, and patent databases to sense where investment is flowing. This list is illustrative only, and additional sources were used for data collection, validation, and clarification during the work.
Primary Interviews and Surveys
Primary work was used to sanity-check what enterprises are actually buying now, and how pricing and delivery mix is shifting across consulting, managed services, and outsourcing. We spoke with a mix of buyers, service delivery leaders, and channel-facing roles across the US, Canada, and Mexico, so assumptions around contract duration, renewal behavior, and rate cards could be adjusted to match real purchasing patterns.
Distribution of primary research fieldwork respondents
| Company type | Respondent position | Region |
|---|---|---|
| Top tier: 29% | CXOs: 19% | |
| Mid tier: 52% | Functional/Unit leaders: 23% | |
| Smaller Players: 19% | Managers: 58% |
Market-Sizing & Forecasting
Sizing is built using a top-down reconstruction where regional IT spend pools are translated into serviceable demand using service intensity assumptions, outsourcing propensity, and delivery mix by country. Once the demand pool is framed, results are corroborated with selective bottom-up approximations, such as sampled provider revenue splits by geography, channel checks on large contract activity, and an ASP x volume logic for common service motions.
Key inputs that shape the model include enterprise IT budget growth, cloud migration and managed cloud adoption, cybersecurity and zero-trust program momentum, labor availability and wage inflation for delivery roles, and the mix shift between project-based work and recurring managed services. Since pricing can move faster than volumes in this market, we track rate card movement and discounting patterns, and then apply them consistently to the service mix rather than using a single flat inflation factor.
For forecasting, we use scenario analysis supported by a light multivariate regression layer, where the main drivers are the IT spending outlook, macro conditions, and the pace of cloud and security initiatives. When bottom-up signals are missing for a smaller country or niche service line, we bridge the gap using peer ratios and buyer-side budgeting patterns, and then re-check totals against independent spend indicators.
Data Validation & Update Cycle
Outputs are validated through stepwise checks, starting with internal consistency across countries and service categories, followed by variance checks against independent indicators such as overall IT spending growth, reported large deal activity, and directional shifts in outsourcing. Outliers are investigated and either corrected through revised assumptions or retained with a written rationale that can be revisited.
Before sign-off, the model and assumptions go through multiple analyst reviews, and experts are re-contacted when pricing, growth, or scope feedback conflicts with desk signals. Reports are refreshed annually, and interim updates are made when material events shift budgets or delivery capacity. Right before publication, a fresh data pass is completed so clients receive the latest view available at the time of release.
Mordor Intelligence's North America IT Services Market Size Compared Against Other Published Estimates
Published values for North America IT services often differ because of the timing of the currency conversion, how blended service pricing is handled, and how quickly assumptions are refreshed, all of which can change the final number. Differences also come from what gets treated as an IT service versus adjacent tech spend, especially when bundles include software, cloud consumption, or telecom elements.
In this study, monthly FX timing, rate card movement, and buyer-side validation checks are treated as ongoing inputs, which is why the 2025 snapshot can look different from older base-year views reported elsewhere. This modeling cadence is also used during the updates tied to Mordor Intelligence.
Benchmark comparison
| Source | Market Size | Gaps in Research Methodology |
|---|---|---|
| Mordor Intelligence | USD 552 B (2025) | |
| Global Consultancy A | USD 500 B (2022) | Uses an older base year, and the scope can drift when bundled tech spend is captured under IT services without consistently separating software and cloud consumption from services. |
| Trade Publication B | USD 701 B (2027) | Forward year is presented without a clear price-volume split, and headline values can be sensitive to aggressive ASP uplift assumptions and simplified FX timing across the forecast window. |
The spread in the table is mainly explained by base-year choice, boundary decisions around bundled spend, and how pricing and FX are applied through time. By keeping pricing logic explicit and re-checking totals against buyer signals, the estimate stays traceable to a clear demand pool and repeatable steps.


Key Questions Answered in the Report
What is the current size of the North America IT Services market?
The market reached USD 591.58 billion in 2026 and is projected to grow to USD 836.31 billion by 2031 at a 7.17% CAGR.
Which service type holds the largest share?
IT consulting and implementation leads with 45.02% of 2025 revenue, reflecting demand for strategic guidance in complex transformation programs.
Why are managed services growing faster than other segments?
Outcome-based pricing, AI-powered service automation, and the need for 24/7 hybrid-cloud management are driving an 8.22% CAGR in managed services.
Which country is the fastest-growing market?
Canada is forecast to expand at an 7.86% CAGR through 2031 thanks to supportive government digital strategies and rising cybersecurity investment.
What is the biggest restraint on market growth?
A severe talent shortage is inflating wages and limiting delivery capacity, trimming the CAGR outlook by an estimated 2.3%.
How are providers differentiating in a crowded competitive landscape?
Leading firms embed AI into service delivery, invest in near-shore talent hubs, and adopt outcome-based contracts that tie fees to client business results.
Page last updated on:






