
North America Insulated Shipping Containers Market Size and Share
Market Overview
| Study Period | 2020 - 2031 |
|---|---|
| Forecast Data Period | 2026 - 2031 |
| Base Year Market Size (2025) | USD 1.85 Billion |
| Market Size (2026) | USD 1.97 Billion |
| Market Size (2031) | USD 2.68 Billion |
| Growth Rate (2026 - 2031) | 6.37 % |
| Market Concentration | Medium |
Major Players *Disclaimer: Major Players sorted in no particular order Image © Mordor Intelligence. Reuse requires attribution under CC BY 4.0. | |
North America Insulated Shipping Containers Market Analysis by Mordor Intelligence
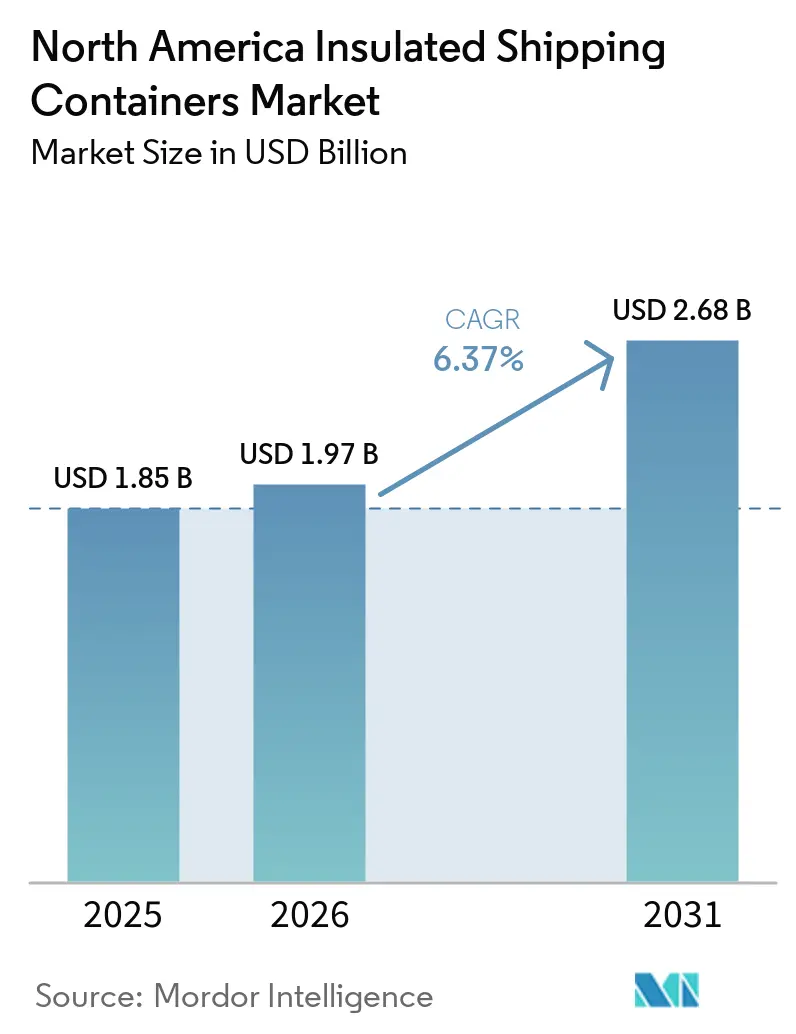
North America insulated shipping containers market size in 2026 is estimated at USD 1.97 billion, growing from 2025 value of USD 1.85 billion with 2031 projections showing USD 2.68 billion, growing at 6.37% CAGR over 2026-2031. Pharmaceutical cold-chain investments, the surge in temperature-sensitive meal kits, and retailer sustainability mandates drive continued growth. Expanded polystyrene (EPS) maintains widespread use because of its cost advantage, yet biodegradable starch-blend foams capture rising interest as sustainability regulations tighten. Mid-capacity formats (5-20 L) hold the largest unit demand, while small formats (≤5 L) expand fastest in line with personalized medicine and direct-to-consumer food delivery. Competitive dynamics remain moderate as established suppliers such as Sonoco and TemperPack confront specialized entrants that emphasize bio-based materials and smart packaging systems.
Key Report Takeaways
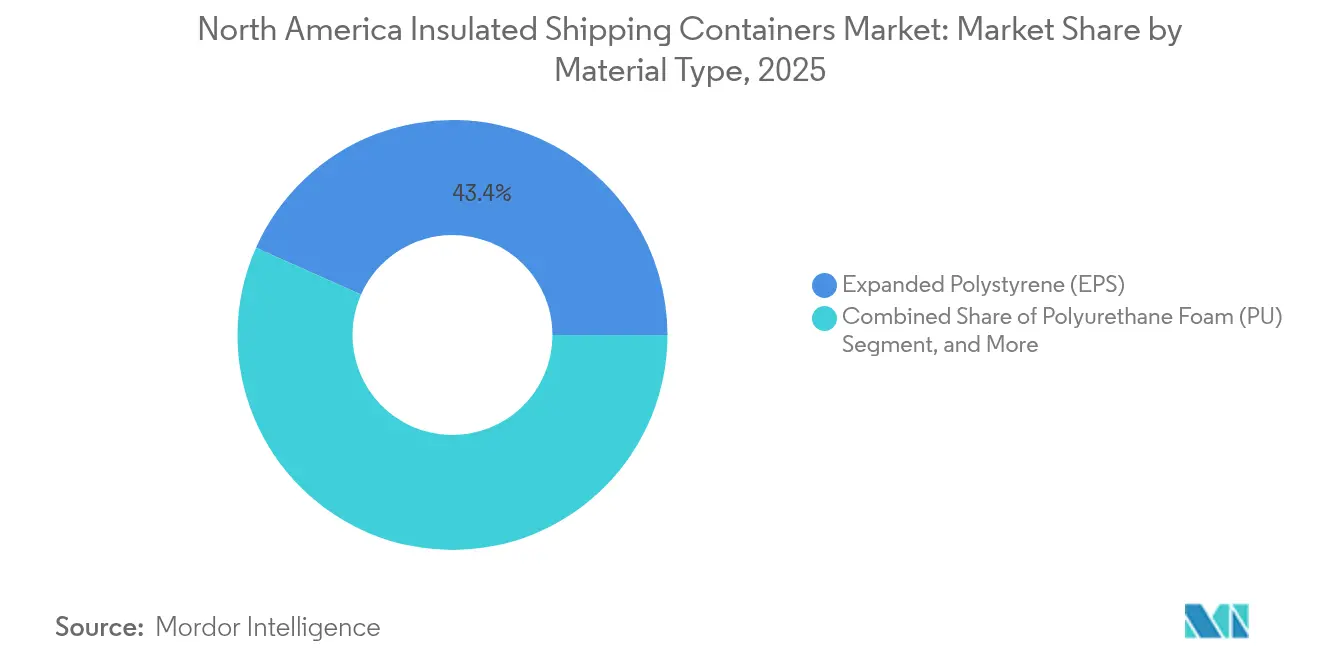
- By material type, EPS led with 43.35%of the North America insulated shipping containers market revenue share in 2025, while biodegradable starch-blend foams are expected to grow at a 6.74% CAGR through 2031.
- By end-user application, life sciences and pharmaceuticals held a 37.45% share of the North America insulated shipping containers market size in 2025; fresh meat and seafood are forecast to expand at a 6.79% CAGR to 2031.
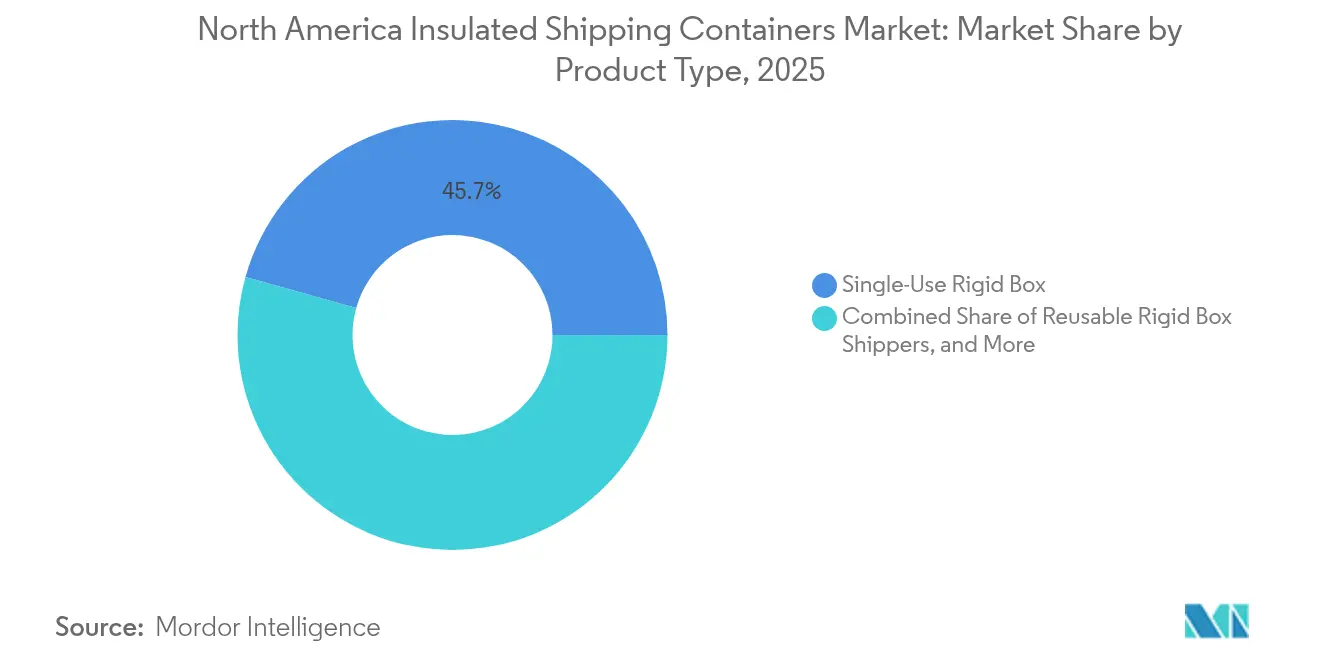
- By product type, single-use rigid boxes captured 45.65% of the North America insulated shipping containers market revenue share in 2025, whereas reusable rigid boxes posted the highest 6.86% CAGR projection to 2031.
- By capacity, the 5-20 L range accounted for 32.60% of the North America insulated shipping containers market share in 2025, while containers ≤5 L are poised for 6.55% CAGR growth to 2031.
- By country, the United States dominated with 87.65%of the North America insulated shipping containers market share in 2025; the United States records a 6.44% CAGR outlook through 2031.
Note: Market size and forecast figures in this report are generated using Mordor Intelligence’s proprietary estimation framework, updated with the latest available data and insights as of 2026.
Market Trends and Insights
Drivers Impact Analysis of North America Insulated Shipping Containers Market*
| Driver | (~) % Impact on CAGR Forecast | Geographic Relevance | Impact Timeline |
|---|---|---|---|
| E-commerce surge in temperature-sensitive meal kits | +1.2% | United States and Canada, urban metros | Short term (≤ 2 years) |
| Growth in pharmaceutical cold-chain expansion | +1.4% | North America, pharma hubs | Medium term (2–4 years) |
| Tightening U.S. FDA biologics stability guidance | +0.9% | United States, spillover to Canada | Medium term (2–4 years) |
| Retailer sustainability mandates for reusable shippers | +0.8% | United States and Canada | Long term (≥ 4 years) |
| USDA grants for food-loss reduction programs | +0.5% | United States agricultural zones | Long term (≥ 4 years) |
| Venture capital entering direct-to-patient logistics | +0.7% | United States healthcare clusters | Short term (≤ 2 years) |
| Source: Mordor Intelligence | |||
E-commerce Surge in Temperature-Sensitive Meal Kits
Temperature-sensitive meal kit services are scaling quickly and require compact, high-performance packaging that sustains 48-72-hour transit windows. Technology such as SeaWell active packaging lengthens shelf life and supports quality claims.[1] Cost-conscious operators use smaller, lighter containers that cut freight expenses, and biodegradable foams help brands communicate sustainability commitments. Adoption peaks within two years as consolidation reduces operator count, yet installed volumes of small containers keep rising. The North America insulated shipping containers market responds with thinner wall profiles that still meet last-mile thermal targets.
Growth in Pharmaceutical Cold-Chain Expansion
Biologics, cell therapies, and personalized medicine demand precise 2-8 °C shipping, expanding beyond routine vaccine lanes. Merck’s USD 1.5 billion cold-chain build-out in 2024 underscores the long-term capital push. Vacuum insulated panels (VIPs) and phase change materials (PCMs) safeguard payloads during extended transit and reduce excursion risk. Direct-to-patient delivery fuels the need for small, validated shippers with data-logging features. As distribution networks mature, the North America insulated shipping containers market embeds real-time monitoring to satisfy audit requirements across borders.
Tightening U.S. FDA Biologics Stability Guidance
Revised guidance increases documentation and continuous monitoring for temperature excursions. Packaging buyers migrate toward premium solutions that integrate sensors and secure chain-of-custody data. Cell and gene therapies are especially vulnerable, raising procurement budgets for proven containers. Validation cycles lengthen buying decisions, yet once qualified, they create sticky demand and higher margins for container vendors. Medium-term impact persists as new biologics launch pipelines remain active.
Retailer Sustainability Mandates for Reusable Shippers
Programs such as Amazon’s Climate Pledge Friendly set clear thresholds for packaging reusability. Retailers favor suppliers offering durable EPS alternatives like expanded polypropylene (EPP) that survive multiple cycles without performance loss. Container suppliers invest in automated cleaning and refurbishment to close the reuse loop, though establishing collection networks requires time. Over the long term, reusable formats shift revenue toward service-based models that include retrieval, sanitization, and redeployment.
Restraints Impact Analysis of North America Insulated Shipping Containers Market*
| Restraint | (~) % Impact on CAGR Forecast | Geographic Relevance | Impact Timeline |
|---|---|---|---|
| Escalating cost of bio-based insulation resins | -0.8% | North America, sustainable packaging makers | Short term (≤ 2 years) |
| Limited reverse-logistics infrastructure for returns | -0.6% | United States and Canada, rural areas | Medium term (2–4 years) |
| Volatile recycled EPS feedstock availability | -0.4% | Regions with EPS recycling plants | Short term (≤ 2 years) |
| State-level EPR fees | -0.5% | United States, by state | Medium term (2–4 years) |
| Source: Mordor Intelligence | |||
Escalating Cost of Bio-Based Insulation Resins
Bio-based resins cost 15-25% more than petroleum equivalents, eroding margins for eco-focused converters.[2] Limited feedstock capacity and agricultural price swings magnify volatility. Smaller vendors struggle to absorb surcharges and must pass them to customers, risking order deferrals. Technology learning curves and scale economies could narrow the gap, yet near-term headwinds remain, slowing the wholesale shift away from EPS.
Limited Reverse-Logistics Infrastructure for Returns
Reusable programs succeed only when containers return promptly for cleaning. Current return rates hover near 70%, well below breakeven for many operators. Rural and suburban routes are hardest to service because of long collection intervals. Building depots, wash lines, and tracking systems requires high capital and multi-year planning, tempering the pace at which reusable formats penetrate.
*Our forecasts treat driver/restraint impacts as directional, not additive. The impact forecasts reflect baseline growth, mix effects, and variable interactions.
North America Insulated Shipping Containers Market Segment Analysis
By Material Type:
EPS Strength Meets Biodegradable UpsideExpanded polystyrene holds a 43.35% share within the North America insulated shipping containers market size in 2025 because its insulation value per dollar remains unmatched for broad food and pharma use cases. Polyurethane foam secures high-value biologics shipping through its density tunability, and EPP gains favor in reuse programs that demand higher drop resistance. Biodegradable starch-blend foams, though at a modest base, rise at a 6.74% CAGR thanks to regulatory incentives and brand stewardship. VIP and aerogel technologies serve premium payloads that justify elevated cost structures, supporting the total value pool of the North America insulated shipping containers market.
Thermal performance standards are tightening, spurred by FDA validation protocols and EPA recycling guidance. Vendors such as Sealed Air deliver thinner VIP panels that shrink package footprints by 30% while maintaining temperature hold times. EPS suppliers pilot recycled content formulations to comply with state plastics statutes. The result is an increasingly segmented material choice matrix where purchasers weigh acquisition costs against reverse-logistics savings, disposal fees, and customer sustainability expectations.

By End-User Application:
Pharmaceuticals Lead, Protein Delivery AcceleratesLife sciences and pharmaceuticals account for 37.45% of North America's insulated shipping containers market share in 2025 and typically specify leak-proof, data-ready containers validated for 2-8 °C lanes. Compliance burdens extend sales cycles but also sustain premium price points and predictable reorder cadence. Direct-to-consumer protein services push fresh meat and seafood shipping, growing at a 6.79% CAGR, and require containers that balance ice-pack mass with box wall thickness to meet overnight timelines.
Meal kit operators maintain demand for mid-capacity EPS boxes fitted with gel packs, while frozen food categories sustain a baseline for rigid boxes capable of dry-ice payloads. Specialty niches like floral logistics rely on humidity-resilient liners to mitigate wilting risk. Pharmaceutical dominance is anchored in higher cost tolerance and stringent validation, even as diversified food verticals broaden the total addressable volume for the North America insulated shipping containers market.
By Product Type:
Single-Use Dominates, Reuse Gains TractionSingle-use rigid boxes command 45.65% revenue share, leveraging existing fulfillment workflows that favor one-way shipments. Pouch and mailer formats extend penetration to sample drugs and meal-kit side dishes, complementing larger Insulated Shipper formats. Reusable rigid boxes demonstrate a 6.86% CAGR as retailers enforce waste-reduction goals. IoT-enabled containers from Pelican BioThermal support asset tracking and condition monitoring.
Reusable adoption hinges on clear return on investment, influenced by container life cycle counts and reverse-logistics cost. Extended producer responsibility fees incentivize users to re-evaluate single-use spend, but contamination risks in pharma and stringent clean-room controls leave one-way boxes entrenched for many biologics programs. The North America insulated shipping containers market, therefore, develops hybrid portfolios, aligning container form factors with shipment value and regulatory tolerance.
By Capacity Range:
Mid-Size Holds Lead, Small Formats ClimbContainers in the 5-20 L class represent 32.60% of shipments and fit standard vial trays and two-meal kit trays. Small packages up to 5 L grow fastest at 6.55% CAGR alongside personalized medicine and subscription food services. Large boxes from 20 L to 60 L enable bulk pharmacy replenishments and multi-meal family kits, while pallet shippers handle warehouse-level movements. Emerging aerogel linings allow smaller boxes to hit 72-hour stability targets, important for remote patient deliveries.
Optimizing cube utilization reduces freight spend and greenhouse emissions. As data analytics improves lane-specific thermal modeling, buyers increasingly right-size packages, reinforcing the multi-capacity portfolio strategy that anchors revenue resilience across the North America insulated shipping containers market.
Geography Analysis
United States Insulated Shipping Containers Market
The United States anchors the North America insulated shipping containers market with unrivaled pharma volumes and e-commerce density. Investments in direct-to-patient logistics expand small-capacity demand, and FDA stability guidance drives continuous improvement in thermal performance. Rising Extended Producer Responsibility fees encourage retailers and drugmakers to pilot reusable programs, yet success varies by state as collection infrastructure remains uneven.
Canada Insulated Shipping Containers Market
Canadian growth, while from a smaller base, outpaces the region due to Health Canada alignment and widespread grocery delivery expansion. Government grants to modernize cold-chain routes in northern settlements heighten demand for high-performance containers that withstand extreme temperature gradients. Suppliers addressing Canada develop dual-certified packaging that passes both FDA and Health Canada qualification, simplifying cross-border operations.
North America Insulated Shipping Containers Market
Regional climate extremes across North America challenge container integrity from desert heat to arctic cold. This diversity spurs ongoing material R&D, particularly in phase-change media and active monitoring. Vendors able to deliver validated, geography-agnostic solutions position strongly to capture incremental share as direct-to-consumer models normalize.
Regulatory Landscape
Regulation shaping insulated shipping containers in North America centers on FDA requirements for human drugs and biologics packaging systems, where documentation and demonstrated maintenance of product stability are central to qualification and auditing. For infectious substances and certain hazardous shipments, packaging and transport must also meet U.S. hazardous materials rules (49 CFR Parts 171-180), including performance criteria tied to UN-style packaging. This increases the emphasis on validated shipper designs and traceable test evidence.
Industry testing and qualification norms also influence procurement. ISTA thermal standards, including Standard 20 and related thermal profiles, are commonly used by FDA-regulated shippers as a recognized framework to evidence thermal performance across distribution environments. Cross-border flows add further compliance focus: the USMCA review process in 2026, including industry calls from the Global Cold Chain Alliance to modernize SPS systems, keeps attention on harmonized documentation and interoperability for cold-chain movements between the United States and Canada.
Value Chain Analysis
The value chain begins with upstream inputs such as EPS, polyurethane, EPP, paper-based substrates, foils, and phase change materials, then progresses into insulated panels, molded components, liners, and assembled box and pallet shippers. Packaging manufacturers and integrators validate designs against customer lane profiles and industry protocols, with ISTA used as a performance-testing norm that supports qualification for temperature-sensitive food and pharmaceutical distribution.
Downstream, cold-chain logistics providers, parcel and freight networks, and specialized life-science couriers influence shipper specifications through handling constraints, transit times, and return logistics requirements. For reusable rigid boxes, reverse logistics and refurbishment capability becomes a distinct value-chain step, with collection, cleaning, and redeployment economics tied to retrieval rates and network density. This structure encourages some suppliers to move toward vertical integration and service-led offerings that combine packaging, tracking, and reuse operations.
Competitive Landscape
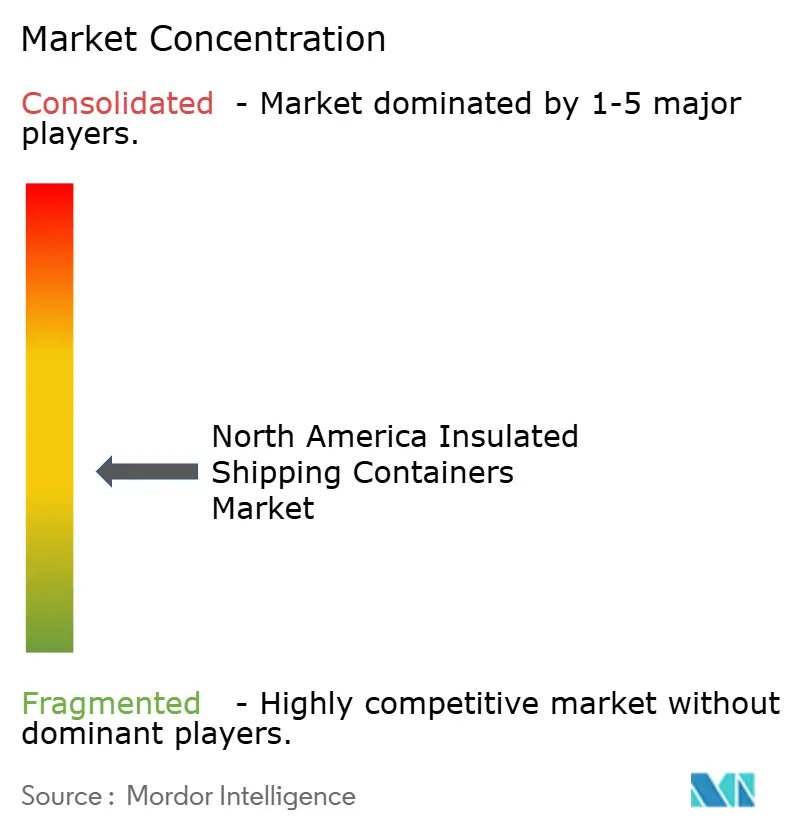
Competition is moderate, with a blend of large packaging incumbents and agile specialists. Sonoco refocused on temperature-controlled packaging after a USD 1.8 billion divestiture, reallocating capital toward smart container technologies. TemperPack channels recent USD 12 million funding into scaling biodegradable foam lines to meet retailer mandates. Meanwhile, va-Q-tec and Pelican BioThermal emphasize premium VIP solutions and IoT integration for biologics shipments.
Technology serves as a primary differentiator. IoT sensors and blockchain tracking enable shipment visibility and audit readiness, translating into higher contract win rates among pharma clients. Consolidation continues as companies seek vertical integration from material formulation through logistics management. Bioderived foams, automated cleaning systems, and predictive analytics represent active innovation frontiers. Suppliers that harmonize sustainability with total cost of ownership gain an upper hand in the North America insulated shipping containers market.
North America Insulated Shipping Containers Industry Leaders
-
Sonoco Products Company
-
Polar Tech Industries Inc.
-
Softbox Systems US LLC
-
Cryopak Industries Inc.
-
Insulated Products Corporation
- *Disclaimer: Major Players sorted in no particular order
North America Insulated Shipping Containers Market Companies Covered in this Report
- Sonoco Products Company
- TemperPack Technologies Inc.
- Polar Tech Industries Inc.
- Intelsius Ltd. (DGP Intelsius)
- Cascades Inc.
- Sofrigam SA
- Softbox Systems US LLC
- Cold Chain Technologies LLC
- Cryopak Industries Inc.
- Insulated Products Corporation
- KodiaKooler, a division of Airlite Plastics Co.
- Packaging Technology Group Inc.
- Therapak LLC (Avantor, Inc.)
- NanoCool LLC (part of UPS Healthcare)
- Chill-Pak Inc.
- va-Q-tec AG
- Envirotainer AB
- Pelican BioThermal LLC
- Emball'iso S.A.
- InsulTote LLC
Market Opportunities and Future Outlook
A clear opportunity is performance-qualified, data-rich insulated packaging for life sciences and pharmaceuticals, where buyers prioritize validated thermal performance and auditable records. Adoption of ISTA thermal standards, including Standard 20 and ISTA 7E/8E profiles, supports a shift from commodity shippers toward pre-qualified systems that can shorten customer validation cycles. April 2026 product activity such as Altor Solutions launching Odyssey pre-certified thermal shippers shows ongoing commercialization around certification-led selling.
Sustainability-driven material substitution and reuse economics also create whitespace, particularly where retailer mandates and state-level EPR fees increase the lifecycle cost of one-way EPS. Supplier programs that package qualification with alternative insulation, for example TemperPack introducing a Qualified Shipper Program in September 2025 centered on compostable insulation, reflect competition for buyers seeking both compliance-ready performance and reduced disposal risk. At the same time, gaps in reverse-logistics infrastructure keep service design factors, including pickup density, refurbishment capacity, and tracking, as differentiators for scalable reusable shipper deployments.
Recent Industry Developments in North America Insulated Shipping Containers Market
- April 2026: Sonoco introduced a temperature-controlled pallet shipper for extended, pallet-scale pharmaceutical transport, positioned around multi-day temperature maintenance. The launch targets higher-value lanes where palletized stability, qualification evidence, and reduced temperature excursion risk shape packaging decisions.
- April 2025: Sonoco ThermoSafe launched ChillTherm Bio, a biodegradable EPS QPMC pallet shipper for life sciences and healthcare applications. The product expands options for shippers balancing thermal performance requirements with sustainability and end-of-life constraints under tighter customer packaging policies.
- July 2024: Cryopak completed the acquisition of the gel-pack manufacturing segment of Garden State Cold Storage (closed May 10, 2024), adding manufacturing capability in Carteret, New Jersey. In the same period, Cryopak invested in spiral freezing technology and starch manufacturing at its Atlanta facility, strengthening lead-time control and scaling access to sustainable insulation inputs.
North America Insulated Shipping Containers Market Report Scope and Research Methodology
Market Definition and Coverage
This market covers insulated shipping containers used to protect temperature-sensitive goods during transport across North America, mainly in the United States and Canada. The sizing is expressed in revenue terms for container solutions used in cold-chain shipments across common end-use flows.
Scope exclusions: We exclude active temperature-control equipment rentals (such as powered reefers), non-insulated general packaging, and pure freight services that do not sell insulated container units.
Segments Covered in This Report
- By Material Type
- Expanded Polystyrene (EPS)
- Polyurethane Foam (PU)
- Expanded Polypropylene (EPP)
- Biodegradable Starch-blend Foams
- Other Materials (VIPs, Gel Packs)
- By End-User Application
- Life Sciences and Pharmaceutical
- Pre-cooked and Frozen Food
- Fresh Produce
- Fresh Meat and Seafood
- Bakery, Plants and Flowers
- Other (Cosmetics, Wine, Beverages)
- By Product Type
- Single-Use Rigid Box Shippers
- Reusable Rigid Box Shippers
- Single-Use Pouch and Mailer Shippers
- Pallet-sized Bulk Shippers
- By Capacity Range
- Upto 5 L
- 5 - 20 L
- 20 - 60 L
- Greater than 60 L (Pallet)
- By Country
- United States
- Canada
Data Sources, Market Sizing, and Validation
Desk Research
Desk research was used to anchor the demand context for temperature-controlled shipping and to keep our assumptions consistent with what is observable in public data. We referenced official and open sources such as the US Census Bureau for trade and manufacturing indicators, the US Food and Drug Administration and US Department of Agriculture for cold-chain handling and food distribution signals, and Statistics Canada for cross-border and domestic demand proxies. We also reviewed public guidance from agencies such as the CDC for healthcare shipment needs, and non-paywalled scientific literature to understand insulation performance and typical pack-out practices.
To translate these signals into a usable model, we reviewed company filings, investor presentations, product catalogs, and reputable press to map what is being sold and how it is positioned across applications (for example, life sciences shipments versus fresh food). A paid subscription covering company financials and news was used selectively to normalize revenue splits and identify major product changes, and a patent database was referenced to track insulation material shifts that can move ASPs over time. The desk sources listed here are illustrative, and many other public documents and datasets were also checked for data collection, validation, and clarification.
Primary Interviews and Surveys
Primary work focused on confirming what is actually bought, in what quantities, and under what temperature and duration requirements, since desk sources rarely show these details in a consistent way. We spoke with packaging decision-makers and cold-chain logistics users across food, healthcare, and specialty distribution in the United States and Canada to validate price points, reuse rates, and channel mix. We then used these inputs to close gaps and cross-check the final model.
Distribution of primary research fieldwork respondents
| Company type | Respondent position |
|---|---|
| Top tier: 29% | CXOs: 12% |
| Mid tier: 49% | Functional/Unit leaders: 43% |
| Smaller Players: 22% | Managers: 45% |
Market-Sizing & Forecasting
Our sizing starts with a top-down rebuild of the addressable cold-chain shipping need in North America. Shipment flows in pharma and food are translated into likely insulated-container usage using typical pack-out formats and temperature lanes. To keep totals realistic, the result is corroborated with selective bottom-up approximations, such as sampled price-by-volume checks for common container sizes, supplier and distributor channel checks, and sanity checks against stated capacity and throughput indicators.
Key model inputs include the share of shipments that require controlled temperature packaging, the mix between single-use and reusable rigid containers, typical payload capacity bands (for example, small lab shippers versus larger bulk shippers), replacement and reuse cycles that affect unit demand, and ASP movement driven by material choices like EPS, EPP, and polyurethane-based solutions. Because data can be uneven by application, we handle gaps by using validated proxy ratios from adjacent end uses, then adjust them after primary feedback on actual purchasing behavior.
For forecasting, we use scenario analysis supported by trend checks on cold-chain penetration and product mix shifts. Demand is shaped by regulations, e-commerce delivery patterns, and healthcare shipment needs that do not always follow a straight-line trajectory. Growth paths were stress-tested by varying assumptions on reuse rates, insulation material substitution, and inflation pass-through, so the forecast remains explainable and repeatable.
Data Validation & Update Cycle
Before numbers are finalized, outputs are compared against independent signals, such as cold-chain shipment activity indicators, trade and production trends, and price movement patterns observed in the market. When a variance looks unusual, we re-check the underlying drivers, revisit the assumptions that created the jump, and re-contact selected interviewees if the change is tied to a material shift in product mix or end-use demand. Internal reviews are completed in steps so that category logic, arithmetic checks, and narrative consistency are verified separately before sign-off.
Reports are refreshed on an annual cycle, and interim adjustments are made when major events reshape demand, pricing, or regulation. Right before publication or delivery, a final analyst pass is done to reflect the most recent public updates and any confirmed market changes, so clients receive the latest view.
Mordor Intelligence's North America Insulated Shipping Containers Market Size Measured Against Other Published Estimates
Different publishers can show different market sizes for insulated shipping containers because the category can be defined in multiple ways, and each choice changes the counted revenue. The most common reasons are geography cutoffs, whether reusable systems are treated as product revenue or as a service-like flow, and how prices are converted and updated between years.
The table also shows how adjacent packaging items can be pulled into the total, and how that pushes the value up or down depending on what gets counted. Some estimates blend insulated mailers, gel packs, or broader insulated packaging into the same bucket, and others extend coverage to Mexico or include more of the freight service element. The table points to this scope gap. In Mordor Intelligence's model, the count is limited to insulated shipping containers sold for cold-chain shipments in the United States and Canada, with material and capacity mixes used to keep ASPs consistent across end uses.
Benchmark comparison
| Source | Market Size | Gaps in Research Methodology |
|---|---|---|
| Mordor Intelligence | USD 1.85 B (2025) | |
| Industry Association A | USD 2.30 B (2025) | Uses a wider packaging definition that appears to include insulated mailers and other thermal packaging formats alongside rigid container systems, which expands the revenue pool for the same year. |
| Trade Journal B | USD 1.60 B (2025) | Focuses mainly on life sciences lanes and excludes several food and specialty-perishables applications, and it applies conservative price progression that can understate revenue when material costs change. |
Looking across the three values, the spread is best explained by what gets included as a product and which end uses are treated as in-scope demand. Our approach keeps the steps traceable by tying volumes to shipment need, then validating prices and mix through interviews so the final number can be repeated and updated with clear inputs.
Key Questions Answered in the Report
How large is the North America insulated shipping containers market in 2026?
The North America insulated shipping containers market size is USD 1.97 billion in 2026.
What is the forecast growth rate for insulated shipping containers in North America?
The market is projected to expand at a 6.37% CAGR, reaching USD 2.68 billion by 2031.
Which material holds the largest share of insulated shipping containers sold in North America?
Expanded polystyrene leads with 43.35% share as of 2025.
Which end-use segment is growing fastest for insulated containers?
Fresh meat and seafood shipping posts the highest 6.79% CAGR through 2031.
What is driving the adoption of reusable insulated containers?
Retailer sustainability mandates and rising EPR fees are pushing users toward reusable formats that lower waste and long-term cost.
Which country contributes most to demand in North America?
The United States commands 87.65% of regional revenue because of its large pharmaceutical base and mature e-commerce infrastructure.