North America Industrial Vending Machine Market Size and Share
Market Overview
| Study Period | 2021 - 2031 |
|---|---|
| Base Year For Estimation | 2025 |
| Forecast Data Period | 2026 - 2031 |
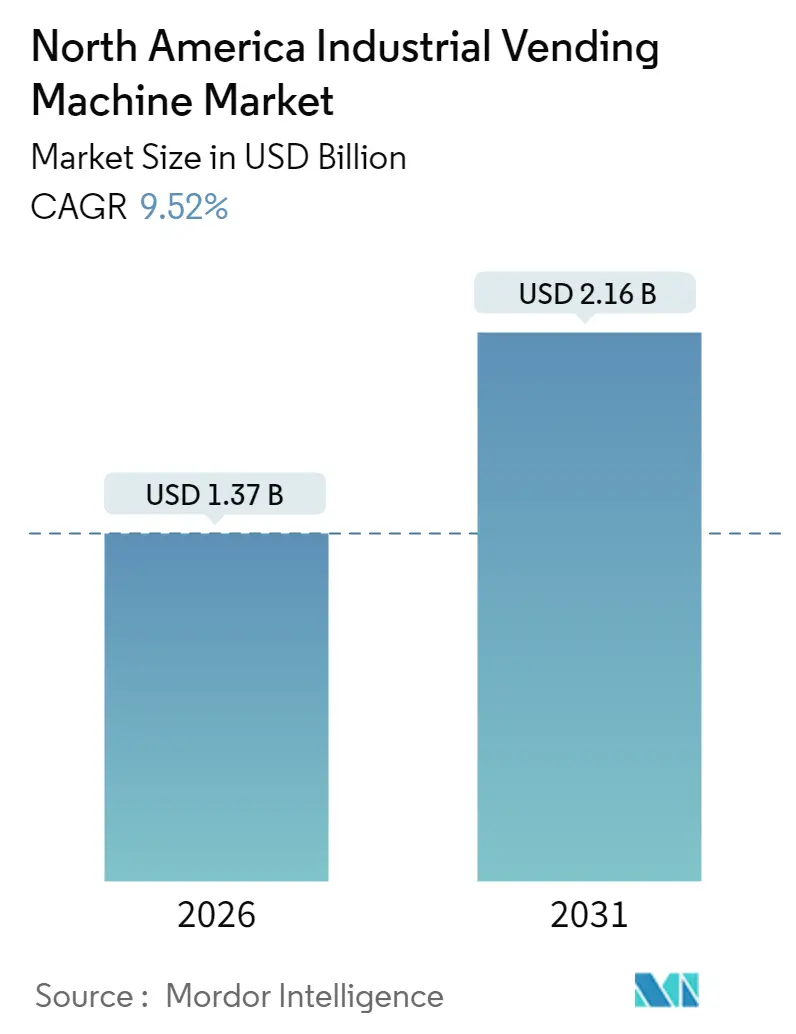
| Market Size (2026) | USD 1.37 Billion |
| Market Size (2031) | USD 2.16 Billion |
| Growth Rate (2026 - 2031) | 9.52% CAGR |
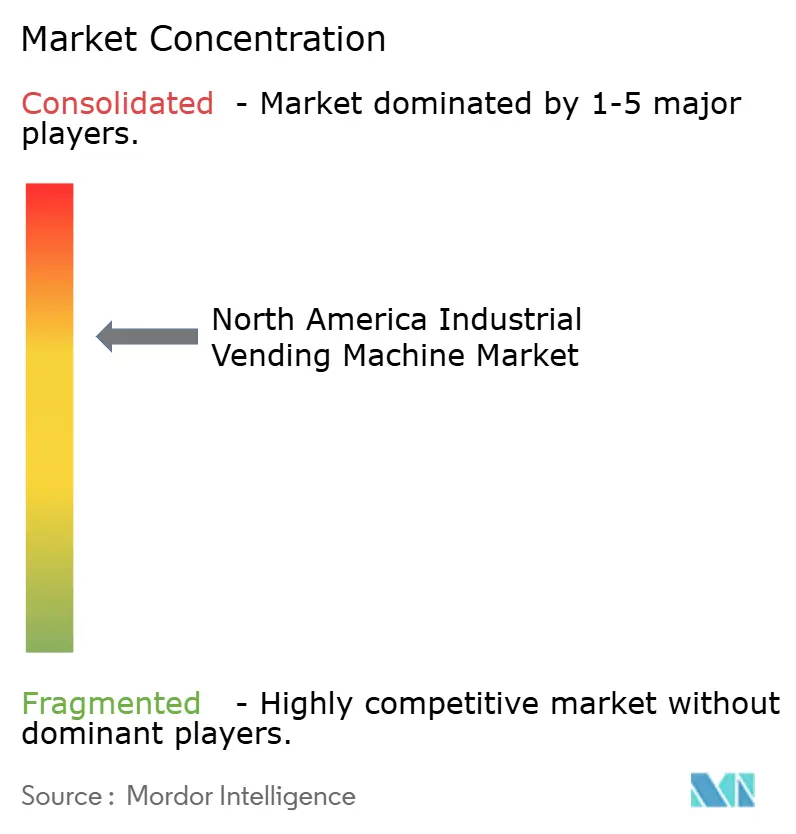
| Market Concentration | Medium |
Major Players *Disclaimer: Major Players sorted in no particular order Image © Mordor Intelligence. Reuse requires attribution under CC BY 4.0. | |
North America Industrial Vending Machine Market Analysis by Mordor Intelligence
The North America industrial vending machine market was valued at USD 1.25 billion in 2025 and estimated to grow from USD 1.37 billion in 2026 to reach USD 2.16 billion by 2031, at a CAGR of 9.52% during the forecast period (2026-2031). Sustained growth reflects an urgent push to digitize maintenance, repair, and operations (MRO) inventories, tighter cost-control mandates, and widening compliance requirements across production environments. Manufacturing companies adopting connected dispensing units report 25%-40% reductions in consumable use, elevating vending machines from convenience assets to essential shop-floor infrastructure. Supplier-managed inventory contracts are gaining favour as finance teams swap large capital allocations for pay-as-you-consume models. Unit design is also shifting coil formats remain dominant for high-volume consumables yet secured cabinet and locker systems are scaling quickly to protect high-value tools, pharmaceuticals, and controlled chemicals. [1]Canada Revenue Agency, “Clean Technology (CT) Investment Tax Credit (ITC),” canada.ca
Key Report Takeaways
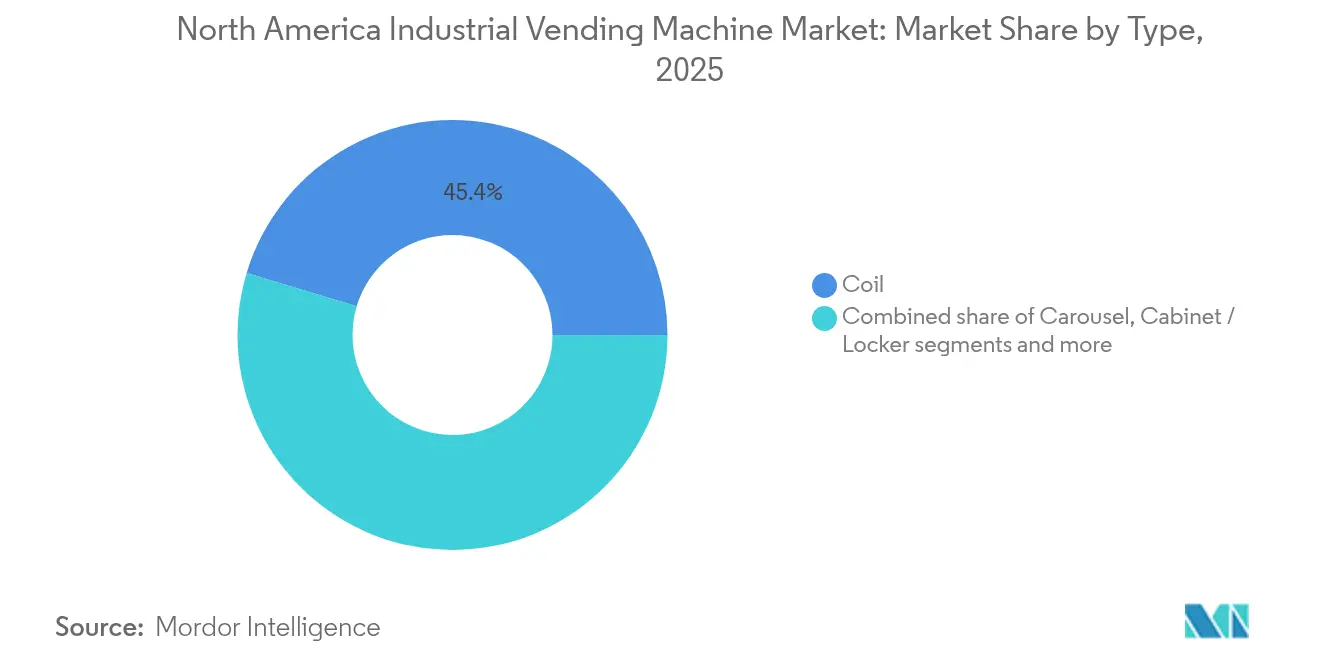
- By type, coil systems maintained 45.35% of North America industrial vending machine market share in 2025, while cabinet/locker formats are set to grow at 13.60% CAGR to 2031.
- By end-user, manufacturing held 56.20% share in 2025; oil and gas is forecast to expand at a 13.10% CAGR through 2031.
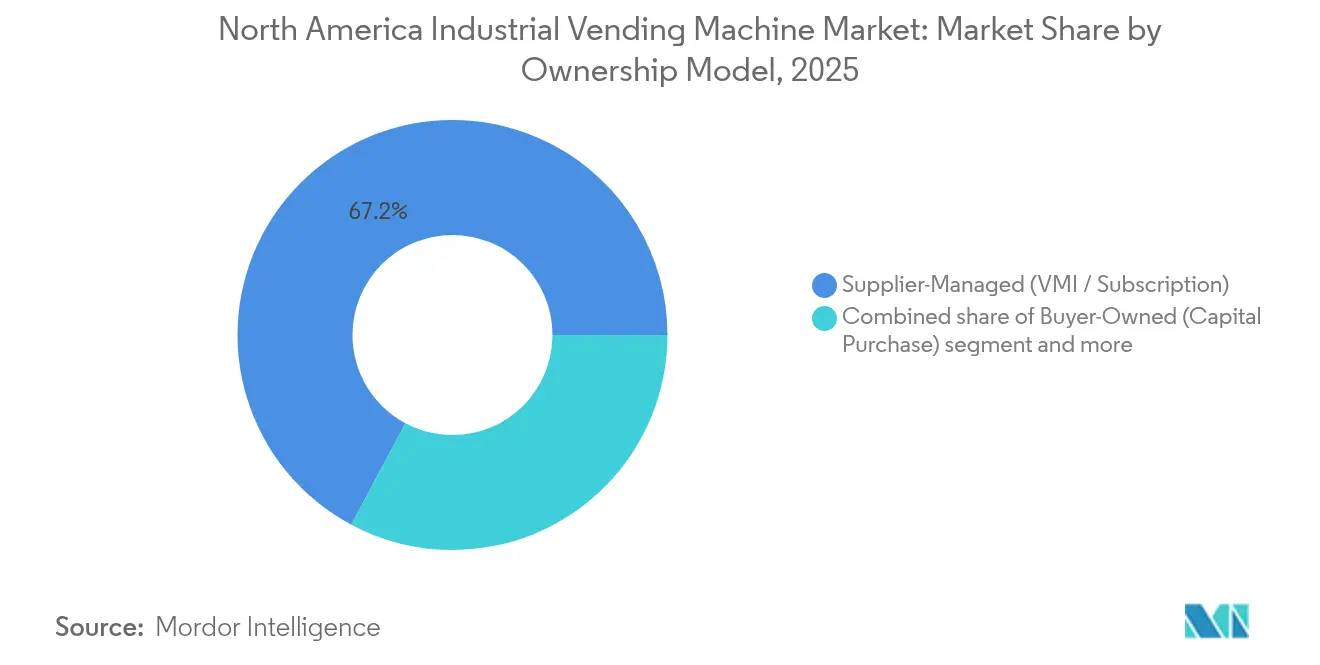
- By ownership model, supplier-managed systems accounted for 67.20% share of the North America industrial vending machine market size in 2025, whereas buyer-owned units are projected to advance at a 14.90% CAGR between 2026-2031.
- By inventory category, consumables and PPE captured 51.30% of the North America industrial vending machine market size in 2025; durable tools and spares are expected to rise at 12.60% CAGR through 2031.
- By country, the United States commanded 90.60% share of the North America industrial vending machine market in 2025, while Canada is on track for the fastest 13.80% CAGR through 2031.
Note: Market size and forecast figures in this report are generated using Mordor Intelligence’s proprietary estimation framework, updated with the latest available data and insights as of January 2026.
North America Industrial Vending Machine Market Trends and Insights
Drivers Impact Analysis
| Driver | (~) % Impact on CAGR Forecast | Geographic Relevance | Impact Timeline |
|---|---|---|---|
| Greater MRO-cost pressure among OEMs | +2.10% | North America, with concentration in manufacturing hubs | Medium term (2-4 years) |
| Digitisation push for real-time inventory data | +1.80% | Global, with early adoption in US manufacturing belt | Short term (≤ 2 years) |
| OSHA-driven PPE accountability | +1.40% | United States primarily, limited Canada spillover | Short term (≤ 2 years) |
| Surge in reshoring-linked tool crib automation | +1.90% | North America, concentrated in Robot Hubs states | Medium term (2-4 years) |
| ESG scoring favouring energy-efficient machines | +0.80% | Global, with regulatory emphasis in Canada | Long term (≥ 4 years) |
| Tax-credit eligibility of IIoT devices in US & CA | +1.20% | United States and Canada | Medium term (2-4 years) |
| Source: Mordor Intelligence | |||
Greater MRO-cost pressure among OEMs
Tight global supply chains, constrained labour pools, and heightened raw-material volatility are pushing original-equipment manufacturers to shave every possible dollar from maintenance budgets. Fastenal disclosed that larger customer sites—those spending more than USD 10,000 per month—drove a 3.4% increase in net sales during Q1 2025, illustrating how centralized MRO contracts now flow through automated devices rather than manual requisition lists. Predictive-maintenance practices rely on real-time usage signals; vending platforms supply that telemetry and, in turn, reduce overstocking. Case studies from Kennametal’s ToolBOSS indicate up to 30% drops in tool consumption once automated tracking and replenishment are installed. Concentrated investments in industrial robots—77% of 2022 North American robot sales landed in just five states—further spotlight the need for sophisticated tool cribs that can keep pace with high-throughput lines.
Digitisation push for real-time inventory data
Industrial Internet of Things (IIoT) architecture is migrating rapidly from pilot zones to plant-wide deployments. Applied Industrial Technologies’ purchase of IRIS Factory Automation in 2025 underscores market appetite for data-rich material-handling solutions. Peer-reviewed research confirms that connected vending machines can drive double-digit efficiency gains by pre-empting stockouts and streamlining labour allocation to high-value tasks. Advanced analytics engines now overlay machine-learning models on vending log files to predict tool failure windows and schedule automated reorders. However, the same connectivity expands the cyber-attack surface; manufacturing suffered 68 confirmed cyber incidents in 2023, the highest of any sector.
OSHA-driven PPE accountability
OSHA’s January 2025 update mandates properly fitting personal protective equipment for all employees, with fines climbing to USD 16,131 per violation. Facilities are under pressure to document distribution, fit testing, and replacement cycles. Automated PPE dispensers paired with badge or biometric authentication create immutable audit trails and prove compliance during surprise inspections. AI-enabled camera systems tied into vending databases now flag non-compliance in real time, pushing safety adherence metrics far beyond manual checklists. As a result, nearly two-thirds of employers already employ electronic monitoring, up sharply from the 1990 baseline. [2]Katrina Reed, “Navigating OSHA's 2025 Regulatory Changes,” csmgroup.com
Surge in reshoring-linked tool crib automation
Domestic production incentives such as the CHIPS and Science Act and the Inflation Reduction Act are sparking sizeable new factory footprints. Reshoring created 300,000 jobs in 2022 and another 180,000 in H1 2023 alone. Manufacturers setting up greenfield plants specify automated vending from day one to avoid legacy inventory shortcomings. Robot-dense cells in states like Michigan and Wisconsin require precise tool usage data to justify capital payback horizons. A FANUC-Swivellink deployment achieved a 33% productivity boost and recouped investment within 33 weeks through robotic CNC tending.
Restraints Impact Analysis
| Restraint | (~) % Impact on CAGR Forecast | Geographic Relevance | Impact Timeline |
|---|---|---|---|
| High upfront cap-ex for cabinet and carousel units | -1.60% | Global, with higher impact in cost-sensitive SME segments | Short term (≤ 2 years) |
| IT/OT cyber-security concerns | -1.20% | North America, with regulatory emphasis post-2023 attacks | Medium term (2-4 years) |
| Union resistance to tool-usage tracking | -0.80% | United States and Canada, concentrated in unionized facilities | Long term (≥ 4 years) |
| Supply-chain chip shortages for controller boards | -1.10% | Global, with particular impact on North American assembly | Short term (≤ 2 years) |
| Source: Mordor Intelligence | |||
High upfront capex for cabinet and carousel units
Fully configured locker systems can exceed USD 50,000 when factoring in industrial-grade controllers, software licenses, and networking gear. MSC Industrial reported that vending sales climbed only 1% year-over-year in Q2 2025 despite representing 18% of total revenue, underscoring customer reluctance to green-light heavy capital layouts. Financing innovations such as supplier-managed rental contracts convert capex to op-ex but increase lifetime expense, forcing finance departments to weigh cash-flow flexibility against long-run cost efficiency.
IT/OT cyber-security concerns
Ransomware targeting operational technology knocked multiple US plants offline in 2024, costing individual operators up to hundreds of millions in lost output. Executives now demand network segmentation, encrypted protocols, and third-party penetration tests before approving new IIoT endpoints. Each added vending controller introduces an additional attack vector, complicating incident response for already lean plant-security teams.
Segment Analysis
By Type: Secure Cabinets Gain Ground on High-Volume Coil Leaders
The North America industrial vending machine market size for coil machines stood highest in 2025, capturing 45.35% share on the back of inexpensive mechanics and quick part recovery cycles. Cabinet and locker formats, though expensive, are forecast to clock 13.60% CAGR through 2031 as aerospace, defense, and medical factories tighten chain-of-custody rules for precision gauges, narcotics, and calibration devices. In these sites, every withdrawal log operator ID, time stamp, and lot number, feeding directly into quality-management software. Carousel designs serve mid-sized locations that need deeper SKUs without full locker investments; their horizontal trays accommodate oddly shaped jigs better than spirals. Custom “other niche” units, including ruggedized outdoor dispensers with IP65 ratings, are opening modest but strategic revenue lines for vendors serving oil-field maintenance crews. Stanley Black & Decker’s CribMaster portfolio illustrates the pivot: configurable drawer architectures that sync with SAP or Oracle ERPs cut re-stock labour by 40% and trigger auto-POs when thresholds hit.
A secondary trend involves modular retrofits, where legacy coil bodies receive edge-computing controllers, vision sensors, and cloud interfaces. This upgrade path slashes conversion cost by as much as 60% versus full cabinet replacement, enticing mid-tier factories to extend asset life while still capturing data-driven insights. Across the projection window, vendors that bundle cybersecurity hardening, predictive analytics, and flexible payment models are expected to outsell hardware-only rivals.
Note: Segment shares of all individual segments available upon report purchase
By End-user Industry: Manufacturing Retains Lead; Oil and Gas Accelerates
Manufacturing users commanded 56.20% of North America industrial vending machine market share in 2025, reflecting long-running adoption inside automotive, electronics, and general-machinery plants. Reshoring has poured tens of billions into new production complexes, boosting demand for digital cribs that align with lean and six-sigma goals. Yet, oil and gas sites—spanning upstream rigs to midstream processing hubs—are forecast to grow fastest at 13.10% through 2031. Hazardous-location certifications (Class I, Division 2) and explosion-proof enclosures make vending attractive for controlling intrinsically safe tools and flame-retardant apparel. Construction and infrastructure contractors are also embracing PPE dispensers following OSHA’s stricter fit-testing regime. Aerospace and defense maintain high ASPs per machine because they layer biometric gates, two-factor PINs, and serialized part tracking, supporting audits under ITAR and AS9100 protocols.
Beyond headline verticals, utilities and renewable-energy operators are piloting solar-powered lockers at remote wind-farm substations, where technicians previously lost hours traveling back to central stores. Early field data indicates shift-long productivity improvements of 12% after installation, demonstrating vending’s relevance outside factory walls.
By Ownership Model: Operational-Expenditure Contracts Dominate but Buyer Control Rises
Supplier-managed solutions represented 67.20% of 2025 deployments, a structure wherein distributors absorb hardware cost and invoice customers on per-dispense or monthly service fees. Fastenal’s Fastenal Managed Inventory program illustrates scale: 6,418 new devices joined customer floors in Q1 2025, and platform revenue now accounts for 43% of company totals. While this model eases cap-ex hurdles, some firms are reassessing data sovereignty. As a result, buyer-owned equipment is projected to grow 14.90% CAGR to 2031. Cloud-agnostic software, competitive financing, and easier API connectivity with in-house ERP stacks underpin the shift. Hybrid-financed structures—shared hardware cost, vendor-managed fills—offer a middle route, popular among Tier-2 automotive suppliers balancing liquidity with control. Vendor success will hinge on flexible contract lengths, transparent per-dispense pricing models, and robust integration toolkits that minimize IT workload.
Note: Segment shares of all individual segments available upon report purchase
By Inventory Category: Durable Tools Track Upward in Precision Work Cells
Consumables and PPE held 51.30% of the North America industrial vending machine market size in 2025 as gloves, abrasives, and welding tips cycle rapidly. Durable tools—end mills, inserts, torque wrenches—are on track for 12.60% CAGR through 2031 thanks to higher spindle speeds and tighter tolerances in Industry 4.0 machining lines. These valuable items justify locker investment because traceability curbs shrinkage, drives root-cause analysis on premature wear, and feeds predictive life-cycle models. MRO miscellaneous goods remain a cross-sell arena: absorbent pads, spray lubricants, and specialty fasteners. Vendors that consolidate all three categories on one cloud dashboard—complete with AI-generated reorder thresholds—differentiate on total-cost-of-ownership, not sticker price.
Geography Analysis
The United States commanded 90.60% of the North America industrial vending machine market in 2025, home to dense manufacturing clusters, robust distributor networks, and aggressive automation incentives. Section 179 deductions alone allow immediate expense of up to USD 1.22 million in vending equipment purchased during 2024. Canada’s Clean Technology Investment Tax Credit refunds 30% of qualifying automation spend and, when paired with accelerated capital-cost allowances, compresses payback periods and propels a forecast 13.80% CAGR to 2031. Mexico, while still nascent, is emerging as a logical nearshore location for US OEMs aiming to diversify supply lines without crossing oceans; harmonized United States-Mexico-Canada Agreement (USMCA) rules ease cross-border equipment relocation.
Competitive Landscape
Competitive intensity in the North America industrial vending machine market is rising as incumbents defend share against nimble software-as-a-service (SaaS) entrants. Fastenal leverages deep SKU breadth and managed-inventory contracts to lock in customer relationships; its technology platforms generated 43% of total revenue in Q1 2025. Grainger, MSC Industrial, and Ferguson are responding through acquisitions that extend vertical expertise and widen last-mile fulfilment capacity. Applied Industrial Technologies’ USD 260 million purchase of Hydradyne brings motion-control know-how and a 33-branch footprint.
Product differentiation is shifting toward cybersecurity. Newer models ship with zero-trust architectures, encrypted edge-to-cloud pipelines, and secure-boot firmware. Patent filings reveal active R&D in automated packaging, AI-powered assortment optimization, and robotic restocks that dock to locker banks after hours. Meanwhile, white-label software vendors compete on interoperability, touting open APIs that feed SAP, Oracle, and emerging MES platforms without vendor lock-in.
Pricing strategies vary: some distributors bundle hardware, cloud analytics, and on-site restocking under volume-based contracts, while pure-play technology firms sell subscriptions with optional hardware leasing. Customers increasingly benchmark total cost per dispense, factoring consumable waste savings, regulatory-fine avoidance, and labour reallocation against fee schedules. Vendors able to document double-digit ROI within one budget cycle are consolidating mindshare among plant managers and CFOs alike.
North America Industrial Vending Machine Industry Leaders
Fastenal Company
MSC Industrial Direct Co., Inc.
Apex Industrial Technologies LLC
AutoCrib, Inc.
Airgas, Inc.
- *Disclaimer: Major Players sorted in no particular order
Recent Industry Developments
- June 2025: Ferguson Enterprises reported Q3 2025 sales of USD 7.6 billion, up 4.3%, driven by Independent Pipe & Supply Corp. and Light Innovations acquisitions.
- June 2025: Applied Industrial Technologies acquired IRIS Factory Automation and authorized repurchase of 1.5 million shares.
- April 2025: Ferguson completed purchases of Independent Pipe & Supply and National Fire Equipment Ltd., totaling about 50 deals in five years.
- April 2025: Fastenal posted Q1 2025 net sales of USD 1.96 billion, implemented 6,418 new devices, and grew FMI platform sales 9.5%.
North America Industrial Vending Machine Market Report Scope
Industrial vending machines are automated distribution systems that can be tailored for the size, shape, and volume requirements of the inventory they carry.
The North America industrial vending machine market is segmented by type (carousel vending machine, coil vending machine, cabinet vending machine, other types), by end-user (manufacturing, oil and gas, construction, aerospace, other end-users), by country (United States, Canada). The market sizes and forecasts are provided in terms of value (USD) for all the above segments.
| Carousel |
| Coil |
| Cabinet / Locker |
| Other Niche Designs |
| Manufacturing |
| Oil and Gas |
| Construction and Infrastructure |
| Aerospace and Defence |
| Others (Mining, Utilities, etc.) |
| Supplier-Managed (VMI / Subscription) |
| Buyer-Owned (Capital Purchase) |
| Hybrid-Financed |
| Consumables and PPE |
| Durable Tools and Spares |
| MRO Miscellaneous Items |
| United States |
| Canada |
| Mexico |
| By Type | Carousel |
| Coil | |
| Cabinet / Locker | |
| Other Niche Designs | |
| By End-user Industry | Manufacturing |
| Oil and Gas | |
| Construction and Infrastructure | |
| Aerospace and Defence | |
| Others (Mining, Utilities, etc.) | |
| By Ownership Model | Supplier-Managed (VMI / Subscription) |
| Buyer-Owned (Capital Purchase) | |
| Hybrid-Financed | |
| By Inventory Category | Consumables and PPE |
| Durable Tools and Spares | |
| MRO Miscellaneous Items | |
| By Country | United States |
| Canada | |
| Mexico |
Key Questions Answered in the Report
What is the current value of the North America industrial vending machine market?
The market is valued at USD 1.37 billion in 2026 and is projected to reach USD 2.16 billion by 2031.
Which segment holds the largest North America industrial vending machine market share?
Manufacturing users account for 56.20% of 2025 revenue, underpinned by strong reshoring activity.
Why are cabinet and locker vending systems growing faster than coil machines?
Secured lockers meet rising needs for tool traceability and compliance in aerospace, defense, and regulated industries, pushing a 13.60% CAGR through 2031.
How do OSHA’s 2025 rules impact vending adoption?
New fit-testing requirements and penalties of USD 16,131 per violation drive plants to install PPE dispensers that provide automated audit trails.
What government incentives exist for vending equipment buyers?
US firms can expense up to USD 1.22 million of qualified purchases under Section 179, while Canadian firms receive a 30% refundable Clean Technology Investment Tax Credit.
Are cybersecurity risks slowing market growth?
Yes. Concerns over IT/OT convergence reduce the CAGR by an estimated 1.2%, prompting vendors to harden devices with zero-trust architectures.


