
Market Overview
| Study Period | 2020 - 2031 |
|---|---|
| Forecast Data Period | 2026 - 2031 |
| Base Year Market Size (2025) | USD 202.25 Billion |
| Market Size (2026) | USD 211.88 Billion |
| Market Size (2031) | USD 267.29 Billion |
| Growth Rate (2026 - 2031) | 4.76% CAGR |
| Market Concentration | Medium |
Major Players *Disclaimer: Major Players sorted in no particular order Image © Mordor Intelligence. Reuse requires attribution under CC BY 4.0. | |
North America Home Furniture Market Analysis by Mordor Intelligence
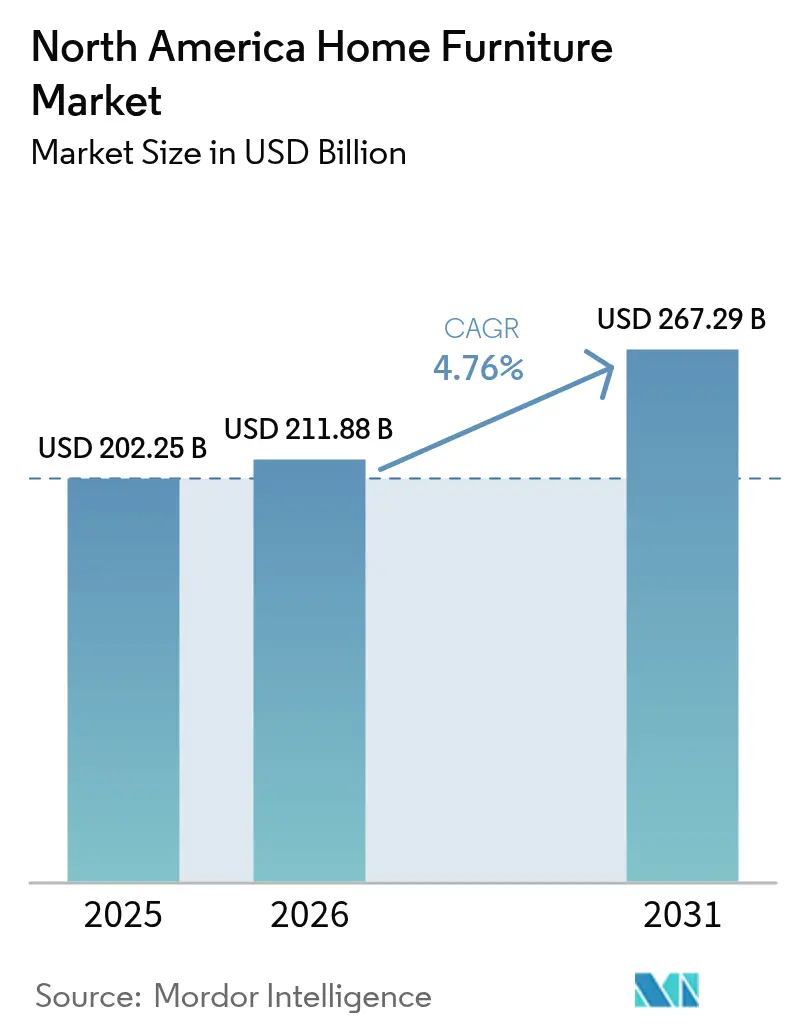
The North America home furniture market size was valued at USD 202.25 billion in 2025 and estimated to grow from USD 211.88 billion in 2026 to reach USD 267.29 billion by 2031, at a CAGR of 4.76% during the forecast period (2026-2031). Sales momentum draws strength from a rebound in residential construction, accelerating e-commerce adoption, and a steady shift toward multifunctional, sustainably sourced products that meet modern lifestyle needs. The United States remains the anchor with 80.75% revenue share, while Mexico shows the sharpest upswing, expanding at a 6.27% CAGR as nearshoring boosts local manufacturing capacity[1]Prodensa, “Furniture Manufacturing in Mexico,” prodensa.com. . Living room pieces continue to generate the highest revenue, yet home-office furnishings post the fastest growth thanks to entrenched hybrid-work habits. Wood remains the favored material, but advanced plastics and polymers gain traction as suppliers pursue lighter, eco-friendly alternatives.
Key Report Takeaways
- By product, living room & dining room furniture led with 38.21% share of the North America home furniture market size in 2025; home-office furniture is projected to grow at a 7.29% CAGR through 2031.
- By material, wood accounted for 62.21% share of the North America home furniture market size in 2025, whereas plastics & polymers are forecast to advance at a 6.55% CAGR between 2026-2031.
- By price range, the mid-range segment held 45.84% share of the North America home furniture market size in 2025, while premium goods are expected to register the highest CAGR of 5.11% to 2031.
- By distribution channel, specialty stores represented 36.02% of the North America home furniture market size in 2025, but online channels are projected to expand at a 8.85% CAGR.
- By geography, the United States dominated with 80.32% of North America home furniture market share in 2025; Mexico is anticipated to deliver the quickest growth at a 6.08% CAGR through 2031.
Note: Market size and forecast figures in this report are generated using Mordor Intelligence’s proprietary estimation framework, updated with the latest available data and insights as of 2026.
North America Home Furniture Market Trends and Insights
Drivers Impact Analysis*
| Driver | (~) % Impact on CAGR Forecast | Geographic Relevance | Impact Timeline |
|---|---|---|---|
| Rising residential construction & home remodeling | +1.2% | Global, strongest in US South and West | Medium term (2-4 years) |
| E-commerce penetration & omni-channel retailing | +1.8% | North America & EU, APAC spillover | Short term (≤ 2 years) |
| Growing demand for multifunctional & modular furniture | +0.9% | Global, urban centers priority | Long term (≥ 4 years) |
| Rising consumer spending on home décor post-COVID | +0.7% | North America core, selective international | Short term (≤ 2 years) |
| Rapid adoption of AR room-visualization tools | +0.5% | North America, Europe early adoption | Medium term (2-4 years) |
| Surge in sustainable, FSC-certified timber procurement | +0.4% | Global, regulatory compliance driven | Long term (≥ 4 years) |
| Source: Mordor Intelligence | |||
Rising Residential Construction Fuels Demand
Housing starts reached 1.50 million annualized units in February 2025, an 11% monthly jump that signals a solid construction recovery. Single-family starts alone totaled 1.11 million units, underpinning steady demand for full-home furnishing packages. Remodeling outlays are forecast to climb 1.2% to USD 509 billion in 2025, further broadening the addressable base for replacement and upgrade purchases. Each housing completion typically triggers a burst of furniture spend, and historical data show an 80% correlation between existing-home transactions and large furniture purchases. Regional codes that promote energy-efficient buildings intensify interest in sustainably sourced materials, aligning with consumer eco-preferences. Taken together, the construction and remodeling cycle offers durable support to the North America home furniture market.
E-commerce and Omnichannel Expansion
Online sales are rising at a 9.18% CAGR, making digital the fastest-growing distribution route[2]Retail Technology Innovation Hub, “Hybrid Furniture Shopping Dominates,” retailtechinnovationhub.com. . IKEA’s USD 2.2 billion omnichannel outlay elevated its U.S. e-commerce revenue to USD 1.9 billion and lifted total share by 13.6% over five years. Wayfair reports that 64.5% of 2024 orders came from mobile devices, with average ticket size improving to USD 290. Hybrid shopping now guides 45% of total furniture purchases and 62% of millennial transactions as shoppers research online and validate in stores. Augmented-reality tools grew sixfold since 2020, delivering 150% higher conversion rates and cutting returns by 25% when customers preview 3-D models at scale. Retailers that blend robust websites with experiential showrooms are best placed to capture this channel shift and reinforce the North America home furniture market.
Multifunctional Furniture Meets Space Optimization
Remote-work patterns have outlasted early pandemic surges, spurring ongoing demand for hybrid pieces that serve multiple purposes at home. Home-office furniture is expanding at a 7.65% CAGR, the highest of any product line in the North America home furniture market. Nearly 58% of consumers now seek advanced visualization tools before purchasing convertible items such as wall beds and nesting workstations. Steelcase booked 9% year-over-year order growth in Q4 FY 2025, confirming sustained appetite for ergonomic designs that toggle between professional and personal settings. Brands like Resource Furniture have launched direct-to-consumer platforms featuring 360-degree product views to reduce buyer hesitation over complex transformations. Gen Z and millennials are expected to account for 70% of future furniture spend, favor convenience and adaptability, making multifunctional innovation a cornerstone growth lever.
Post-COVID Investment in the Home
Households continue to channel discretionary funds into home improvements, with 47% spending more than USD 1,000 on furnishings annually and 42% planning further increases. Williams-Sonoma outperformed expectations in Q3 2024, citing steady share gains despite top-line softness in certain categories. RH grew revenue 8.1% to USD 811.7 million in the same quarter by leaning into high-touch design galleries that justify premium prices. Although inflation concerns segment shoppers by income, value-oriented chains like Bob’s Discount Furniture are still expanding footprints to satisfy bargain hunters. The “nesting” trend that began in 2020 persists as consumers seek comfort and aesthetics that endure beyond economic cycles.
Restraints Impact Analysis*
| Restraint | (~) % Impact on CAGR Forecast | Geographic Relevance | Impact Timeline |
|---|---|---|---|
| Volatility in raw-material (lumber & foam) prices | -1.1% | Global, North America acute | Short term (≤ 2 years) |
| Supply-chain disruptions & high freight costs | -0.8% | Global, Asia-Pacific origin | Medium term (2-4 years) |
| Tightening flammability & formaldehyde regulations | -0.3% | North America, Europe expansion | Long term (≥ 4 years) |
| Skilled-labor shortages in upholstery manufacturing | -0.4% | North America core, regional variation | Medium term (2-4 years) |
| Source: Mordor Intelligence | |||
Raw-Material Price Instability
Lumber prices averaged USD 577 per thousand board-feet in March 2025, 22% higher year-over-year as tariffs threaten to climb to 39.5% on Canadian imports [3]ResourceWise, “Tariffs Could Upend North American Lumber Market,” resourcewise.com. . Foam, a petroleum derivative essential for upholstered goods, remains exposed to energy-market swings that ripple through the North America home furniture market. Manufacturers such as Flexsteel pass surcharges through to buyers to protect margins, yet extended cost spikes can temper volume growth. Tight supply also nudges producers toward engineered composites and recycled polymers, though these substitutes introduce their own cost curves. Input volatility, therefore, chips away at potential CAGR gains until pricing normalizes.
Supply-Chain Bottlenecks
Even after pandemic peaks receded, global furniture logistics face lingering congestion at ports, container backlogs, and trucking labor gaps. Product lines sourced from Asia still see occasional reference rates double 2019 levels, compressing retail margins across the North America home furniture industry. Ethan Allen limits exposure by manufacturing 75% of its inventory in the United States, Mexico, and Honduras, shortening lead times and sidestepping volatile trans-Pacific freight costs. Still, most suppliers hold higher-than-normal safety stock, tying up working capital and reducing agility. Persistent chokepoints therefore weigh on cost structures and delivery reliability for at least the medium term.
*Our forecasts treat driver/restraint impacts as directional, not additive. The impact forecasts reflect baseline growth, mix effects, and variable interactions.
Segment Analysis
By Product: Versatile Growth in a Room-Centric Mix
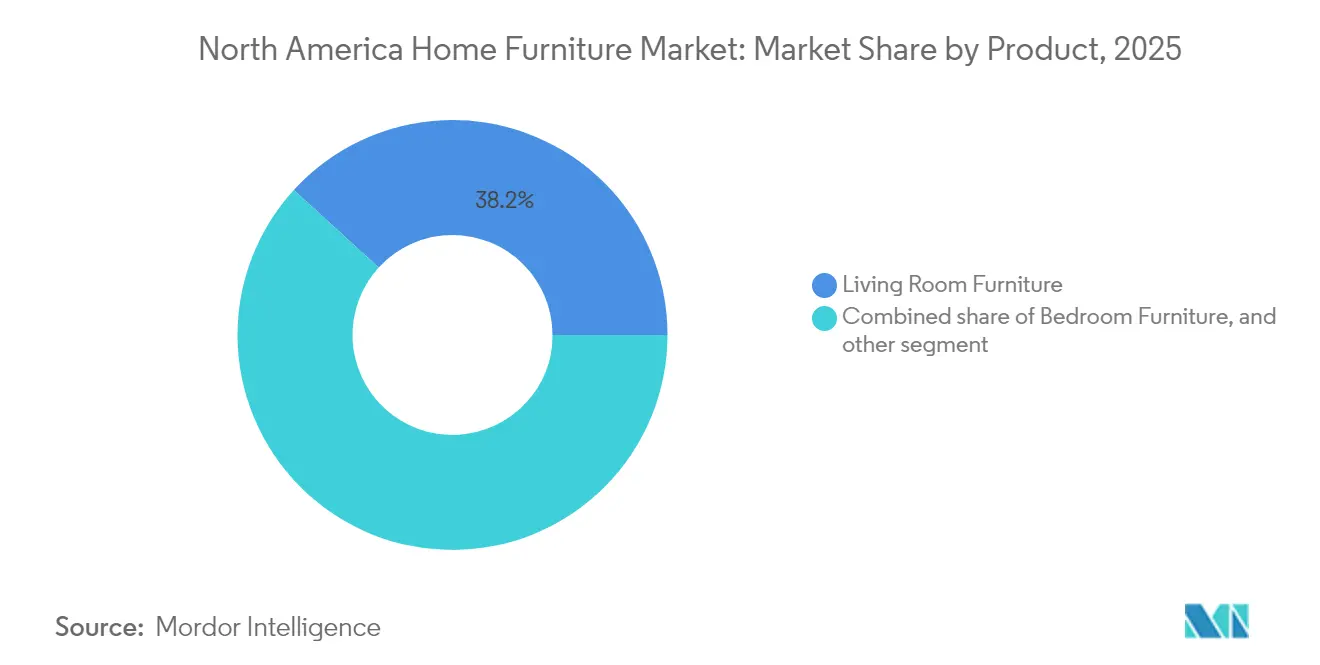
Living room & dining room products controlled 38.21% of 2025 revenue, underscoring their central role in household furnishing cycles. The segment’s breadth from sofas to sideboards allows brands to craft design stories that encourage multiple-piece purchases, supporting basket size in the North America home furniture market. Meanwhile, home-office pieces top the growth chart with a 7.29% CAGR as hybrid employment cements lasting workspace needs at home. Steelcase and other office specialists continue to translate ergonomic corporate know-how into residential solutions, spurring product cross-pollination. Bedroom sets maintain a 28.74% share, propelled by mattress replacement schedules and growing consumer focus on sleep wellness. Outdoor categories show healthy momentum as homeowners extend living space with weather-resistant collections that withstand year-round use. Modular and accent pieces further blur traditional product boundaries, reflecting lifestyle demands for flexibility. As consumers prioritize fewer, multifunctional pieces that offer high design impact, product development pipelines reorient around adaptability.
A widening range of price points keeps room-based categories vibrant. Mid-range collections leverage time-tested materials and cost-efficient mass production, sustaining broad appeal. Higher-end sub-lines add upscale finishes and artisan detailing to capture discretionary spending. Varying aesthetic trends Scandinavian minimalism, industrial chic, and maximalist color palettes, rotate through bestseller lists, encouraging frequent style refreshes that feed repeat purchases. The result is a dynamic product matrix where staple categories still lead, but faster-moving niches lift the aggregate North America home furniture market.


By Material: Wood Strength Faces Modern Alternatives
Wood’s 62.21% share proved resilient in 2025 as buyers favored organic textures and timeless craftsmanship. Advanced finishing technologies such as water-based lacquers and UV-cured stains enhance durability and appeal to eco-conscious shoppers. Yet plastics and polymers are projected to progress at a 6.55% CAGR, buoyed by innovations that lower weight and enable intricate designs not feasible in solid timber. Recycled and bio-based resins reduce environmental impact, expanding acceptance among sustainability-minded households. Metal frames gain visibility in mixed-media pieces that deliver industrial aesthetics and structural rigidity. Composite boards that combine wood fibers with synthetic binders offer moisture resistance, tackling common pain points such as warping in humid climates. FSC-certified sourcing policies adopted by 48 leading retailers underscore rising accountability across the North America home furniture industry . As regulation tightens around volatile organic compounds and product stewardship, material innovation will remain pivotal to competitive positioning.
Composite adoption also diversifies supply chains, reducing over-reliance on lumber markets vulnerable to tariff shocks. Manufacturers that invest early in recyclable polymers and closed-loop processes may enjoy cost advantages once extended-producer-responsibility programs become mainstream. Consumers, in turn, gain more lightweight, flat-pack options that simplify delivery and assembly, reinforcing e-commerce growth. This shifting material landscape ultimately blends tradition with technology, widening the palette of design possibilities for the North America home furniture market.
By Price Range: Middle Anchors as Premium Outperforms
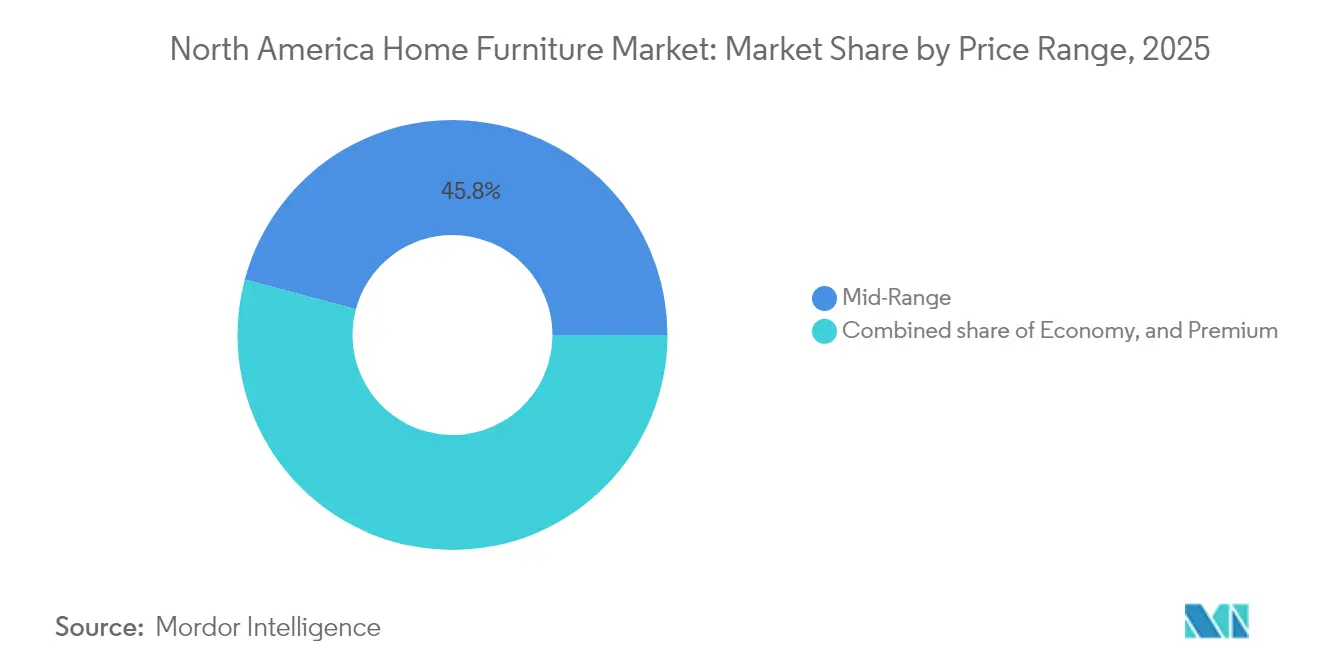
Mid-range merchandise captured 45.84% of sales in 2025, anchored by a value proposition that balances affordability with acceptable quality. These lines cater to broad demographics, benefit from large-scale manufacturing efficiencies, and dominate floor space at major chains. However, premium products outpace overall market growth at a 5.11% CAGR, powered by affluent consumers who equate elevated design with enhanced well-being. RH’s upscale galleries illustrate the pull of experiential retail, generating both foot traffic and high average tickets that lift profitability. Eco-labeled hardwoods, artisan joinery, and customizable finishes justify premium pricing, especially as consumers view furnishings as long-term investments.
At the opposite end, economy lines grapple with thin margins exposed to input inflation. Yet selective expansions by value chains suggest the lowest tier still finds traction among price-sensitive households. A noteworthy trend is the willingness of 87% of surveyed shoppers to pay 5-10% more for demonstrably sustainable goods. This preference can blur strict price segmentation, enabling mid-range and premium labels to trade on social and environmental credentials rather than solely on design cues. Consequently, the North America home furniture market evolves toward a K-shaped profile where both budget and luxury niches flourish, while middle players depend on differentiation to maintain share.
By Distribution Channel: Stores Hold Sway as Digital Surges
Specialty retailers retained a 36.02% share in 2025, leveraging curated assortments, in-person design services, and immediate product inspection. Many now augment in-store experiences with 3-D visualization kiosks and clienteling apps that keep pace with digital expectations. Nonetheless, online platforms exhibit a 8.85% CAGR, the swiftest of all channels, buoyed by user-friendly returns policies, virtual-reality previews, and efficient last-mile delivery. Major home centers combine DIY-oriented assortments with installation services, capturing remodeling-linked purchases. Department stores and hypermarkets face margin-squeezing competition from specialized formats but retain certain regional loyalties.
Hybrid paths research online, purchase offline, or vice versa dominate 45% of transactions, compelling retailers to integrate inventory systems, unified pricing, and consistent content across touchpoints. Click-and-collect models trim freight outlays on bulky items while satisfying instant-gratification needs. Companies that sync logistics data with shopper analytics better forecast demand, reducing markdown risk. Overall, channel fluidity gives consumers unprecedented flexibility, but also raises the service bar for the North America home furniture market.
Geography Analysis
The United States held 80.32% of regional revenue in 2025 on the back of high housing turnover and deep retail infrastructure. February 2025 housing starts reached 1.50 million annualized units, an 11% month-over-month surge feeding durable furniture demand. Remodeling, forecast at USD 509 billion for 2025, supports ongoing replacement cycles and drives sales of premium fixtures. Southern and Western states lead new construction while Northeastern urban areas lean on renovation, fostering diverse product mixes. Consumer confidence indicators of 65 among contractors and 68 among design firms at Q1 2025 highlight supportive sentiment. Strict adherence to CARB formaldehyde caps and CPSC flammability standards raises compliance costs yet differentiates quality-focused suppliers. These factors collectively cement the United States as the principal engine of the North America home furniture market.
Canada contributes 9.58% of revenue, reflecting similar aesthetic preferences and integrated North-South supply chains. Leon’s Furniture logged 1.8% sales growth in 2024, underscoring resilience despite supply-chain volatility. Potential 39.5% lumber tariffs threaten cross-border cost structures but could shield domestic furniture makers from raw-material competition if fully enacted. Retailers like The Brick secure share with localized merchandising, while IKEA continues footprint expansion in major metros. The market benefits from intense urban condo development that favors space-saving and modular designs.
Mexico, while smaller, is the fastest-growing geography at 6.08% CAGR through 2031. The country ranks sixth in global furniture exports, shipping 94% of its output valued at USD 2.5 billion to the United States. Nearshoring momentum attracts investments from La-Z-Boy, Herman Miller, and Ashley Furniture into hubs such as Jalisco and the northern border corridor. Domestic demand also rises as urban middle-class purchasing power climbs. USMCA trade provisions further streamline northbound logistics, positioning Mexican factories as strategic alternatives to Asian sourcing. Collectively, this tri-country landscape balances mature U.S. demand with emerging Mexican growth, underpinning stable expansion for the North America home furniture market.
Regulatory Landscape
The North America home furniture market operates under a mix of federal and state or provincial requirements covering product safety, chemical emissions, and labeling. In the United States, the Consumer Product Safety Commission (CPSC) enforces a mandatory safety standard for clothing storage units under 15 USC 2056f, focusing on stability and tip-over prevention, while voluntary consensus standards referenced by industry are also used as common design benchmarks. In Canada, Health Canada regulates under the Canada Consumer Product Safety Act (CCPSA) with a post-market approach, and it has treated non-conformance with ASTM F2057 for free-standing clothing storage units as a potential danger to human health or safety.
Trade policy and materials compliance also shape cost structures and sourcing decisions. In September 2025, a White House action on adjusting imports of timber, lumber, and derivative products into the United States reinforced the need for importers and manufacturers to manage wood input exposure alongside furniture-specific compliance obligations. In March 2026, Health Canada updated its danger to human health or safety assessment for free-standing clothing storage units, stating that the 2023 edition of ASTM F2057 is the reference point it considers adequately protective, tightening expectations for manufacturers selling into Canada and for North American brands with cross-border assortments.
Value Chain Analysis
The value chain runs from raw materials (lumber, engineered wood, metals, plastics and polymers, foam, textiles, and finishes) to component manufacturing and assembly (casegoods and upholstery), followed by quality and compliance testing before products move into distribution. North America relies on a blended sourcing model, with domestic and regional production supporting shorter lead times and compliance needs, while import flows continue to feed mass-volume categories. Ethan Allen illustrates the localization lever by producing a large share of inventory within the United States, Mexico, and Honduras, which reduces dependence on trans-Pacific freight and supports faster replenishment.
Downstream, large retailers and e-commerce players shape demand planning, merchandising, and last-mile delivery for bulky goods, with specialty stores still carrying weight in design-led selling. Logistics constraints and trade uncertainty have pushed the chain toward higher safety stock and more regional warehousing, particularly near major consumption hubs, which helps omnichannel offerings such as faster ship times and smoother returns. Mexico also remains a critical regional manufacturing and export node under USMCA, complementing US production clusters and giving brands additional flexibility when configuring supplier networks around cost, speed, and tariff exposure.
Competitive Landscape
The leading players hold a significant portion of industry revenue, reflecting moderate competitive concentration. Ashley Furniture leads the market, supported by vertical integration across manufacturing, distribution, and a global footprint of 1,000 stores. IKEA follows, having expanded its flat-pack model into a robust omnichannel presence, underpinned by a USD 2.2 billion digital transformation. Williams-Sonoma ranks third, distinguishing itself through a collection of premium heritage brands. Strategic moves emphasize hybrid retail: IKEA plans eight new Plan & Order points in 2025, while Williams-Sonoma scales its Design Crew service to meld online consultations with in-home styling.
Supply-chain localization is another battleground. Ethan Allen’s North American manufacturing footprint cushions freight volatility and speeds replenishment, helping the brand weather global disruptions. RH pursues experiential luxury by situating large-format galleries in statement properties, generating USD 31 million in combined in-store and online sales at the two-year mark of its U.K. estate. Smaller direct-to-consumer brands exploit digital prowess and transparent pricing to erode incumbent share, especially among millennial cohorts. Sustainability credentials, including FSC certification and carbon-neutral roadmaps, are growing tiebreakers in contract wins, prompting many suppliers to publish detailed ESG benchmarks.
M&A keeps reshaping the field. Furniture Mart USA’s acquisition of Becker Furniture boosted its Midwest footprint to 67 stores. Wayfair’s re-focus on core North American markets exiting Germany and trimming 730 roles signals a profitability pivot rather than pure scale chase. Meanwhile, American Freight’s Chapter 11 exit removes a budget player and opens regional whitespace for rivals. In sum, nimble omnichannel execution, supply-chain resilience, and verifiable sustainability promises underpin future success in the North America home furniture market.
North America Home Furniture Industry Leaders
Ashley Furniture Industries Inc.
Ikea (Ingka Holding B.V.)
Williams-Sonoma Inc. (Pottery Barn, West Elm)
La-Z-Boy Inc.
Wayfair Inc.
- *Disclaimer: Major Players sorted in no particular order


Market Opportunities and Future Outlook
Furniture-as-a-Service and subscription-style access models create whitespace for retailers and manufacturers to convert episodic purchases into recurring relationships, especially for renters, students, and households that refresh furniture more frequently. The April 2026 launch of Williams-Sonoma, Inc.'s Dormify brand underscores active portfolio expansion aimed at college and small-space living, a customer set that aligns with flexible ownership and bundle-based furnishing programs. As online penetration rises and hybrid shopping becomes more common, subscription offerings can be bundled with virtual design, delivery, assembly, and swap or buyout options to improve lifetime value while managing returns and reverse logistics.
Smart-connected (IoT) furniture is another opportunity as manufacturers add embedded features and companion services to differentiate in increasingly mature room categories. Product development and capacity commitments outside the region are being aligned with North American demand for these lines; for instance, in July 2026 MotoMotion disclosed board approval for a USD 45 million smart furniture capacity expansion to add output for smart sofas and smart beds, primarily targeting the North American market. That creates room for North American retailers and brands to curate connected assortments, while compliance and durability requirements, along with repair and service networks, become key enablers for scaling smart furniture beyond early-adopter segments.
Recent Industry Developments
- July 2026: MotoMotion disclosed board approval for a USD 45 million smart furniture capacity expansion project to add capacity for smart sofas and smart beds targeted primarily at North America. The move signals increasing supplier commitment to connected seating and sleep categories, pushing retailers to strengthen merchandising, service, and warranty capabilities for electronics-enabled furniture.
- April 2026: Williams-Sonoma, Inc. launched Dormify, expanding its brand portfolio into college and small-space living. This broadens addressable demand in compact, modular, and dorm-oriented assortments, while supporting cross-selling of storage, seating, and organization solutions through an omnichannel playbook.
- February 2025: Furniture Mart USA acquired Becker Furniture, adding seven Minnesota stores and one distribution center and bringing its footprint to 67 locations. The acquisition increased regional scale in the Midwest and strengthened store-based delivery and service coverage for large-ticket home furniture purchases.


Research Methodology Framework and Report Scope
Market Definition and Coverage
For this methodology, the North America home furniture market is defined as the value of furniture products purchased for residential use across the United States, Canada, and Mexico, captured at current prices and reported in USD.
Scope exclusions: We exclude appliances, consumer electronics, mattresses when they are sold as a separate bedding-only category, and installation or remodeling services bundled with furniture purchases.
Segmentation Overview
- By Product
- Living Room and Dining Room Furniture
- Bedroom Furniture
- Kitchen Furniture
- Home Office Furniture
- Bathroom Furniture
- Outdoor Furniture
- Other Furniture
- By Material
- Wood
- Metal
- Plastic and Polymer
- Others
- By Price Range
- Economy
- Mid-Range
- Premium
- By Distribution Channel
- Home Centers
- Specialty Furniture Stores (incl. exclusive brand outlets and local unorganized stores)
- Online
- Other Distribution Channels (hypermarkets, supermarkets, teleshopping, departmental stores, etc.)
- By Geography
- Canada
- United States
- Mexico
Data Sources, Market Sizing, and Validation
Desk Research
Desk research is used to set the market boundary and build the starting demand indicators before any modeling is done. We relied on public datasets such as U.S. Census Bureau retail trade tables, Statistics Canada retail and household spending releases, Mexico INEGI trade and production indicators, and UN Comtrade import and export series for furniture-related categories.
We also reviewed sources such as the U.S. Bureau of Labor Statistics inflation series for furniture, housing turnover and construction indicators from agencies such as the U.S. Census Bureau, and relevant association publications to understand category mix and channel shifts. Company annual reports, investor presentations, and reputable business press were used to cross-check pricing moves, promotion intensity, and supply chain changes. Where needed, paid subscriptions for company financials and a shipment-level import-export database were referenced to validate directionally the supplier landscape and trade flows. These references are illustrative, and many other sources were also used for data collection, validation, and clarification during the study.
Primary Interviews and Surveys
Primary work was used to test what desk research cannot fully explain, especially around category definitions, channel mix, and realistic price movement by product group. We spoke with manufacturers, importers, retailers, distributors, and large buyers across the United States, Canada, and Mexico, then rechecked a few assumptions when the model outputs moved away from known demand signals.
Distribution of primary research fieldwork respondents
| Company type | Respondent position | Region |
|---|---|---|
| Top tier: 37% | CXOs: 14% | |
| Mid tier: 45% | Functional/Unit leaders: 28% | |
| Smaller Players: 18% | Managers: 58% |
Market-Sizing & Forecasting
The core sizing logic uses a top-down build where household and housing activity indicators are translated into a furniture demand pool, which is then reconciled with retail sales signals and trade movement for furniture categories. To keep the result grounded, we corroborated totals using selective bottom-up approximations, such as sampled average selling prices multiplied by estimated unit volumes for a few high-share categories, then channel checks with retailers and distributors.
Key inputs used in the model include furniture CPI and broader inflation trends, existing home sales and housing starts, renovation and home improvement activity, import dependence and category-level trade values, and the online share shift versus store-based sales. When a variable was noisy in one country, nearby indicators were used as proxies and then adjusted during expert checks. For forecasting, we ran scenario analysis around housing cycle direction and price normalization, and the final view was aligned to what interviewees considered realistic for promotions, freight, and replacement demand over the next few years.
Data Validation & Update Cycle
Model outputs are validated through multiple checks so totals do not drift away from observable market signals. We compare results against independent indicators such as retail furniture sales trends, import value movements, and inflation-adjusted spending patterns, then investigate sharp jumps that do not match known events.
A multi-step internal review is followed, and specific outliers trigger re-contact with sources to confirm whether the driver was a scope issue, a pricing assumption, or a timing effect. Reports are refreshed annually, and interim updates are done when material events occur, including policy changes that affect imports or major shifts in housing demand. Before delivery, a final analyst pass is completed so clients receive the most current view available.
Mordor Intelligence's North America Home Furniture Market Size Compared With Other Published Estimates
Published market sizes for North America home furniture do not always match because the boundary is not chosen the same way, and the price basis and timing can differ. Differences usually come from what is counted as furniture versus adjacent home categories, how inflation is handled, and whether the number reflects retail sales, manufacturer revenue, or combined spending.
By tracking retail trade series, import values, and furniture CPI together, Mordor Intelligence keeps the number tied to residential furniture demand in the United States, Canada, and Mexico, and it reduces double counting between domestic production and imported goods. Some estimates appear to fold in broader furniture and furnishings or home goods, and a few rely on aggressive housing recovery assumptions without rechecking the implied spending per household.
Benchmark comparison
| Source | Market Size | Gaps in Research Methodology |
|---|---|---|
| Mordor Intelligence | USD 202.25 B (2025) | |
| Industry Research Publisher A | USD 233.00 B (2024) | The scope appears broader and may include a wider set of home furnishings categories, and the year basis differs, which can inflate the comparison if inflation and currency timing are not aligned. |
| Trade Journal B | USD 173.10 B (2023) | This number is aligned to US retail sales for furniture and home furnishings, so it is not a full North America total and it reflects a retail-only lens rather than a regional market build. |
Overall, the spread is largely explained by scope and geography, followed by how price movement is treated across years. Our approach stays repeatable because it is built from clear public indicators, then adjusted through interviews when category mix or channel behavior shifts, which makes the final total easier to trace and update.


Key Questions Answered in the Report
How large is the North America home furniture market in 2026?
It stands at USD 211.88 billion and is forecast to grow to USD 267.29 billion by 2031 at a 4.76% CAGR.
Which product category is expanding the fastest?
Home-office furniture posts the strongest momentum with a projected 7.29% CAGR as hybrid work remains entrenched.
What channel will grow quickest in the next five years?
Online sales are expected to rise at a 8.85% CAGR, driven by augmented-reality tools and omnichannel investments.
Which material type is gaining share the most rapidly?
Plastics and polymers are set to grow at 6.55% CAGR thanks to their lightweight, sustainable profile.
Why is Mexico’s furniture sector drawing attention?
Nearshoring under USMCA has spurred foreign investment, making Mexico the fastest-growing regional market at 6.08% CAGR while exporting 94% of output to the United States.
Page last updated on:






