
Market Overview
| Study Period | 2021 - 2031 |
|---|---|
| Forecast Data Period | 2026 - 2031 |
| Historical Data Period | 2021 - 2024 |
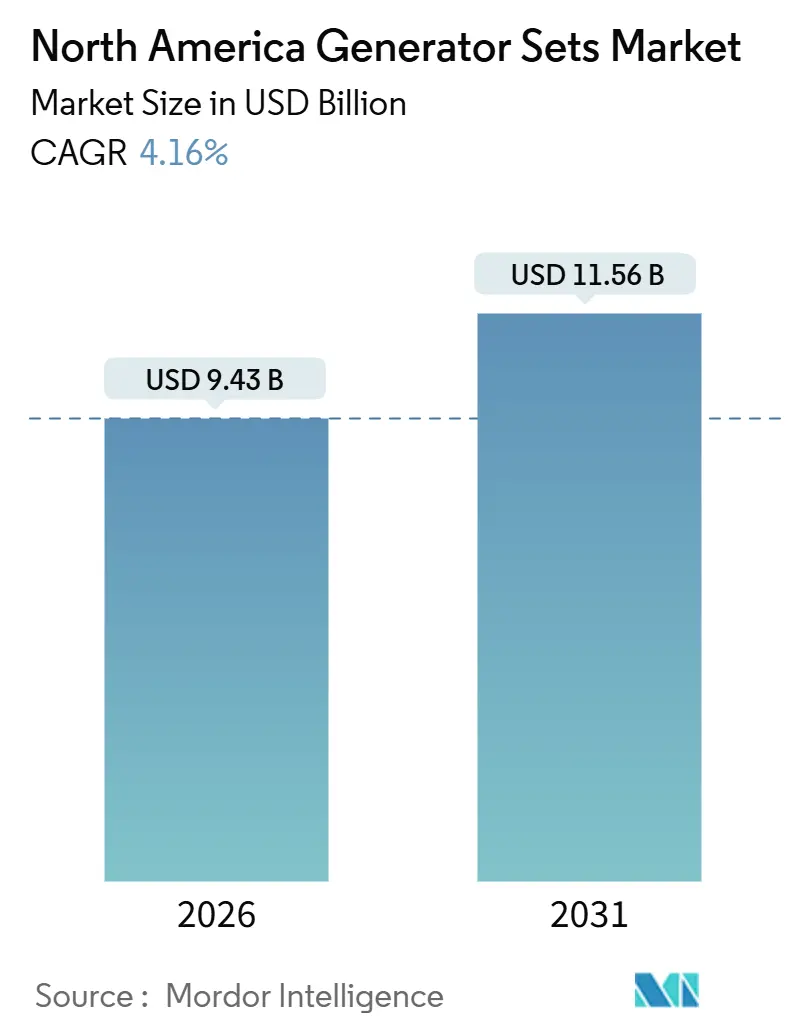
| Market Size (2026) | USD 9.43 Billion |
| Market Size (2031) | USD 11.56 Billion |
| Growth Rate (2026 - 2031) | 4.16 % |
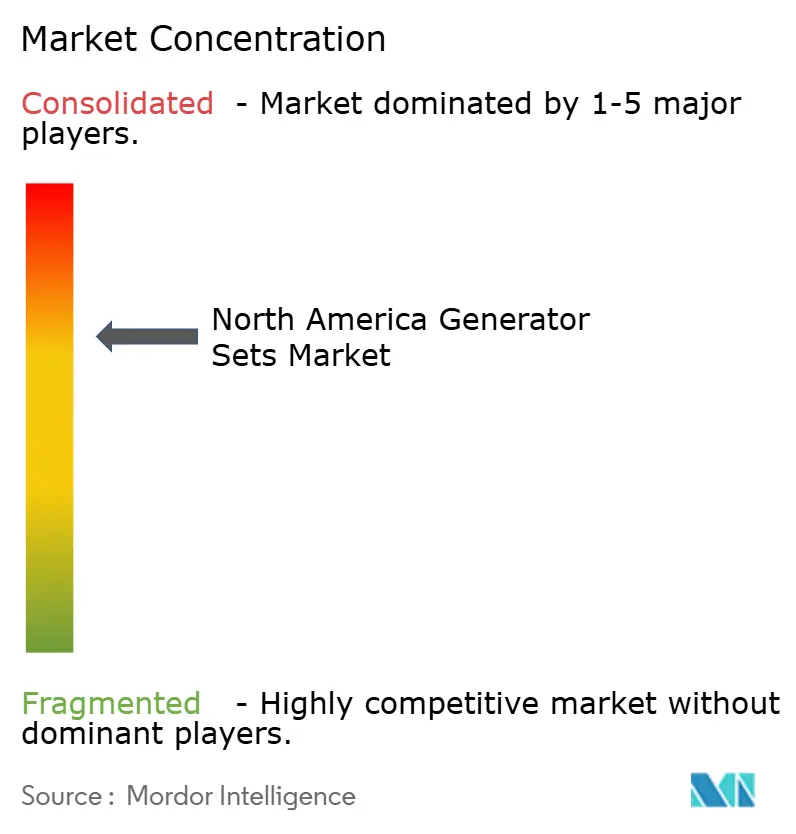
| Market Concentration | Medium |
Major Players *Disclaimer: Major Players sorted in no particular order Image © Mordor Intelligence. Reuse requires attribution under CC BY 4.0. | |
North America Generator Sets Market Analysis by Mordor Intelligence
The North America Generator Sets Market size is estimated at USD 9.43 billion in 2026, and is expected to reach USD 11.56 billion by 2031, at a CAGR of 4.16% during the forecast period (2026-2031).
Commercial building owners, data-center operators, and utilities are the largest contributors to this upturn, but the composition of demand is shifting toward natural-gas and dual-fuel units that align with tightening diesel-emissions rules.[1]U.S. Environmental Protection Agency, “Non-road Diesel Engine Emission Standards,” epa.gov Standby-capacity contracts with hyperscale data-center clients are now longer and larger than those signed by traditional industrial buyers, creating multi-year order backlogs for 375 to 750 kVA modular arrays. Utilities are also integrating sub-5 MW gensets as fast-response reserves after the streamlined interconnection provisions in FERC Order 2023 reduced approval lead times and study costs. At the same time, frequent extreme-weather events are prompting healthcare systems and commercial real-estate portfolios to replace rental units with owned assets that meet Tier 4 Final compliance and maintain at least 96 hours of on-site fuel.[2]Climate Central, “Weather-related Power Outage Trends,” climatecentral.org
Key Report Takeaways
- By capacity, the 75 to 375 kVA segment led with 46.51% of 2025 revenue, while the 375 to 750 kVA band is forecast to post the quickest 6.68% CAGR through 2031.
- By fuel type, diesel remained dominant at 64.83% of 2025 installations, yet natural-gas gensets are expanding at a 10.11% pace into 2031.
- By application, standby power held a 51.72% share in 2025, whereas micro-grid and hybrid-support deployments are rising at a 10.33% CAGR.
- By end-user, industrial and manufacturing facilities accounted for 48.95% of demand in 2025; data centers are projected to grow fastest at 11.57% a year.
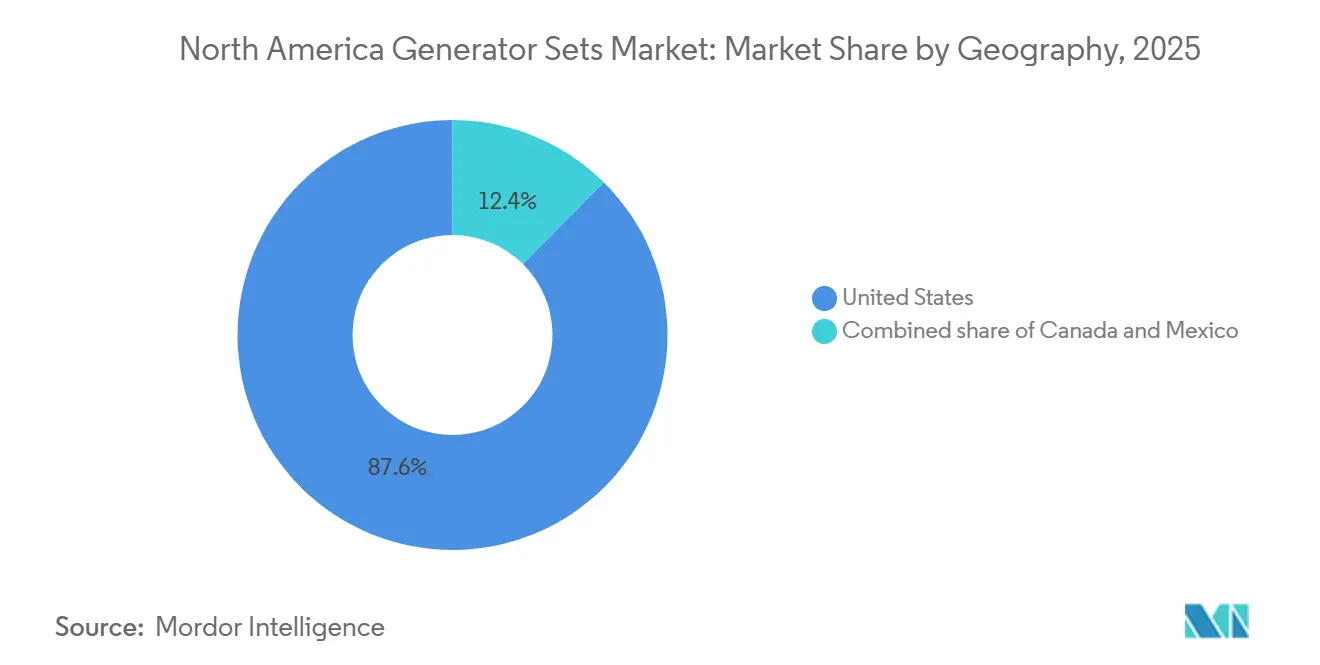
- By geography, the United States contributed 87.57% of regional revenue in 2025 and is on track for a 4.32% CAGR through 2031.
Note: Market size and forecast figures in this report are generated using Mordor Intelligence’s proprietary estimation framework, updated with the latest available data and insights as of January 2026.
North America Generator Sets Market Trends and Insights
Drivers Impact Analysis*
| Driver | (~) % Impact on CAGR Forecast | Geographic Relevance | Impact Timeline |
|---|---|---|---|
| Increasing demand from healthcare & construction sectors | +0.8% | United States (Texas, Florida, California), Canada (Ontario, Alberta) | Medium term (2-4 years) |
| Spike in weather-related outages prompting standby adoption | +1.1% | United States (Gulf Coast, Southeast, Northeast), Canada (Atlantic provinces) | Short term (≤ 2 years) |
| Data-center capacity expansion across North America | +1.3% | United States (Virginia, Texas, Oregon, Arizona), Canada (Quebec) | Long term (≥ 4 years) |
| CAPEX incentives for resiliency in ESG frameworks | +0.6% | United States (corporate headquarters in major metros), Canada (Toronto, Vancouver) | Medium term (2-4 years) |
| Micro-grid interconnection rules favor sub-5 MW gensets | +0.7% | United States (California, New York, Texas), Canada (British Columbia, Ontario) | Long term (≥ 4 years) |
| Source: Mordor Intelligence | |||
Data-Center Capacity Expansion Across North America
Hyperscale and colocation operators are adding backup generation at a pace that surpasses legacy enterprise facilities. Lawrence Berkeley National Laboratory projects regional data-center power demand to jump from 97 TWh in 2024 to 130 TWh by 2030, a 34% rise that must be met with redundant on-site gensets. Capital markets estimates indicate roughly 40% of the USD 1 trillion global data-center buildout through 2030 will land in North America, channeling billions into power and cooling infrastructure. Sovereign-AI workloads are further driving specifications for 2,000 kVA-plus machines, often with dual-fuel capability to hedge diesel-price volatility and advance decarbonization objectives. Cummins reported a 28% year-over-year increase in data-center orders during its Q3 2025 earnings call, noting that automatic transfer switches and cloud monitoring are now standard in hyperscaler requests. These factors explain why the 375 to 750 kVA segment is accelerating despite the market’s matured installed base.
Spike in Weather-Related Outages Prompting Standby Adoption
Climate Central recorded 180 major weather-related outages in 2024, 23% more than the prior year. U.S. Department of Energy data show average customer outage hours reached 8.2 in 2024, the highest since records began in 2013. Hospitals that once rented seasonal gensets are now acquiring permanent units to satisfy stricter life-safety codes, while commercial landlords include backup-power clauses in leases to avert business-interruption claims. Insurance providers are underwriting “outage” policies that mandate tested gensets and verified fuel reserves, effectively accelerating capital spending. Generac shipped 19% more residential and light-commercial units in Q2 2025, attributing the surge to Texas and Florida homeowners affected by multi-day blackouts. The construction sector mirrors the trend, as contractors in wildfire-prone zones specify on-site gensets to offset utility shutoffs.
Increasing Demand from Healthcare & Construction Sectors
CMS updated its Emergency Preparedness Rule in 2024, raising the mandatory fuel-reserve duration for critical-access hospitals from 72 to 96 hours. State inspectors in California, New York, and Florida are performing unannounced load tests, triggering an upgrade cycle favoring 750 to 2,000 kVA machines. Construction spending reached USD 2.1 trillion in 2024, with USD 1.1 trillion for non-residential projects that require temporary power, lighting, and HVAC. United Rentals allocated USD 450 million for power and HVAC fleet expansion in its 2024 capital program, underscoring rental-fleet importance during peak build phases. Modular construction further compresses schedules, raising peak site loads and tilting demand toward higher-capacity gensets that can be paralleled as work advances.
CAPEX Incentives for Resiliency in ESG Frameworks
Corporate ESG roadmaps now incorporate resilience metrics, unlocking budget lines for low-emission or dual-fuel standby assets. Asset managers in major metros use green-bond proceeds to fund natural-gas or renewable-diesel gensets that satisfy both uptime and emissions criteria, leveraging tax incentives and accelerated depreciation schedules enacted in the United States’ Inflation Reduction Act. Banks are bundling sustainability-linked loans with covenants tied to carbon intensity per operating hour, favoring gensets equipped with digital fuel-optimization software. These financial structures translate into tangible order flow for units that meet Tier 4 Final standards without performance trade-offs.
Restraints Impact Analysis*
| Restraint | (~) % Impact on CAGR Forecast | Geographic Relevance | Impact Timeline |
|---|---|---|---|
| Rising investments in distributed renewables & storage | -0.9% | United States (California, Texas, Northeast ISO), Canada (Ontario, Quebec) | Medium term (2-4 years) |
| Stricter EPA Tier 4 Final diesel emission norms | -0.7% | United States (all states, with California CARB overlay), Canada (federal standards) | Short term (≤ 2 years) |
| Escalating diesel & natural-gas price volatility | -0.5% | United States (regional variations by pipeline access), Mexico (Pemex supply constraints) | Short term (≤ 2 years) |
| Urban electrification codes limiting new diesel tanks | -0.4% | United States (New York City, Los Angeles, San Francisco, Chicago), Canada (Toronto, Vancouver) | Short term (≤ 2 years) |
| Source: Mordor Intelligence | |||
Rising Investments in Distributed Renewables & Storage
Lazard’s 2025 levelized-cost study priced lithium-ion storage for 4-hour discharge at USD 140 per megawatt-hour, down 25% from 2023 and close to diesel genset parity after fuel and maintenance are added.[3]Lazard, “Levelized Cost of Storage Analysis 2025,” lazard.com The U.S. Energy Information Administration expects utility-scale battery capacity to hit 50 GW by 2027, with another 15 GW behind the meter. California’s Self-Generation Incentive Program already channels 92% of its rebates to storage rather than gensets, signaling policy momentum toward zero-emission backup. Hybrid designs that blend batteries with downsized gensets moderate fuel consumption and emissions, yet still erode diesel-only demand. As storage prices fall, the revenue pool for traditional standby units narrows, especially for short-duration outage profiles.
Stricter EPA Tier 4 Final Diesel Emission Norms
Tier 4 Final mandates particulate-matter and nitrogen-oxide cuts of up to 90% versus Tier 3, requiring selective catalytic reduction, diesel particulate filters, and more complex fuel-injection systems. Compliance adds USD 8,000–15,000 on a typical 500 kVA unit and raises maintenance frequency due to diesel-exhaust-fluid handling and filter regeneration schedules. California Air Resources Board overlays add in-use fleet restrictions and annual emissions testing, with non-compliance fines up to USD 10,000 per violation.[4]California Air Resources Board, “In-Use Off-Road Diesel Regulation,” arb.ca.gov New York City’s permitting rules further require proof of Tier 4 certification before granting diesel-tank approvals. These constraints tilt purchasers toward natural-gas or dual-fuel machines that meet emissions caps without additional after-treatment.
*Our forecasts treat driver/restraint impacts as directional, not additive. The impact forecasts reflect baseline growth, mix effects, and variable interactions.
Segment Analysis
By Capacity: Mid-Range Dominance, Large-Unit Momentum
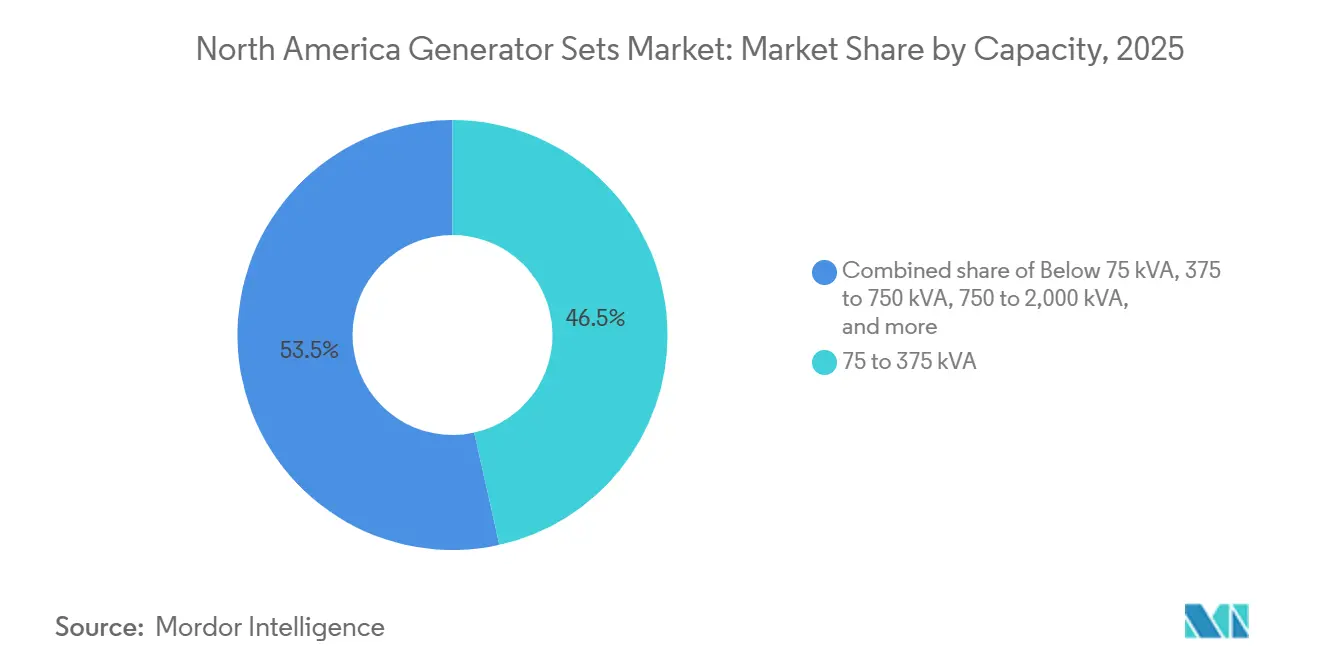
The 75 to 375 kVA class captured 46.51% of the North America generator sets market revenue in 2025, reflecting entrenched demand from commercial buildings and light-industrial facilities that depend on moderate backup power for HVAC, lighting, and safety systems. Notwithstanding its scale, growth in this tranche is tempered because replacements, not new builds, drive most orders. The 375 to 750 kVA band is forecast to deliver a 6.68% CAGR through 2031, as data-center edge nodes and hospital expansions adopt modular arrays with N+1 redundancy. This acceleration underscores how digital-economy infrastructure reshapes capacity profiles within the North America generator sets market.
Higher up the spectrum, units rated 750 to 2,000 kVA serve mid-sized industrial plants and water-treatment facilities, advancing in line with manufacturing investment. Above 2,000 kVA, bespoke engineering and long sales cycles keep volumes low but revenue impact high, especially for hyperscale data-center campuses and utility peaker installations. Cummins’ launch of a 3,000 kVA gas machine in 2025 that can synchronize with the grid in 10 seconds positions gensets as dispatchable reserves, broadening their role beyond emergency standby. The segment’s mixed outlook shows how the North America generator sets market share shifts alongside end-user power-quality requirements.


By Fuel Type: Diesel Entrenched, Gas Surging
Diesel held 64.83% of 2025 installations, underlining its energy density and logistical simplicity for remote or temporary sites. Yet the compliance burden of Tier 4 Final and local permitting is nudging buyers toward natural-gas units, which exhibit a robust 10.11% CAGR outlook through 2031. Pipeline expansions in Texas, Alberta, and the U.S. Northeast bolster the economic case for gas, while corporate emissions targets add qualitative impetus. Kohler’s 2025 dual-fuel controller that toggles between diesel and gas on cost or emissions criteria exemplifies product innovation aimed at flexibility.
Hybrid configurations that blend batteries with smaller gensets are also gaining share, especially in micro-grid projects that bid into demand-response markets. Renewable diesel receives policy boosts in California via Low Carbon Fuel Standard credits valued at up to USD 1.50 per gallon in 2025, but limited feedstock and cost premiums confine uptake. Propane and bi-fuel niches persist in rural regions without gas pipelines, though their slice of the North America generator sets market size continues to erode as infrastructure improves.
By Application: Standby Leads, Micro-Grid Growth
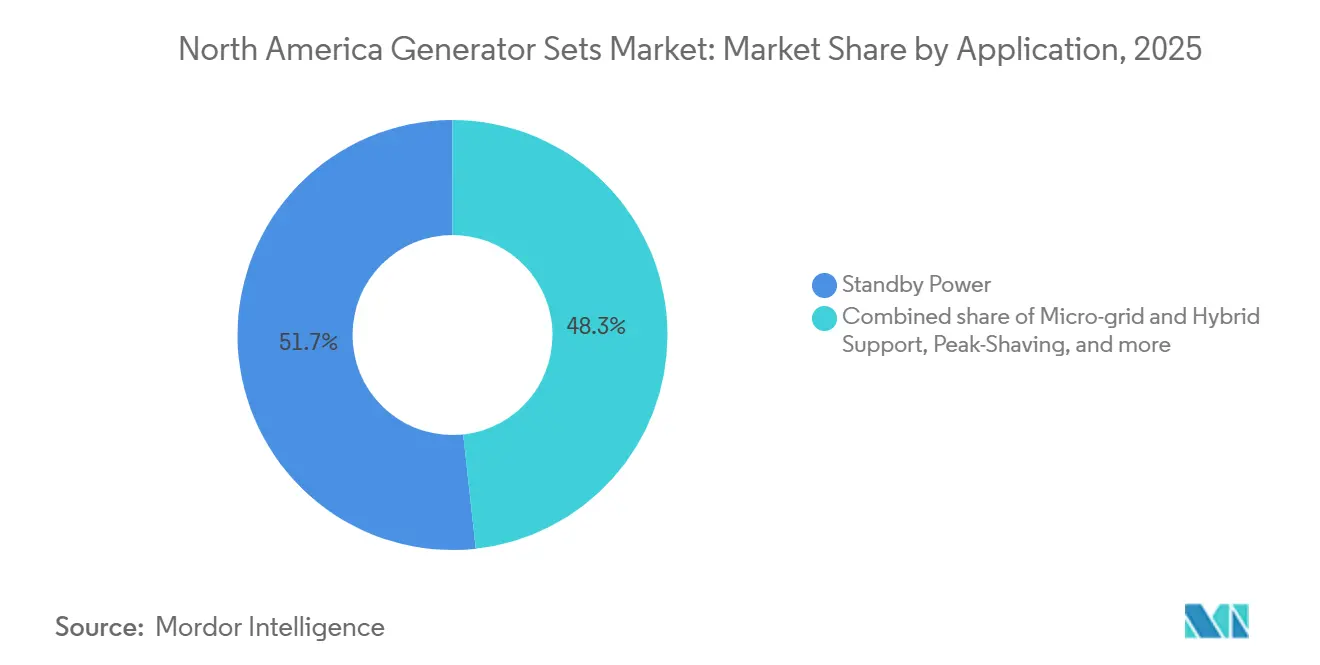
Standby installations commanded 51.72% of the North America generator sets market share in 2025, underpinned by building-code mandates and insurance requirements that dictate backup capacity even when utilization remains below 100 hours per year. The niche is stable but not fast-growing. Micro-grid and hybrid-support uses are advancing at 10.33% a year as utilities and large campuses weave gensets into distributed-generation schemes that supply ancillary services like frequency regulation. FERC Order 2023 removes key interconnection hurdles, enabling genset owners to monetize availability during grid stress and thereby raising ROI.
Prime-power and continuous-duty segments trail overall growth, limited by commodity cycles in oil, gas, and mining. Peak-shaving demand remains regionally strong in markets with punitive demand charges but faces rising competition from batteries. Rental fleets fill event and emergency gaps, with United Rentals reporting double-digit revenue gains in power equipment after 2024 hurricane activity in the Southeast. The emerging pattern suggests the North America generator sets market size for hybrid applications will expand faster than for pure-standby units as grid-service monetization becomes mainstream.
By End-User: Industrial Base, Data-Center Upswing
Industrial and manufacturing sites represented 48.95% of demand in 2025, mirroring the sector’s reliance on uninterrupted production lines. Growth here tracks capital-spending cycles rather than regulatory triggers. Data centers, by contrast, are forecast to post an 11.57% CAGR through 2031, propelled by hyperscale buildouts focused on AI workloads and edge computing. Their stringent 99.999% uptime requirements reinforce multi-genset arrays that swell the North America generator sets market share of natural-gas and dual-fuel offerings.
Healthcare facilities remain a priority niche due to CMS mandates for 96-hour fuel reserves, spurring upgrades to larger or paralleled units. Utilities employ gensets for black-start and fast-reserve duties, roles that rise in importance as coal plants retire and renewable energy shares mount. In Mexico, diesel remains predominant for industrial users owing to gas-pipeline constraints, creating a regional divergence in fuel adoption trends across the broader North America generator sets market.
Geography Analysis
The United States generated 87.57% of North America's generator sets market revenue in 2025 and is expected to sustain a 4.32% CAGR through 2031, propelled by data-center clustering in Virginia, Texas grid-reliability concerns, and wildfire-related shutdowns in California. Texas alone added 12 GW of data-center load in 2024, each facility demanding multi-megawatt standby capacity. Pacific Gas & Electric carried out 47 public-safety power shutoffs affecting 1.2 million customers in 2024, intensifying residential and commercial adoption in Californian foothill communities. The Mid-Atlantic endured 9.1 outage hours per customer in 2024, the highest nationally, underpinning genset procurement across manufacturing corridors.
Canada contributes a smaller yet stable slice, underpinned by micro-grid pilots in Ontario and British Columbia that blend solar, wind, batteries, and dispatchable gensets. Ontario’s IESO opened a 50 MW distributed-generation call in 2025, inviting genset bids alongside storage and demand response. British Columbia Hydro is testing genset-battery hybrids in remote indigenous communities to cut diesel use by 40%. Alberta’s oil-sands operations remain a prime-power stronghold for natural-gas machines given abundant onsite fuel. Federal emissions regimes that parallel EPA Tier 4 standards further reshape fleet planning toward gas or dual-fuel options across Canadian provinces.
Mexico lags due to Comisión Federal de Electricidad’s centralized procurement and limited private-sector freedom to install distributed resources, though 2024 reforms permitted industrial self-supply arrangements that include standby gensets. Manufacturing nearshoring in Monterrey and Tijuana raises demand for reliable backup to protect conveyor and automation systems from grid flicker. Pemex pipeline constraints keep diesel dominant, differing from U.S. and Canadian gas-centric momentum. Currency volatility and import duties also weigh on adoption rates, but policy liberalization could unlock latent demand over the medium term.
Regulatory Landscape
In the United States, diesel generator set emissions compliance is anchored to U.S. EPA requirements for nonroad compression-ignition engines (Tier 4 Final) under 40 CFR Part 1039. This framework drives aftertreatment adoption (DPF/SCR/DEF) and affects fleet replacement decisions for standby and mobile configurations. For stationary engines, EPA updates in the Federal Register (effective August 30, 2024) added electronic reporting provisions for certain rules covering stationary reciprocating internal combustion engines, increasing the compliance and documentation burden for owners and service providers that operate and maintain fleets across multiple sites.
Across Canada, Environment and Climate Change Canada administers aligned requirements through the Off-road Compression-Ignition Engine Emission Regulations (SOR/2020-258), reinforcing similar emissions performance expectations for diesel platforms and keeping cross-border product strategies tightly coupled. Safety and certification requirements are also tightening via UL Solutions: the Third Edition of ANSI/CAN/UL/ULC 2200 takes effect in March 2026, adding functional safety requirements for hardware and software in stationary generator set controllers. That change is prompting OEMs and packagers to update control architectures and certification plans for the C-UL-US mark used across the United States and Canada.
Competitive Landscape
Caterpillar, Cummins, and Generac collectively hold the largest share of installed capacity, yet none exercises full pricing control across all segments. Caterpillar leverages a deep dealer network and integration with construction and mining equipment to lead the large-capacity range. Cummins benefits from vertically integrated engine manufacturing and launched a cloud monitoring suite in 2025 that supports utility virtual-power-plant participation. Generac dominates the residential and light-commercial niche via direct-to-dealer sales and consumer financing, which raises switching costs for homeowners.
Smaller challengers, AKSA Power Generation, HIMOINSA, and Atlas Copco, win rental contracts by promising short lead times and modular designs that reduce field assembly complexity. Time-to-delivery has become a key differentiator because semiconductor shortages add 8-12 weeks to production for digitally controlled units at established brands. GE Vernova’s 2025 entry into distributed generation underscores how large conglomerates view gensets as an extension of grid-services portfolios rather than standalone products.
Product roadmaps converge on dual-fuel capability, renewable-diesel certification, and control-software interoperability that enables micro-grid aggregation. Patent filings show Caterpillar focusing on hybrid controllers that optimize fuel use during extended outages, while Cummins emphasizes predictive maintenance analytics for fleet operators. Competitive intensity is therefore shifting from mechanical specifications toward digital functionality and emissions compliance in the North America generator sets market.
North America Generator Sets Industry Leaders
Caterpillar Inc.
Cummins Inc.
Generac Holdings Inc.
Kohler Co.
Briggs & Stratton Corp.
- *Disclaimer: Major Players sorted in no particular order

Market Opportunities and Future Outlook
Data center-driven procurement is creating a whitespace for large, standardized natural-gas and dual-fuel generator packages that can be deployed in modular blocks with integrated controls, switchgear compatibility, and serviceable aftertreatment strategies. In 2026, multiple multi-year and gigawatt-scale agreements highlighted this shift toward behind-the-meter power solutions for compute infrastructure, including Caterpillar aligned purchases for dedicated gas gensets for a hyperscale AI campus, and Cummins supply agreements for natural-gas generator sets supporting scalable microgrid configurations in Texas. These deals are pulling through demand for commissioning, paralleling controls, fuel conditioning, and long-term maintenance, not just engines and alternators.
A second opportunity area is emerging where grid constraints and resiliency programs intersect, with sub-5 MW assets increasingly configured for microgrid and hybrid-support use cases. As interconnection streamlining shapes how distributed resources connect and monetize, suppliers that can deliver UL 2200-compliant controller platforms (Third Edition effective March 2026) and validated operating modes for non-emergency use are in a better position for projects combining standby compliance with demand-response readiness. OEM capacity and fulfillment investments, such as Rolls-Royce opening a USD 24 million Logistics Operations Center in Minnesota in July 2026 to increase mtu Series 4000 genset throughput, also support faster delivery into mission-critical segments where lead times and parts availability influence supplier selection.
Recent Industry Developments
- July 2026: Generac signed a global supply agreement with an undisclosed hyperscale data center operator to provide backup generator infrastructure after completing a multi-stage qualification and audit process. The agreement reinforces Generac's positioning in large, multi-site data center procurement, where standardized platforms and service readiness shape vendor selection across multiple build phases.
- June 2026: Cummins announced an agreement to supply HSK78 and QSK60 natural gas generator sets for a scalable prime power microgrid supporting a high-performance computing data center in Texas, with deliveries scheduled from 2026 through 2030. The project highlights growing use of natural-gas gensets in behind-the-meter configurations that extend beyond emergency standby into continuous or extended-duty operation using microgrid controls.
- May 2026: Briggs and Stratton introduced the PowerProtect+ standby generator line, adding 18 kW, 22 kW, and 26 kW models with engineering upgrades. The launch refreshes the company's residential and light-commercial standby offering and supports replacement demand tied to outage-driven adoption and evolving expectations around installation, usability, and reliability.


Research Methodology Framework and Report Scope
Market Definition and Coverage
For this methodology, the market counts revenue generated from generator sets sold and installed across North America, covering equipment used for standby, prime, and temporary power needs across end users.
Scope exclusions: This sizing does not count routine fuel spend, standalone spare parts-only sales, or unrelated electrical balance-of-plant items that are not part of a genset package.
Segmentation Overview
- By Capacity
- Below 75 kVA
- 75 to 375 kVA
- 375 to 750 kVA
- 750 to 2,000 kVA
- Above 2,000 kVA
- By Fuel Type
- Diesel
- Natural Gas
- Dual-Fuel and Hybrid
- Renewable/Bio-fuel
- Others
- By Application
- Standby Power
- Prime/Continuous Power
- Peak-Shaving
- Rental/Temporary Power
- Micro-grid and Hybrid Support
- By End-User
- Residential
- Commercial Buildings
- Industrial and Manufacturing
- Data Centers
- Healthcare Facilities
- Oil and Gas
- Utilities and Power
- Mining and Construction
- By Geography
- United States
- Canada
- Mexico
Data Sources, Market Sizing, and Validation
Desk Research
Desk research was used to build the base structure of the model and to anchor it to real, observable activity across the United States, Canada, and Mexico. We reviewed public sources that point to demand drivers such as construction activity, industrial output, and outage exposure, and then translated those into generator set demand signals.
Sources reviewed include public and official references such as the US Energy Information Administration, the US Census Bureau construction data, Statistics Canada, Banco de Mexico and Mexico energy statistics, and standards and guidance from bodies such as NFPA (for backup power requirements in critical facilities). We also used company filings, investor presentations, and reputable industry press to map application mix and typical replacement cycles. Where required for cross-checking, we referenced paid subscriptions focused on company financials and intelligence, shipment and trade flows, and patent databases to understand technology direction and pricing movement. The desk sources listed here are illustrative, and many other public and paid references were also used to collect, validate, and clarify inputs.
Primary Interviews and Surveys
Primary work was used to confirm what the desk research could not explain cleanly, especially around current pricing, lead times, and how demand shifts between standby, prime, peak shaving, and rental use. We spoke with a mix of OEM-side participants, distributors and packagers, rental and service providers, and large end users such as data centers, healthcare facilities, construction groups, and industrial sites across North America.
Distribution of primary research fieldwork respondents
| Company type | Respondent position |
|---|---|
| Top tier: 32% | CXOs: 19% |
| Mid tier: 48% | Functional/Unit leaders: 26% |
| Smaller Players: 20% | Managers: 55% |
Market-Sizing & Forecasting
Sizing started with a top-down demand pool build based on power reliability exposure and activity indicators tied to genset use, and then allocated by fuel and application using patterns validated through interviews. In practice, the demand pool was shaped by variables such as grid outage frequency and duration, new commercial floor space and housing starts, data center capacity additions, industrial and oil and gas activity levels, and the share of projects choosing rental versus owned backup.
To keep totals realistic, we also ran selective bottom-up checks using sampled average selling prices by kVA band and estimated unit volumes implied by installation pipelines and channel feedback, and then reconciled those results to the top line. Where direct volume signals were thin, such as small temporary deployments and project-based orders, we handled the gaps by applying conservative utilization and replacement-cycle assumptions and then pressure-testing them with distributors and rental operators.
For forecasting, we used scenario analysis since the market is sensitive to outage conditions, construction cycles, and capex timing. Base, conservative, and higher-demand paths were built, and then the final forecast was selected after primary feedback on expected pricing progression, lead times, and the project pipeline by country.
Data Validation & Update Cycle
Model outputs were checked against independent signals, including country-level construction and industrial trends, import patterns for relevant equipment categories, and the implied run-rate from known end-use additions such as data center buildouts. When a segment showed an unusual jump, we re-checked the underlying drivers, and we revisited assumptions such as mix shift between diesel and gas and the rental share before final sign-off.
A second analyst review was done to confirm that country totals reconcile to the regional number and that growth rates align with the demand story. Reports are refreshed annually, with interim updates triggered by material events such as regulation changes, major grid reliability shifts, and sharp pricing movements. Before delivery, we do a final pass so the latest public releases and interview learnings are reflected.
Mordor Intelligence's North America Generator Sets Market Size Measured Against Other Published Estimates
Published market numbers for North America generator sets often differ because firms do not always count the same products, applications, or country coverage, and they may update price and mix assumptions at different times. The table helps show how even small scope choices can move the total when pricing varies a lot by kVA range and when rental demand is treated differently from equipment sales.
Key gaps usually come from whether temporary and rental power is counted as equipment revenue or blended into service-heavy figures, and from how fuel types and newer hybrid configurations are treated in the same bucket as conventional units. The timing of currency conversion and the refresh month for price lists and lead-time premiums also matter, especially when backlog clears unevenly by country.
Benchmark comparison
| Source | Market Size | Gaps in Research Methodology |
|---|---|---|
| Mordor Intelligence | USD 9.43 B (2026) | |
| Industry Association A | USD 8.72 B (2026) | Uses a narrower count focused on stationary standby installations, and it tends to exclude rental and temporary deployments that spike during construction and outage events. |
| Trade Journal B | USD 10.18 B (2026) | Applies broader scope by bundling packaged power solutions and some related electrical equipment into the same total, which pushes the number up versus a genset-only revenue view. |
The table shows a spread around the 2026 value, and in Mordor Intelligence's model, the total includes rental and temporary power equipment revenue alongside standby and prime sets, but it does not add unrelated balance-of-plant electrical hardware. With clear inclusions, practical demand inputs, and repeated cross-checks, the final number stays traceable to variables that can be revisited as new country data and interview feedback come in.


Key Questions Answered in the Report
How large is the North America generator sets market in 2026?
The market is projected to reach USD 11.56 billion by 2031, from USD 9.43 billion in 2026, growing at a 4.16% CAGR during 2026-2031.
Which capacity segment is growing fastest?
Units rated 375 to 750 kVA show the highest forecast growth at a 6.68% CAGR, driven by data-center edge deployments and hospital expansions.
Why are natural-gas gensets gaining share?
Tier 4 diesel compliance costs and corporate carbon targets favor natural-gas models, which are expanding at a 10.11% annual rate through 2031.
How is FERC Order 2023 influencing demand?
The order streamlines interconnection for sub-5 MW resources, enabling gensets in micro-grids to earn grid-service revenue and lifting hybrid-support adoption.
Which end-user industry will add the most new capacity?
Data centers are slated to grow genset demand at 11.57% per year as hyperscalers build new campuses and edge nodes across the region.
What is the main competitive differentiator among leading vendors?
Digital control suites that enable remote monitoring, predictive maintenance, and participation in virtual-power-plant programs are emerging as the key differentiator.
Page last updated on:


 Your data is secure and never sold or shared.


