
Market Overview
| Study Period | 2020 - 2031 |
|---|---|
| Forecast Data Period | 2026 - 2031 |
| Base Year Market Size (2025) | USD 73.88 Billion |
| Market Size (2026) | USD 80.67 Billion |
| Market Size (2031) | USD 120.86 Billion |
| Growth Rate (2026 - 2031) | 8.42% CAGR |
| Market Concentration | Medium |
Major Players *Disclaimer: Major Players sorted in no particular order Image © Mordor Intelligence. Reuse requires attribution under CC BY 4.0. | |
North America Gaming Market Analysis by Mordor Intelligence
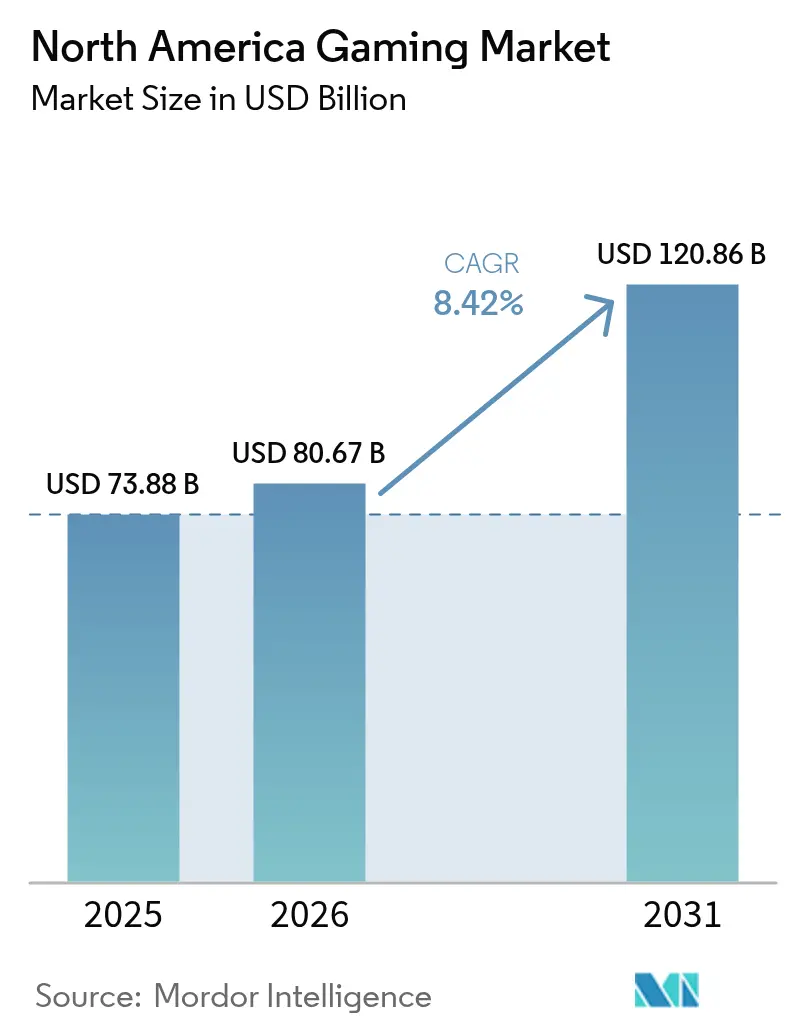
The North America gaming market size is projected to expand from USD 73.88 billion in 2025 and USD 80.67 billion in 2026 to USD 120.86 billion by 2031, registering a CAGR of 8.42% between 2026 to 2031. A structural pivot toward hybrid monetization that layer’s advertising and subscriptions on top of evergreen live operations now underpins revenue growth, while mobile platforms capture discretionary spending that hardware upgrade cycles no longer fully address. United States publishers continue to dominate absolute revenue, yet Mexico’s mobile-first audience is scaling faster, propelled by 85% smartphone penetration and cloud streaming that eliminates console barriers. Platform boundaries are eroding as studios rely on cross-engine workflows to ship simultaneous console, PC, mobile and cloud launches, compressing development cycles but intensifying competition for attention. Investor focus has therefore shifted from unit sales to lifetime value as artificial-intelligence targeting and predictive retention models lift margins even when hardware volumes soften.
Key Report Takeaways
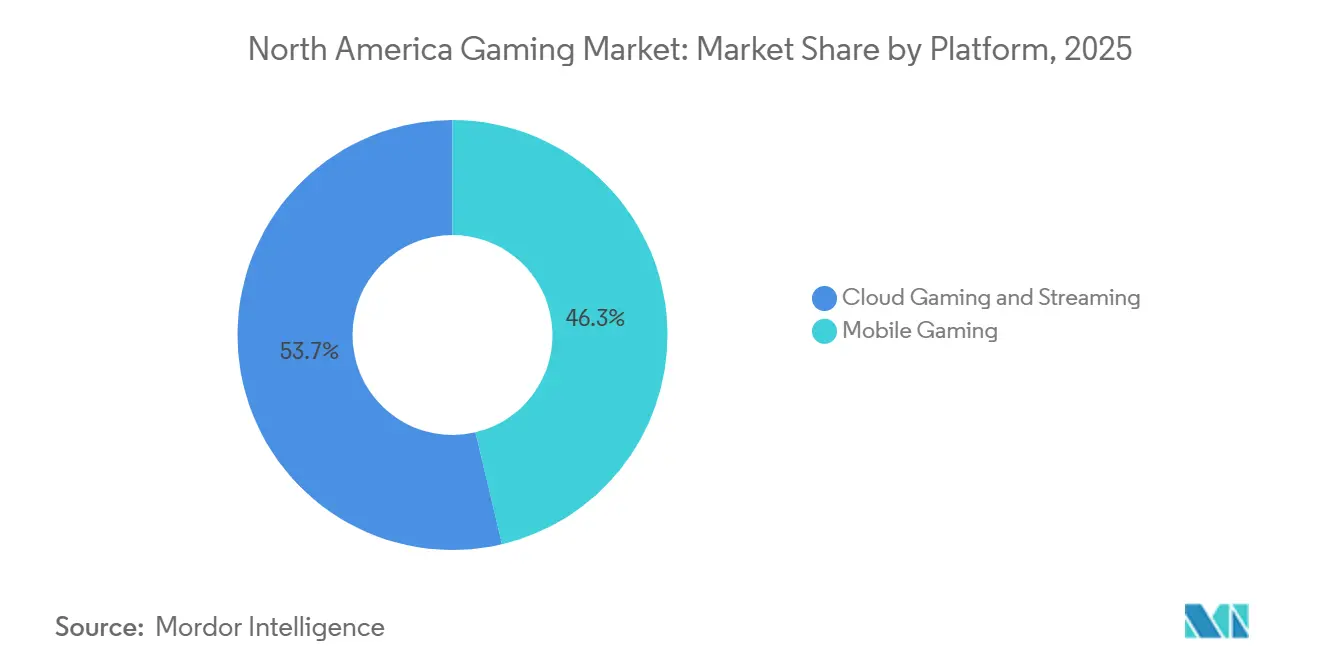
- By platform, mobile gaming led with 46.31% revenue share in 2025, while cloud gaming and streaming is advancing at an 8.91% CAGR through 2031.
- By revenue model, free-to-play and microtransaction formats accounted for 49.87% of 2025 revenue, whereas subscription services are forecast to grow at a 9.11% CAGR to 2031.
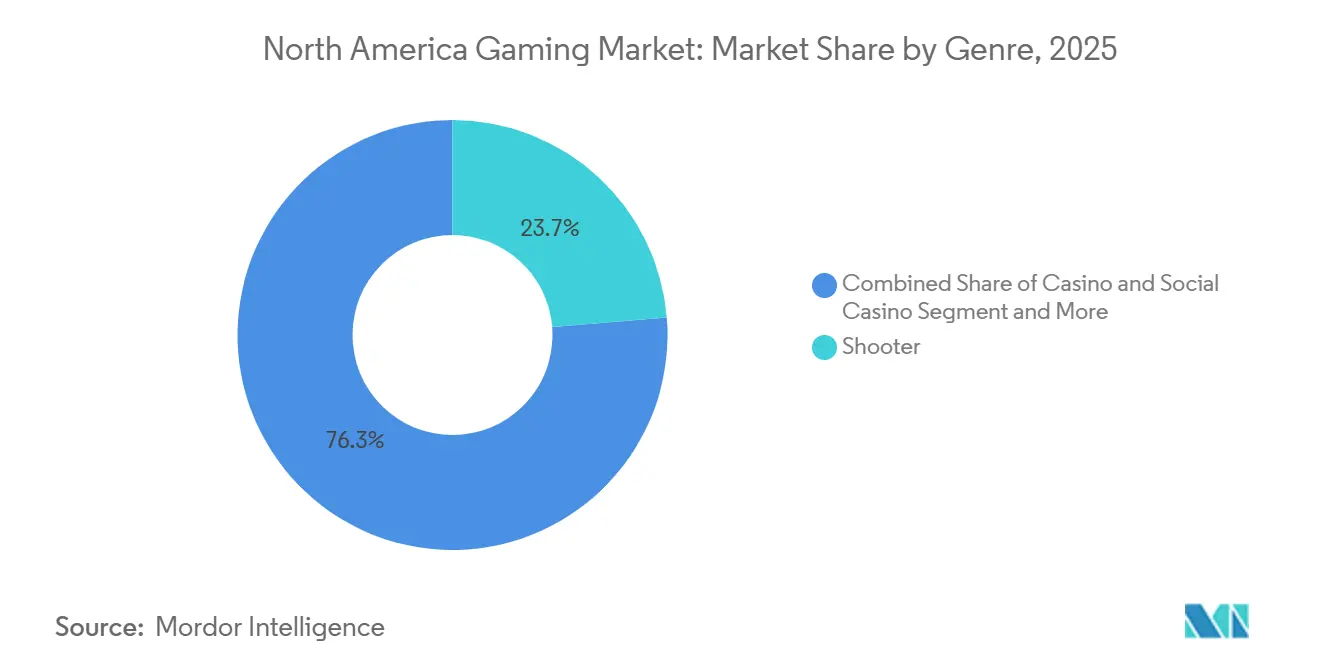
- By genre, shooter titles captured 23.71% share of the North America gaming market size in 2025, and casino and social casino games are projected to expand at an 8.77% CAGR between 2026-2031.
- By gamer type, casual gamers represented 41.26% of the mix in 2025 and social gamers are growing at an 8.79% CAGR to 2031.
- By geography, the United States commanded 82.42% North America gaming market share in 2025, while Mexico is forecast to post the fastest 9.23% CAGR through 2031.
Note: Market size and forecast figures in this report are generated using Mordor Intelligence’s proprietary estimation framework, updated with the latest available data and insights as of 2026.
North America Gaming Market Trends and Insights
Drivers Impact Analysis*
| Driver | (~) % Impact on CAGR Forecast | Geographic Relevance | Impact Timeline |
|---|---|---|---|
| Surge in Mobile-First Casual Gaming Spend | +1.80% | United States, Mexico, Canada | Medium term (2-4 years) |
| Subscription Services Gaining ARPU via Price-Tier Stacking | +1.50% | United States, Canada | Short term (≤ 2 years) |
| Cross-Platform Engine and Live-Ops Tool Adoption Lowering Development Cycles | +1.20% | United States, Canada | Medium term (2-4 years) |
| Esports Sponsorship Inflows and Media-Rights Escalation | +0.90% | United States, Canada | Long term (≥ 4 years) |
| Cloud/Edge Infrastructure Cuts Hardware Barriers for AAA Experiences | +0.80% | United States, Canada, Mexico | Long term (≥ 4 years) |
| AI-Driven User-Acquisition and Retention Modelling Boosts LTV | +0.70% | United States, Canada | Short term (≤ 2 years) |
| Source: Mordor Intelligence | |||
Surge in Mobile-First Casual Gaming Spend
Mobile platforms captured 46.31% of 2025 regional revenue, yet in-app purchase values on United States iOS devices fell 3.47% year-over-year, while advertising income jumped 26.7%, proving that reach now trumps microtransaction depth.[1]Sensor Tower, “Mobile Game Market Insights 2024-2025,” sensortower.com Mexico mirrors this pattern, with 78 million gamers delivering USD 2.2 billion in 2024 value at a 9.8% growth clip thanks to mobile usage exceeding 73% of players.[2]Deloitte, “Digital Media Trends: Gaming and Esports 2025,” www2.deloitte.com Publishers therefore treat lightweight titles as acquisition funnels, inserting rewarded video and subscription upsells that lifted the top 100 United States mobile games’ direct-to-consumer receipts 46% year-over-year.
Subscription Services Gaining ARPU via Price-Tier Stacking
Subscription revenue is tracking a 9.11% CAGR as operators add ad-supported starter tiers beneath premium plans. Xbox Game Pass surpassed 35 million users by mid-2025, and a July 2024 price hike showed no material churn, pushing average revenue per user higher.[3]Microsoft Corporation, “Fiscal Year 2025 Earnings Report,” microsoft.com Hybrid monetization now captures 61.7% of gaming spend because it simultaneously monetizes committed enthusiasts and price-sensitive casual players.[4]Bain and Company, “Gaming Industry Monetization Trends 2025,” bain.com North America’s disposable-income profile supports premium tiers, while ad-subsidized options extend reach into Mexico’s fast-growing mobile cohort.
Cross-Platform Engine and Live-Ops Tool Adoption Lowering Development Cycles
Multiplatform releases expanded 40% from 2021-2024 as Unity and Unreal abstracted hardware differences, letting small studios grow cross-platform output 71%. Cloud-based live-operations suites such as PlayFab push balance tweaks or seasonal events server-side, reducing patch lead times and fuelling rapid content iteration. The democratization of AAA tools enables niche creators to challenge incumbents, yet also compresses differentiation as photoreal assets and analytics become table stakes.
Esports Sponsorship Inflows and Media-Rights Escalation
Traditional sports deals are lifting valuation benchmarks: the National Basketball Association’s 11-year, USD 76 billion package, the National Hockey League’s USD 11 billion Canadian rights, and the National Football League’s USD 111 billion renewal anchor sponsor expectations. Casino and gaming backers already produced USD 387.6 million in measured social value across United States leagues. Esports franchises now negotiate multi-year agreements that transform leagues from marketing loss leaders into stand-alone profit nodes, provided viewership momentum sustains.
Restraints Impact Analysis*
| Restraint | (~) % Impact on CAGR Forecast | Geographic Relevance | Impact Timeline |
|---|---|---|---|
| Hardware Refresh Slump Post-COVID and Macro Headwinds | -1.20% | United States, Canada | Short term (≤ 2 years) |
| Rising Acquisition Costs and Ad-Signal Loss on Mobile | -0.90% | United States, Canada, Mexico | Medium term (2-4 years) |
| Regulatory Scrutiny on Loot-Boxes and Data Privacy | -0.60% | United States, Canada | Long term (≥ 4 years) |
| Talent Layoffs Eroding Institutional Knowledge and Delaying Releases | -0.50% | United States, Canada | Medium term (2-4 years) |
| Source: Mordor Intelligence | |||
Hardware Refresh Slump Post-COVID and Macro Headwinds
PlayStation 5 shipments fell 27.3% in 2024 to 15.8 million units, and Xbox hardware revenue slipped 29% in fiscal Q2 2025 as inflation tempered premium hardware demand. A lengthening console cycle caps the addressable audience for USD 70 titles, pressuring publishers to support legacy devices and cloud outlets, which in turn dilutes the visual leap that once justified new silicon.
Rising Acquisition Costs and Ad-Signal Loss on Mobile
Apple’s App Tracking Transparency and Google’s Privacy Sandbox curtailed third-party IDs, driving the top 1% of iOS winning bids for high-value gamers up roughly 140% in 2024. Incumbents with sizable first-party datasets can still train accurate look-alike models, but independent studios face margin squeeze as customer acquisition outpaces lifetime value. Consolidation accelerates as smaller teams join larger ecosystems to regain targeting efficiency.
*Our forecasts treat driver/restraint impacts as directional, not additive. The impact forecasts reflect baseline growth, mix effects, and variable interactions.
Segment Analysis
By Platform: Mobile Leads, Cloud Accelerates
Mobile retained 46.31% share of overall 2025 revenue, yet the North America gaming market size narrative is shifting as advertising replaced shrinking iOS in-app purchase spend, which dipped 3.47% year-over-year. Console performance softened alongside a 27.3% PlayStation 5-unit decline and a 29% Xbox hardware revenue drop, signalling install-base stagnation. Cloud gaming, projected to jump from USD 1.4 billion in 2025 to USD 18.3 billion by 2030, delivers AAA experiences without USD 500 consoles, helping Mexico’s fast-rising cohort and lifting regional growth.
Cross-platform engines let studios amortize assets across console, PC, mobile and cloud, but this convergence increases QA complexity and platform-holder revenue-share exposure. Multiplatform launches rose 40% between 2021-2024; small teams saw a 71% surge, proving that tooling democratization undercuts the moat once enjoyed by major publishers. The North America gaming market now rewards agile studios that optimize UI and balance for heterogeneous screens while leveraging first-party storefronts to escape 30% mobile tariffs.


By Revenue Model: Subscriptions Capture Wallet Share
Hybrid ecosystems blending subscriptions, ads and microtransactions now generate 61.7% of total spend, dwarfing one-off sales. The North America gaming market share for free-to-play and microtransactions sat at 49.87% in 2025, but subscriptions are the fastest component with a 9.11% CAGR outlook. Game Pass’s 35 million base validates multilevel pricing, while a 2024 fee hike confirmed pricing power.
High-spending whales still skew economics 0.02% of global installs created 20% of worldwide gaming revenue in 2025 yet ad-supported starter tiers broaden funnels before premium upsells. Direct-to-consumer storefronts grew 46% year-over-year as publishers chase higher takes versus platform fees. Over time, the North America gaming industry expects revenue to cluster around subscription bundles enriched by cosmetic microtransactions that stretch spending arcs well beyond launch month.
By Genre: Casino Mechanics Go Mainstream
Shooter franchises retained 23.71% 2025 share, buoyed by Call of Duty crossing USD 1 billion in its first month after the October 2024 Black Ops 6 launch. Casino and social casino titles, however, own the fastest 8.77% CAGR to 2031, with United States social casino revenue hitting USD 6.6 billion in 2024.
Sports games leverage traditional media rights, whose ballooning values spill into in-game sponsorship fees. Meanwhile, puzzle and casual apps embed gacha and loot-box loops, blending into casino dynamics and inviting heightened scrutiny. Regulatory momentum, led by Washington State’s 2025 age-verification law, could temper aggressive random-reward design.
By Gamer Type: Social Interaction Extends Lifecycles
Casual gamers formed 41.26% of the player mix in 2025, yet social gamers are expanding fastest at 8.79% CAGR thanks to sandbox universes such as Roblox, which logged 88.9 million daily actives and USD 919 million Q3 2024 revenue. Competitive and esports players, though a minority, deliver premium lifetime values through cosmetics and season passes that signal rank.
AI-based personalization engines adopted by 62% of studios tailor events and difficulty in real time, constraining churn. The North America gaming market size for community-driven platforms therefore grows disproportionately because network effects foster self-sustaining engagement as user-generated content refreshes catalogues without heavy publisher capex.
Geography Analysis
The United States contributed 82.42% of 2025 revenue, supported by entrenched console ecosystems and subscription penetration topping 35 million Game Pass accounts. Yet iOS in-app purchase volumes slipped 3.47% year-over-year while ad receipts grew 26.7%, compelling publishers to pivot toward hybrid monetization. Added pressure stems from state-by-state regulation such as Washington’s 2025 loot-box age checks, which fragment compliance regimes.
Canada mirrors United States behaviour but at smaller scale; its USD 11 billion, 12-year National Hockey League rights agreement elevates sponsorship pricing in sports and esports tie-ins. Cloud streaming uptake is notable because broadband penetration outpaces console replacement, enabling AAA play on mid-tier PCs and tablets.
Mexico represents the high-growth outlier with a 9.23% CAGR forecast as 85% smartphone penetration and 78 million gamers fuel a USD 2.2 billion 2024 base. Cloud services bypass USD 500 console barriers, and publishers localize content plus alt-cash payments to capture this mobile-first audience. Over the horizon, rising Mexican spend will slowly dilute United States dominance, though per-capita outlays remain wider north of the border.
Regulatory Landscape
Regulation affecting North America gaming spans content, privacy, and monetization rules for video games, alongside a licensing-driven regime for real-money online gaming. In the United States, video game oversight continues to rely heavily on self-regulation through industry-led content ratings and platform policies, while heightened attention to children and teen protections raises compliance requirements for data handling and age-gating. Within the region, Washington State's 2025 loot-box age verification law shows how state-by-state approaches can fragment compliance for publishers running live-ops and randomized-reward mechanics at scale.
Canada has continued to refine provincial internet-gaming frameworks, including Ontario's updates to its Registrar's Standards for Internet Gaming and a tighter focus on advertising and responsible gaming controls such as self-exclusion. Ad Standards began accepting complaints under the Canadian Code for Advertising of Gambling on January 1, 2026, and Alberta launched a regulated competitive iGaming market in July 2026 with its own Standards and Requirements for Internet Gaming handbook. For large platforms and publishers that also operate cloud and subscription ecosystems, cross-border policy signals matter as well, including the UK Competition and Markets Authority acceptance of nonbinding commitments from Amazon Web Services and Microsoft on March 31, 2026, related to cloud interoperability and data egress. These practices can influence the economics of game streaming and live-service backend operations used by North America-focused studios.
Value Chain Analysis
The North America gaming value chain begins with IP creation and game development (internal studios and external co-development), followed by engine and tool providers such as cross-platform engines, analytics, and live-ops stacks. Publishing and user acquisition come next through store merchandising, performance marketing, and influencer or esports activations, with distribution then split across console and PC storefronts, mobile app stores, and cloud streaming platforms. Monetization is increasingly carried through live operations that combine microtransactions, subscriptions, and advertising, which keeps content production, economy balancing, and data science workflows in play to protect retention and lifetime value.
Downstream, platform holders and storefront operators shape reach, take rates, and compliance requirements. Payment processing and customer support layers also become more complex in mobile-first and cross-border contexts such as Mexico. Industry associations help coordinate standards and policy engagement across the chain: the Entertainment Software Association (ESA) represents major publishers and platform holders on public policy; the American Gaming Association (AGA) and Indian Gaming Association (IGA) engage regulators on legal gaming and consumer protection topics; and the Association of Gaming Equipment Manufacturers (AGEM) represents technology providers and systems integrators supporting broader gaming ecosystems. As toolchains and distribution consolidate, publishers with first-party data and owned platforms can integrate marketing, identity, and live-ops more tightly than smaller studios that rely on third-party signals.
Competitive Landscape
The top 10 publishers control roughly 60-70% of console and PC receipts, yielding a moderately concentrated field where scale in first-party data and intellectual property confers edge. Microsoft’s USD 68.7 billion Activision Blizzard purchase in 2023 folded Call of Duty, World of Warcraft and Candy Crush into a unified Game Pass funnel that exploits Azure cloud reach. Sony counters with PlayStation Plus catalogue depth but faces hardware softness that constrains exclusive sales leverage.
Mobile remains fragmented, yet escalating user-acquisition costs push independents toward partnerships or acquisition. AI adoption, now present in 62% of studios, is the tactical differentiator: deeper data lakes enable superior churn models, widening the retention gap versus smaller peers.
User-generated ecosystems such as Roblox and Fortnite Creative divert both developer talent and audience time, encouraging incumbents to launch creator tooling and revenue splits to keep players inside proprietary worlds. White-space still exists in narrative-driven indies and social simulation niches, especially for localized Spanish content targeting Mexico’s accelerating base.
North America Gaming Industry Leaders
Activision Blizzard, Inc.
Electronic Arts Inc.
Microsoft Corporation
Sony Interactive Entertainment LLC
Nintendo Co., Ltd.
- *Disclaimer: Major Players sorted in no particular order


Market Opportunities and Future Outlook
Hybrid monetization creates whitespace for publishers and ad-tech partners to convert large audiences into durable revenue without depending only on in-app purchase depth. That shift is already visible in the region as advertising has grown faster than iOS in-app purchase spend. It also raises the practical value of live-ops capabilities such as segmentation, rewarded video placement, and subscription tiering, while increasing demand for privacy-aware measurement as ad-signal loss lifts acquisition costs. With mobile accounting for 46.31% of 2025 revenue and Mexico supported by 85% smartphone penetration and a large gamer base, localized content and payments (including alternative cash methods) remain workable routes for regional expansion, alongside lighter-weight experiences built to act as acquisition funnels.
Regulated online gaming growth in Canada also opens adjacent opportunities for gaming-content suppliers and platform operators that can run compliant marketing and responsible gaming tooling. Alberta's July 13, 2026 launch of a competitive iGaming market with 22 private operators, together with the January 1, 2026 effective date of a voluntary national Code for Responsible Gaming Advertising, provides a commercialization pathway for content studios, data providers, and compliance-focused ad operations that can adjust creatives and targeting to provincial requirements. At the same time, cloud and cross-platform play widen addressability for premium experiences while console refresh softness persists, supporting investments in cloud-native live-service backends and engine workflows that ship across console, PC, mobile, and cloud. Ongoing policy and interoperability attention around hyperscale cloud services further increases the strategic value of portable server stacks and vendor-agnostic telemetry for studios operating always-on games.
Recent Industry Developments
- July 2026: The Coalition and Microsoft announced a partnership with NVIDIA to integrate GeForce RTX technologies into Gears of War: E-Day, launching October 6, 2026. The collaboration enhances visual fidelity and performance across PC and console platforms as GeForce RTX technology is embedded into the game.
- July 2026: Microsoft integrated Mojang and King directly into the Xbox organization to streamline operations. The consolidation strengthens portfolio governance and speeds decision making across core franchises.
- July 2026: Sony initiated worldwide pre-registration for Ratchet & Clank: Ranger Rumble. The move expands Sony's mobile footprint and tests cross platform appeal in a new category.


Research Methodology Framework and Report Scope
Market Definition and Coverage
In this methodology, the North America gaming market is defined as consumer and advertising revenues generated from video games across console, PC, mobile, and cloud or streaming in the United States, Canada, and Mexico.
Scope exclusions: We exclude adjacent entertainment revenue that is not directly tied to video game play or monetization, such as movie streaming, music, and non-gaming toys and merchandise.
Segmentation Overview
- By Platform
- Console Gaming
- PC Gaming
- Mobile Gaming
- Cloud Gaming and Streaming
- By Revenue Model
- Premium (Full-Priced)
- Free-to-Play/Micro-transactions
- Subscription Services
- Advertising and In-Game Purchases
- By Genre
- Shooter
- Sports
- Role-Playing/Adventure
- Strategy
- Puzzle and Casual
- Casino and Social Casino
- By Gamer Type
- Casual Gamers
- Competitive/Esports Gamers
- Hardcore/Core Gamers
- Social Gamers
- By Country
- United States
- Canada
- Mexico
Data Sources, Market Sizing, and Validation
Desk Research
Desk work started with building the demand context for gaming spend and access, before numbers were pushed into the model. We referred to public releases and datasets such as ESA consumer spending updates, the US Bureau of Economic Analysis for consumer spending signals, the US Census Bureau and Statistics Canada for household and population baselines, and ITU indicators for connectivity trends that shape play time and streaming feasibility.
On the supply and market-structure side, we used company filings, investor presentations, and earnings call notes to understand revenue mix shifts by platform and monetization types, then mapped those back to North America coverage. We also checked broad trade and device shipment indicators through public customs statistics and press releases, and we used a paid subscription focused on company financials and news to speed up cross-checking historic series and major event timelines. This list is illustrative, and other public sources were used for data collection, validation, and clarification as well.
Primary Interviews and Surveys
Primary discussions were run with a mix of publishers, platform ecosystem participants, payments and monetization specialists, esports and community operators, and distribution and marketing experts, so the full value-chain view could be checked. We also spoke with demand-side stakeholders who track player behavior and spend, then used those inputs to confirm platform mix, revenue model splits, and realistic price and take-rate assumptions across the United States, Canada, and Mexico.
Distribution of primary research fieldwork respondents
| Company type | Respondent position | Region |
|---|---|---|
| Top tier: 35% | CXOs: 19% | |
| Mid tier: 45% | Functional/Unit leaders: 40% | |
| Smaller Players: 20% | Managers: 41% |
Market-Sizing & Forecasting
Sizing was built using a top-down demand pool reconstruction, where consumer spending on games is translated into platform-level revenue using penetration, usage intensity, and monetization patterns by country. To keep the totals realistic, we then corroborated them with selective bottom-up checks such as sampled publisher and platform revenue disclosures, channel checks on subscription pricing and uptake, and an ASP times volume sanity pass for hardware-linked spend.
The practical inputs that mattered most were smartphone and broadband penetration (linked to mobile and cloud play), console and PC installed base direction, subscription adoption and churn expectations, average payer rate for free-to-play, and the shift in spend between full game sales and in-game purchases. For forecasting, scenario analysis was used, anchored on how these variables typically move in expansion and slowdown cycles, then aligned with expert consensus from primary calls, especially on subscription growth and ad-supported monetization. Where disclosure gaps existed, we used conservative ranges for smaller publishers and newer cloud offers, and narrowed the ranges after follow-up validation with industry participants.
Data Validation & Update Cycle
Outputs were checked through triangulation across independent signals, including consumer spending headlines, platform mix shares, and public revenue trends from companies with meaningful exposure to the region. When variances appeared, we revisited the assumptions, and unusual jumps were traced back to factors such as new hardware cycles, content release timing, or one-time pricing changes, before the model was finalized.
Each report is refreshed annually, and interim updates are made if a material event changes the market direction, such as a major policy shift, a large platform change, or a sharp macro swing. Before delivery, one more pass is done to confirm the latest public updates are reflected, and re-contacts are triggered if a key metric moves outside the expected range.
Mordor Intelligence's North America Gaming Market Size Compared With Other Published Estimates
Published estimates for the North America gaming market often do not line up because the underlying scope boundaries are not the same, even when the headline title looks identical. Differences typically come from what is counted as gaming revenue, which countries are included under North America, and how subscription and in-game purchase revenue is recognized over time.
The table shows a noticeable spread versus other numbers, and in Mordor Intelligence's model, the value is kept tied to video game revenues across console, PC, mobile, and cloud or streaming, then split by revenue model rather than blending in broader digital media or unrelated entertainment spend. A second driver is update timing, where currency conversion points and the latest consumer spending releases can shift the current-year value even when the long-term trend stays similar.
Benchmark comparison
| Source | Market Size | Gaps in Research Methodology |
|---|---|---|
| Mordor Intelligence | USD 73.88 B (2025) | |
| Regional Consultancy A | USD 61.06 B (2024) | Uses a different base year and appears to treat the market closer to core gaming revenue, which can undercount advertising-led and subscription-led monetization if it is not fully captured across platforms. |
| Industry Association B | USD 60.70 B (2025) | Represents US-only consumer spending and bundles hardware and accessories with content, so it is not a full North America total and is not directly comparable to a revenue-based regional market build. |
Taken together, the comparison points to two repeatable gap drivers, which are geography coverage and what revenue lines are included under gaming. By keeping the scope explicit and by tying inputs to observable signals like platform mix and monetization behavior, our estimate stays traceable to clear steps that can be reviewed and updated as new data comes out.


Key Questions Answered in the Report
What drives revenue growth across North America gaming?
Hybrid monetization that layers subscriptions and advertising on top of live-operations lifts lifetime value while mobile and cloud access keep new players joining.
Which platform is growing fastest?
Cloud gaming and streaming posts the highest 8.91% projected CAGR to 2031 because edge computing reduces latency and removes console cost barriers.
How large is Mexico's role in regional expansion?
Mexico is forecast to deliver a 9.23% CAGR through 2031, the strongest in the region, as 85% smartphone penetration and cloud streaming open AAA experiences to mobile-first players.
Why are subscription programs critical for publishers?
Services such as Game Pass surpassed 35 million users and survived 2024 price increases, proving that tiered subscriptions raise average revenue per user without sparking mass churn.
What regulatory issues are most pressing now?
Loot-box transparency and mandatory age verification, led by Washington State legislation and a Federal Trade Commission inquiry, are reshaping compliance for monetization design.
How does artificial intelligence influence competitive advantage?
Sixty-two percent of studios already apply AI for predictive churn modeling and personalized content, letting data-rich publishers cut acquisition costs and stretch player lifecycles.
Page last updated on:






