
Market Overview
| Study Period | 2020 - 2031 |
|---|---|
| Forecast Data Period | 2026 - 2031 |
| Base Year Market Size (2025) | USD 26.24 Billion |
| Market Size (2026) | USD 26.69 Billion |
| Market Size (2031) | USD 30.37 Billion |
| Growth Rate (2026 - 2031) | 2.62 % |
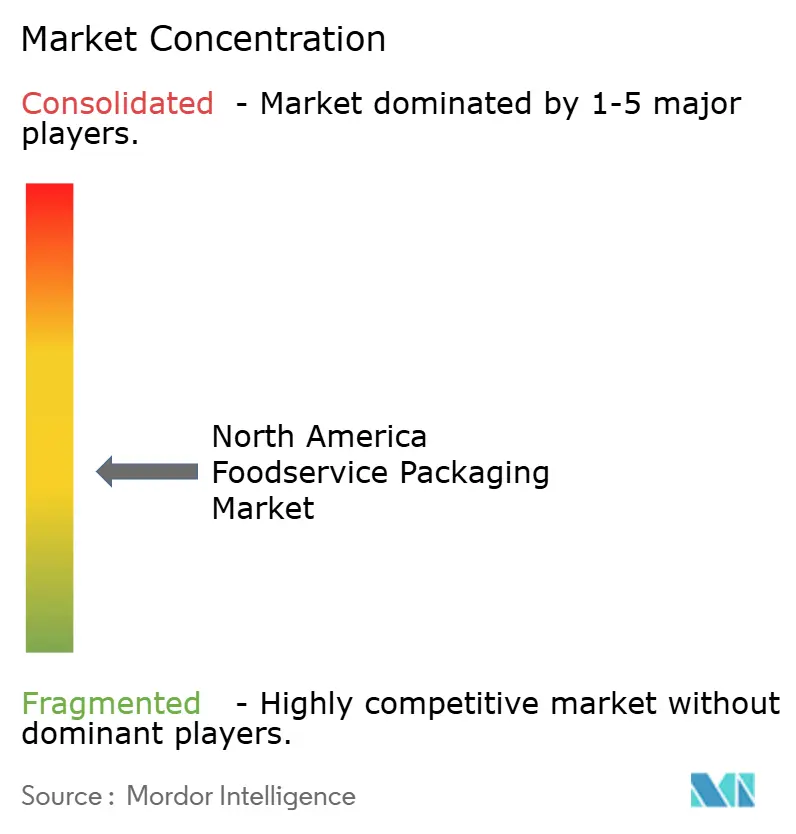
| Market Concentration | Low |
Major Players *Disclaimer: Major Players sorted in no particular order Image © Mordor Intelligence. Reuse requires attribution under CC BY 4.0. | |
North America Foodservice Packaging Market Analysis by Mordor Intelligence
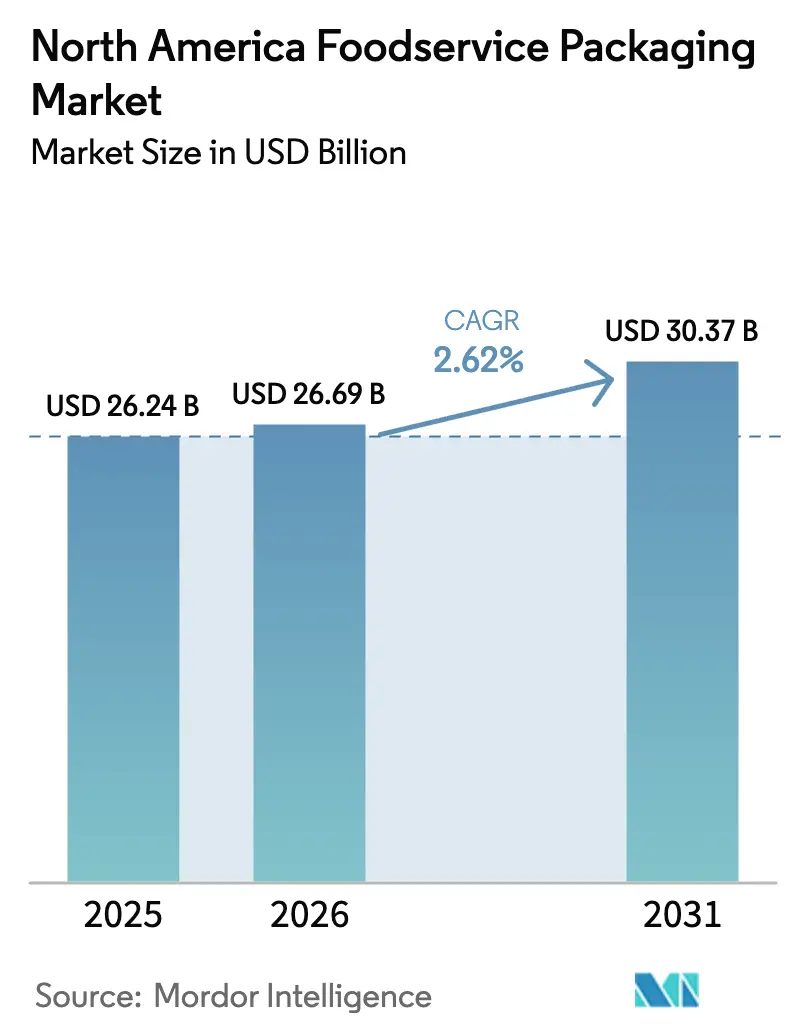
The North America foodservice packaging market size is projected to expand from USD 26.24 billion in 2025 and USD 26.69 billion in 2026 to USD 30.37 billion by 2031, registering a CAGR of 2.62% between 2026 to 2031. A steady headline figure conceals the pivot toward fiber, recycled polymers, and smart labels as ghost kitchens, state-level PFAS bans, and corporate net-zero mandates reshape converter priorities. United States quick-service chains are setting recycled-content thresholds that ripple through resin demand, while California’s SB 54 is forcing multimaterial phase-outs ahead of 2032. Multinational food retailers now evaluate suppliers on Scope 3 metrics and time-temperature tracking, prompting capital flows into molded-fiber lines and digital label platforms. The net effect is a supply chain that is becoming shorter, more regional and more circular, even as it manages volatile polyethylene and polypropylene feedstock costs that spiked 20% through mid-2025.
Key Report Takeaways
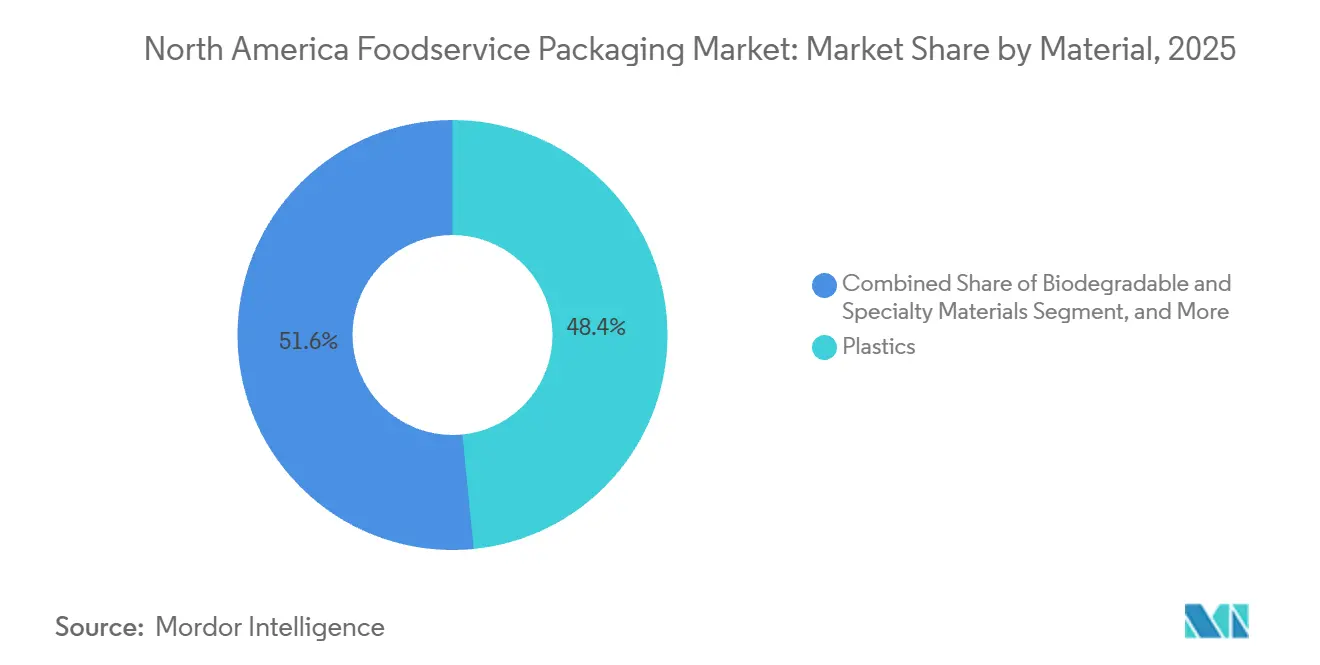
- By material, plastics led with 48.42% of the North America foodservice packaging market share in 2025, while biodegradable and specialty materials are forecast to grow at a 4.32% CAGR through 2031.
- By packaging type, cups and tubs commanded 39.89% revenue share in 2025, whereas trays and containers are projected to expand at a 3.46% CAGR to 2031.
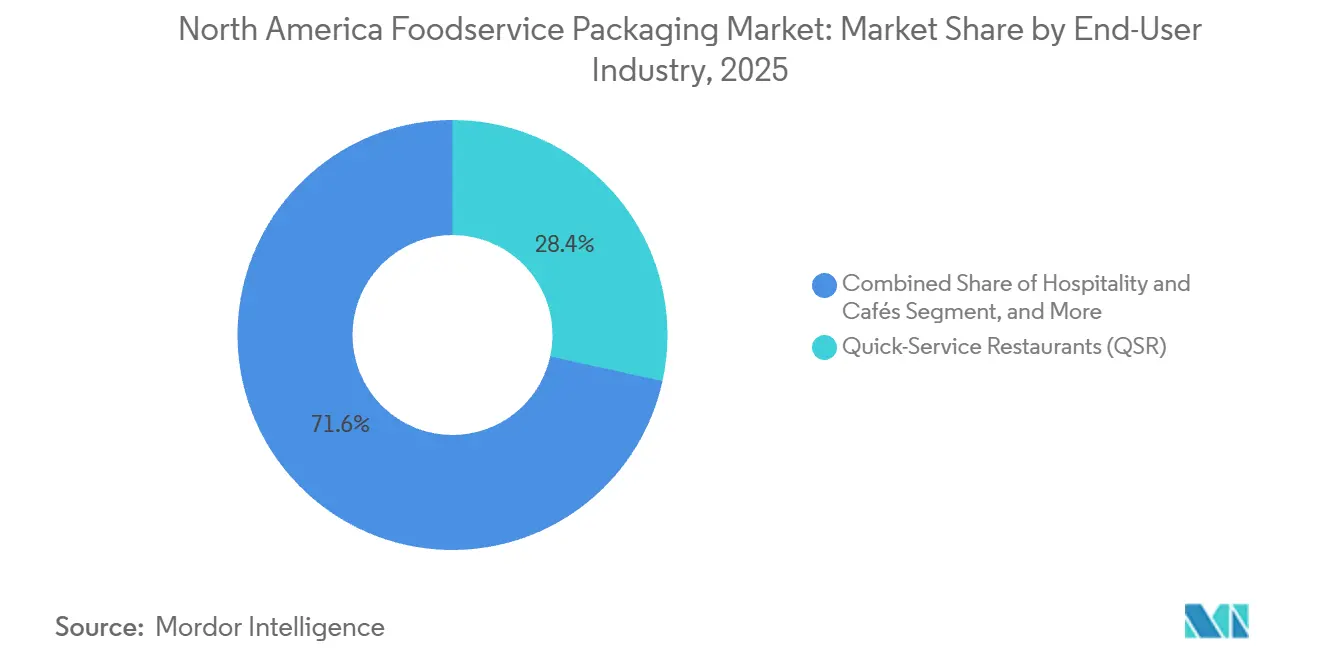
- By end-user, quick-service restaurants held 28.44% of the North America foodservice packaging market share in 2025, yet hospitality and cafés will post the fastest 3.74% CAGR between 2026 and 2031.
- By sustainability profile, conventional formats retained 68.86% share of the North America foodservice packaging market size in 2025, but sustainable alternatives will grow at a 3.61% CAGR through 2031.
- The United States accounted for 72.63% of 2025 revenue, while Mexico is set to log the highest 4.01% CAGR to 2031.
Note: Market size and forecast figures in this report are generated using Mordor Intelligence’s proprietary estimation framework, updated with the latest available data and insights as of January 2026.
Market Trends and Insights
Drivers Impact Analysis of North America Foodservice Packaging Market*
| Driver | (~) % Impact on CAGR Forecast | Geographic Relevance | Impact Timeline |
|---|---|---|---|
| Demand for Convenience and On-the-Go Meals | +0.8% | United States and Canada, spillover to Mexico urban centers | Short term (≤ 2 years) |
| Rapid Expansion of Food-Delivery and Ghost-Kitchen Models | +0.7% | United States metro areas, Toronto, Vancouver, Mexico City | Medium term (2-4 years) |
| Corporate Net-Zero Mandates Driving Sustainable Packaging Procurement | +0.5% | United States and Canada, early adoption in Mexico by multinationals | Long term (≥ 4 years) |
| Emphasis on Recyclable and Post-Consumer Materials | +0.4% | United States and Canada, limited near-term impact in Mexico | Medium term (2-4 years) |
| Integration of Smart, Connected Packaging for Waste-Tracking | +0.3% | United States and Canada pilot programs, minimal Mexico penetration | Long term (≥ 4 years) |
| Government Incentives for Domestic Compostable Packaging Capacity | +0.2% | United States West Coast, British Columbia | Long term (≥ 4 years) |
| Source: Mordor Intelligence | |||
Demand for Convenience and On-the-Go Meals
Food-away-from-home spending climbed to 55% of total United States food expenditures in 2025, underlining a structural move toward portable meal formats.[1] Single-serve clamshells and dual-ovenable paperboard trays now dominate breakfast sandwich and entrée offerings because they let commuters reheat food without re-plating.[2] Quick-service chains report that menu simplification lowered fulfillment labor by 12% to 15% and raised average order speed, reinforcing the pull for standardized footprints. Converters, in turn, are scaling up water-based barriers that comply with updated migration rules, reducing dependence on fluorochemicals. The convenience theme also dovetails with ghost-kitchen playbooks where SKU discipline and lightweight packaging lower delivery fees, sustaining volume even when food inflation pressures discretionary spending.
Rapid Expansion of Food-Delivery and Ghost-Kitchen Models
More than two-thirds of DoorDash North America orders in 2025 traveled more than 4 miles, so converters redesigned lids and seals to withstand 30-minute trips without leakage. Ghost kitchens already represent 15% of United States commercial foodservice orders, with penetration rising fastest in secondary metros where rents favor commissary hubs.[3] Delivery-optimized trays made from mono-PP or molded fiber now earn price premiums because they reduce contamination at material recovery facilities. Graphic Packaging recorded a 22% year-over-year jump in tray shipments linked to virtual-brand contracts, confirming that durability and stackability trump dine-in aesthetics. Municipal recycling rules amplify the trend, since single-material walls flow more easily into existing streams, supporting circular-economy scorecards for brand owners.
Corporate Net-Zero Mandates Driving Sustainable Packaging Procurement
Packaging now accounts for 8% of Starbucks’ global greenhouse gas inventory, prompting the chain to mandate 30% recycled content in cups and lids by 2027. McDonald’s has already met its 2025 goal of sourcing guest packaging entirely from renewable, recycled, or certified inputs in the United States and Canada. These brand mandates cascade through tier-two converters, pushing investment into advanced mechanical and chemical recycling that yields food-grade rPET pellets. The Ellen MacArthur Foundation reports that 65% of regional signatories hit 2025 recycled-content goals, yet only 40% achieved reusability targets, showing that infrastructure gaps still hamper circular ambitions. Nonetheless, chain-of-custody certifications such as Forest Stewardship Council are now procurement prerequisites, tilting the share toward vertically integrated suppliers.
Emphasis on Recyclable and Post-Consumer Materials
California’s SB 54 requires 30% recycled content in PET single-use items by 2028, spurring a USD 150 million Amcor investment in molecular recycling assets capable of handling multilayer waste streams. Berry Global reports a 15% price premium for rPET clamshells but still sees robust foodservice uptake because procurement scorecards weigh recycled content at 30%. Feedstock scarcity remains the pinch point, with PET collection rates stuck at 28% in 2025. Converters are responding by signing long-term bale supply contracts and co-investing with material recovery facilities. The regulatory push is slowly narrowing cost gaps, so post-consumer materials are expected to command more than one-quarter of the North America foodservice packaging market by 2031.
Restraints Impact Analysis of North America Foodservice Packaging Market*
| Restraint | (~) % Impact on CAGR Forecast | Geographic Relevance | Impact Timeline |
|---|---|---|---|
| Stringent Single-Use Plastic Regulations and Bans | -0.6% | United States West and Northeast, federal Canada | Short term (≤ 2 years) |
| Volatility in Polymer and Pulp Input Prices | -0.5% | United States, Canada, import-dependent Mexico | Short term (≤ 2 years) |
| Limited Industrial Composting Infrastructure | -0.3% | United States and Canada, minimal Mexico infrastructure | Medium term (2-4 years) |
| Supplier Consolidation Triggering Contract Renegotiation Risk | -0.2% | United States and Canada | Short term (≤ 2 years) |
| Operational Challenges from State-Level PFAS Restrictions | -0.4% | Twelve United States states with enacted or pending legislation | Medium term (2-4 years) |
| Source: Mordor Intelligence | |||
Stringent Single-Use Plastic Regulations and Bans
California, Colorado, Maine, Vermont, and Washington already restrict polystyrene or require source reduction, while Canada’s federal ban took effect in 2023. The overlapping timelines force converters to manage multiple SKUs and create inventory write-down risks; Dart Container booked a USD 42 million impairment on legacy polystyrene tooling in 2024. Compliance costs are asymmetric; vertically integrated suppliers absorb testing and reformulation more easily than regional firms that rely on third-party compounders. Retailers are accelerating phase-outs ahead of statutory deadlines to avoid consumer backlash. As a result, molded-fiber, mono-PET, and coated paperboard alternatives are gaining accelerated certifications, shrinking the addressable volume for traditional foam cups.
Volatility in Polymer and Pulp Input Prices
United States polyethylene spot prices ranged from USD 0.52 to USD 0.71 per pound in 2025, mirroring Gulf Coast cracker outages and global naphtha volatility. Parallel pulp spikes saw northern bleached softwood kraft touch USD 1,450 per metric ton, pressuring coated-paperboard margins. Pactiv Evergreen hedged 60% of its resin purchases, yet still reported a 180-basis-point erosion in gross margin. Smaller converters without forward contracts delayed capital outlays for recycled-content extrusion lines, slowing the rollout of sustainable SKUs. The volatility curbs lenders' risk appetite, making supply chain finance a new battleground for market share.
*Our forecasts treat driver/restraint impacts as directional, not additive. The impact forecasts reflect baseline growth, mix effects, and variable interactions.
North America Foodservice Packaging Market Segment Analysis
By Material:
Fiber Advances as Polymer Scrutiny RisesFiber, biodegradable resin and specialty substrate suppliers are converting regulatory headwinds into share gains. Biodegradable materials are set to register a 4.32% CAGR through 2031 as operators search for SB 54-compliant alternatives. Plastics still account for 48.42% of 2025 revenue, but California and Canada bans have already trimmed polystyrene volumes. Graphic Packaging’s molded-fiber clamshell wins in quick-service salad channels demonstrate how improved grease resistance and stiffness close historical performance gaps. Meanwhile, aluminum and glass stay niche in premium beverage formats because weight, cost and curbside sortation challenges offset their infinitely recyclable value proposition.
NatureWorks’ USD 600 million Nebraska PLA expansion will double capacity by 2027 and raise heat performance to 110 °C, unlocking hot-fill foodservice opportunities. Danimer Scientific secured FDA approval for Nodax PHA grease-barrier coatings, opening new avenues for fiber trays that bypass PFAS fluorochemicals. Still, the North America foodservice packaging market size for certified compostables hinges on end-of-life access; only 185 industrial composters accept foodservice ware in the United States. Operators outside the West Coast often default to landfill, diluting environmental claims. Until curbside organics pickup expands, converters are positioning compostables for coastal metros while pushing rPET and rPP upgrades elsewhere.

By Packaging Type:
Delivery Needs Accelerate Tray and Container DemandCups and tubs captured 39.89% of the market share in 2025, buoyed by coffee and frozen-dessert chains. Yet the delivery boom is steering incremental growth toward trays and containers, which are expected to outpace the overall North America foodservice packaging market at a 3.46% CAGR through 2031. Inline Plastics’ tamper-evident clamshells meet FDA traceability mandates and now anchor meal-kit SKUs. Sachets and pouches gain in condiment and sauce applications because lighter packages lower freight emissions and unit cost.
Pactiv Evergreen’s EarthChoice dual-ovenable paperboard tray withstands 425 °F for 20 minutes, letting consumers reheat meals without secondary dishes and cutting per-order packaging weight 18% at Chipotle. Sabert’s sugarcane-bagasse Pulp-it line meets ASTM D6868 and rivals polystyrene on insulating performance, winning chain accounts in legislation-heavy states. California’s SB 1335 requirement that public institutions use compostable or recyclable formats by 2028 further tilts the mix to mono-fiber and mono-PP tray designs.
By End-User Industry:
Hospitality and Cafés Lead GrowthQuick-service restaurants maintained a 28.44% share in 2025 thanks to their extensive store networks, but incremental momentum is shifting toward hospitality, cafés, and airport concessions, which will log a 3.74% CAGR through 2031. Full-service restaurants are adding off-premise channels, sending plated entrées into clamshells engineered to hold sauces and garnishes intact for 30-minute drives. Institutional catering pivots to single-use trays amid chronic labor shortages in dishwashing, though K-12 sustainable procurement dampens conventional plastic volumes.
Marriott reports that 92% of its North America properties swapped buffet chafers for individually wrapped breakfast items in 2025, boosting unit demand for compostable wraps and lids. Hilton’s contract with Eco-Products standardized compostable cups and cutlery across 1,200 hotels, signaling readiness to absorb an 8% price premium for certified materials. Starbucks’ Seattle reusable-cup pilot achieved a 45% return rate, yet high reverse-logistics costs limit national rollout, keeping single-use cups core to volume over the forecast period.
By Sustainability Profile:
Conventional Formats Persist as Transitional BaselineConventional packaging retained 68.86% share of the 2025 North America foodservice packaging market size, anchored by virgin-plastic clamshells and polystyrene foam cups that meet low-price thresholds. However, sustainable alternatives are on a steeper 3.61% CAGR trajectory, supported by corporate ESG scorecards and state bans. McDonald’s fulfillment of its 2025 renewable or recycled mandate shows that scale chains can absorb higher material costs when reputational risk is on the line.
California SB 54 and Colorado HB 22-1162 will effectively eliminate unrecyclable polystyrene by 2032, creating stranded assets for lagging converters. The Foodservice Packaging Institute notes that only 38% of municipalities accept fiber clamshells curbside, constraining true circularity. As material recovery facilities retrofit sort lines and chemical recyclers scale, sustainable share is poised to approach one third of market revenue by the end of the decade, but conventional formats will still dominate price-sensitive QSR combo meals in the interior United States.
Geography Analysis
United States Foodservice Packaging Market
The United States generated 72.63% of the North America foodservice packaging market in 2025, driven by the world’s largest quick-service store base and early delivery-aggregator adoption. State regulations dictate material roadmaps; California SB 54 accelerates fiber migration, while Midwest operators cling to economical polypropylene in the absence of bans. The FDA traceability rule that took effect in January 2026 compels labels with lot codes and QR links, and Novolex now embeds track-and-trace on 60% of its domestic output.
Mexico Foodservice Packaging Market
Mexico will be the region’s growth engine, posting a 4.01% CAGR between 2026 and 2031 as rising disposable income lifts dining-out frequency in Monterrey, Guadalajara and Puebla. Starbucks intends to add 150 stores by 2027, each subject to global recycled-content standards that tilt procurement toward fiber lids and rPET cups. McDonald’s Mexico already sources 78% of guest packaging from fiber, double the 2023 level, underscoring how multinational mandates leapfrog local regulation. Yet only 12% of Mexico’s municipal solid waste was recycled in 2024, so most fiber and PLA items still head to landfill.
Canada Foodservice Packaging Market
Canada delivered roughly 15% to 18% of regional sales in 2025. The federal single-use plastics ban removed polystyrene and PVC takeout containers from the market, and British Columbia’s extended producer responsibility rules push converters to shoulder downstream disposal costs, spurring lightweighting. Tim Hortons’ partnership with Huhtamaki will roll fiber hot-drink cups across 4,000 stores by mid-2026, a shift that further reduces polyethylene-lined cup demand and opens incremental molded-fiber capacity. The Canadian Plastics Pact shows 55% of signatories met 2025 recycled-content targets, suggesting gradual but steady progress toward a national circular-economy framework.
Regulatory Landscape
Foodservice packaging in North America is shaped by food-contact chemical oversight and rapidly changing single-use and chemical-restriction rules at the federal and subnational levels. In the United States, the FDA consolidated food safety oversight under the Human Foods Program (implemented October 1, 2024) and announced a standardized post-market review framework for food chemicals on May 15, 2025. This increases the need for converters to maintain detailed substance documentation for resins, additives, and coatings. FDA activity in food-contact compliance continues through the Food Contact Notification (FCN) pathway, with multiple effective FCNs recorded between March and May 2026, alongside updates to exposure-reference tools such as the FDA CEDI database (updated February 2026). These updates support ongoing reformulation and qualification work for fluorine-free barriers and recycled-content structures.
Canada continues to tighten labeling and preventive-control expectations that affect foodservice packaging and printed components. As of January 1, 2026, all food labels must comply with the Front-of-Package (FOP) nutrition labeling requirements, increasing execution risk for foodservice operators and packaged-food programs supplied through foodservice channels. The Canadian Food Inspection Agency (CFIA) Forward Regulatory Plan (2025-2027) also points to late spring 2026 pre-publication of amendments intended to align certain requirements with US rules, which supports cross-border standardization for suppliers active in both markets. At the subnational level in the United States, PFAS restrictions continue to influence coated-paper and molded-fiber specifications, including Maine’s PFAS ban for fiber-based food packaging effective May 25, 2026, which is accelerating adoption of fluorine-free grease and moisture barriers.
Value Chain Analysis
The value chain runs from upstream feedstocks (pulp, virgin and recycled polymers, bio-based resins), additives and coatings, and tooling and converting machinery, through converters such as thermoforming, injection molding, paperboard converting, and molded-fiber producers. Distribution then flows through foodservice distributors and direct-to-chain supply, ending with quick-service restaurants, full-service restaurants, institutional catering, and hospitality and cafes. Brand owners and large chains increasingly manage the chain through supplier scorecards tied to recycled content, PFAS avoidance, and traceability. This pushes qualification work upstream into resin, coating, and barrier suppliers and shifts more value to converters that can deliver mono-material designs, certified fiber, and consistent food-contact compliance documentation.
Midstream and downstream economics are also being reshaped by policy and compliance pass-throughs, along with tighter SKU rationalization for delivery formats. State-level mandates that constrain expanded polystyrene (for example, Virginia prohibiting EPS food containers for food vendors as of July 1, 2026) accelerate substitution toward molded fiber, coated paperboard, and polypropylene. That, in turn, drives retooling and increases the value of regional manufacturing footprints for controlling freight and lead times. Cross-border sourcing remains relevant for certain substrates and finished packs, while the USMCA entered its six-year joint review process on July 1, 2026, adding attention to rules that can affect material flows among the United States, Canada, and Mexico. At end-of-life, limited industrial composting acceptance and varying municipal recycling acceptance keep converters and distributors focused on designs that fit existing curbside and MRF systems, reinforcing demand for mono-material trays, fiber formats with proven sortation performance, and clear disposal guidance.
Competitive Landscape
The North America foodservice packaging market remains moderately fragmented with players such as Novolex, Huhtamaki, Dart Container, Genpak, Pactiv Evergreen, and others. Consolidation continued as Novolex purchased Flexo Universal and Waddington to deepen its fiber and rigid-plastic range, while the USD 11.2 billion Smurfit WestRock merger created a vertically integrated pulp-to-packaging platform. Buyers such as Compass Group cite 220-basis-point operating margin erosion, partly linked to supplier consolidation, confirming rising procurement leverage for top converters.
Technology capability is emerging as a differentiator. Amcor’s US 11,234,567 patent covers QR-encoded labels that upload carbon data to a blockchain ledger, letting restaurants verify recycled-content claims in real time. Smaller entrants deliver niche value; DeliverZero and Muuse pilot reusable-container deposit loops in New York and San Francisco, but low consumer return rates keep scale uncertain. The FDA updated its bio-based coating guidance in December 2025, removing ambiguities around migration limits and unlocking accelerated R&D for fluorine-free barriers.
Vertical integration into recycling offers insulation from resin volatility. International Paper and Sustana Fiber will open a Michigan plant that processes 100,000 metric tons per year of post-consumer cups into pulp for the EverGreen line, giving the joint venture captive feedstock and a circularity narrative attractive to chain accounts. Sonoco’s USD 75 million pulper upgrade in Connecticut aims for 60% recycled fiber input, signaling that pulp security is just as critical as resin hedging in the decade ahead.
North America Foodservice Packaging Industry Leaders
-
Novolex Holdings LLC
-
Huhtamaki Oyj
-
Dart Container Corporation
-
Genpak LLC
-
Amcor plc
- *Disclaimer: Major Players sorted in no particular order
North America Foodservice Packaging Market Companies Covered in this Report
- Novolex Holdings LLC
- Huhtamaki Oyj
- Dart Container Corporation
- Genpak LLC
- Amcor plc
- Silgan Holdings Inc.
- Graphic Packaging Holding Company
- Sonoco Products Company
- Smurfit Westrock
- International Paper Company
- Anchor Packaging Inc.
- Eco-Products LLC
- Fabri-Kal Corporation
- UFP Technologies Inc.
- Inline Plastics Corp.
- Sabert Corporation
- Winpak Ltd.
- ProAmpac LLC
- Pactiv Evergreen Inc.
Market Opportunities and Future Outlook
Investment and capacity additions suggest whitespace in fiber-based, barrier-coated formats and in regionalized production that supports national and multi-site foodservice accounts. Huhtamaki’s capacity actions are a concrete indicator of that direction. The company announced a USD 120 million molded-fiber expansion in Waterville, Maine (February 2026, with added lines planned), and it also opened an expanded manufacturing facility in Paris, Texas in June 2026 to increase output for North American QSR customers. These moves align with the market pivot away from polystyrene and toward molded fiber and recyclable mono-polymer designs, while also tightening lead times for large chains that want consistent performance across states with different rules.
A second opportunity area is the supply of food-contact-compliant recycled-content polymers and traceability-enabled packaging that supports regulatory compliance and brand reporting. Amcor’s molecular-recycling-linked feedstock agreement with Eastman Chemical (announced November 2025, starting January 2026) and California’s recycled-content requirements for PET single-use items create a pull for converters that can secure food-grade rPET and document chain-of-custody. In Mexico, SIG’s January 2026 plan to expand its Querétaro plant from 1.5 to 3 billion packages per year (work starting in 2026) underscores the importance of local capacity for multinational customers applying global packaging standards in a fast-growing foodservice environment. Equipment-focused upgrades also point to near- and mid-term demand, including Ultrapak’s March 2026 expansion and modernization in Dunkirk, New York (supported by New York State’s Excelsior Jobs Program), which support higher-throughput, lower-waste converting for both conventional and sustainable SKU portfolios.
Recent Industry Developments in North America Foodservice Packaging Market
- May 2026: Amcor commercialized its PP Revolution recycle-ready polypropylene dip cup portfolio for foodservice applications. The launch expands recycle-ready PP options in small-format foodservice packs, where leakage control and heat performance drive material choices and where brands face increasing scrutiny on recyclability claims.
- April 2025: Novolex completed its business combination with Pactiv Evergreen Inc., creating a larger platform across food, beverage, and specialty packaging. The combination strengthens scale in fiber and rigid formats and improves national supply coverage for large chain customers managing multi-state regulatory requirements and delivery-driven SKU proliferation.
- October 2024: Novolex introduced TamperFlag containers aimed at improving security for delivery and takeout. The product addresses the operational need for tamper evidence in ghost-kitchen and aggregator-driven orders while giving operators a packaging-led way to support food safety protocols without adding labor steps.
North America Foodservice Packaging Market Report Scope and Research Methodology
Market Definition and Coverage
This market covers packaging products used to serve, carry, and consume prepared food and beverages through foodservice channels across North America, and it is sized in value terms based on supplier selling prices.
Scope exclusions: It excludes primary retail food packaging sold mainly for at-home consumption and it also excludes large durable kitchenware that is not treated as packaging.
Segments Covered in This Report
- By Material
- Paper and Paperboard
- Plastics
- Polyethylene Terephthalate (PET)
- Polypropylene (PP)
- Polystyrene (PS) and Expanded Polystyrene (EPS)
- Other Plastics
- Aluminum
- Glass
- Biodegradable and Specialty Materials
- By Packaging Type
- Clamshells
- Cups and Tubs
- Trays and Containers
- Sachets and Pouches
- Other Packaging Types
- By End-User Industry
- Quick-Service Restaurants (QSR)
- Full-Service Restaurants (FSR)
- Institutional Catering
- Hospitality and Cafés
- Other End-User Industries
- By Sustainability Profile
- Conventional Type
- Sustainable Packaging
- By Country
- United States
- Canada
- Mexico
Data Sources, Market Sizing, and Validation
Desk Research
Desk research helped us set the market boundary, confirm what is counted as foodservice packaging, and map the main demand pools across the United States, Canada, and Mexico. We relied on public sources such as the US Census Bureau, Statistics Canada, Mexico's INEGI, and the US International Trade Commission for trade and production context that affects materials like paperboard, plastics, and aluminum.
To translate demand signals into market value, we also used practical reference points from sources such as the US Bureau of Labor Statistics (for price movement indicators), and packaging or recycling association sites for regulatory and sustainability direction (for example, fiber adoption and recyclability labeling). Company annual reports, investor decks, and credible business press were used to sanity-check capacity additions, pricing commentary, and channel exposure. Where needed, paid database subscriptions were used only for structured company financials, news and filings tracking, and patent lookups tied to materials and barrier innovations. The sources listed here are illustrative, and we reviewed additional public documents and datasets for collection, validation, and clarification.
Primary Interviews and Surveys
Primary interviews and surveys were used to pressure-test desk assumptions on mix shifts between paper, plastics, and specialty materials, and to validate what buyers pay across key formats like cups, tubs, trays, and clamshells. We spoke with packaging converters, distributors, foodservice operators, and industry experts, and then used their inputs to tighten adoption curves for sustainable packs and to correct for local regulation impacts across North America.
Distribution of primary research fieldwork respondents
| Company type | Respondent position |
|---|---|
| Top tier: 27% | CXOs: 12% |
| Mid tier: 53% | Functional/Unit leaders: 38% |
| Smaller Players: 20% | Managers: 50% |
Market-Sizing & Forecasting
Sizing was built using a top-down approach where foodservice activity and packaged serving occasions are translated into packaging demand by format, then converted into value using typical price bands by material and pack type. Since public data does not always separate foodservice packaging cleanly, we corroborated totals with selective bottom-up checks, including sampled supplier revenue exposure to foodservice, distributor channel checks, and an average selling price (ASP) times volume build for high-volume items like cups, lids, and takeout containers.
Key model inputs included restaurant and limited-service sales trends, takeaway and delivery intensity, material price movement (paper pulp, resin-linked plastics, and aluminum), sustainability-driven substitution rates between conventional and sustainable formats, and regulatory signals that affect product redesign (for example PFAS-related restrictions and extended producer responsibility direction). For forecasting, scenario analysis tested faster or slower adoption of fiber-based packs and recycled-content products against base demand growth, and then aligned the outputs with expert views gathered in interviews. Where a segment-level data gap appeared (for example, limited visibility on sachets and pouches by end use), we bridged the estimate using comparable format shares and then adjusted it after primary feedback.
Data Validation & Update Cycle
Outputs are checked against independent signals such as food-away-from-home spend, packaging material shipment trends, and the direction of pricing in common SKUs, which helps us spot numbers that drift too far from real demand. Variances are reviewed step by step, starting with analyst cross-checks of assumptions and calculations, followed by a second review focusing on mix, pricing, and timing consistency across the United States, Canada, and Mexico.
If large anomalies remain, we re-contact respondents to confirm whether the driver is a genuine market shift (for example a regulation-led material switch) or a modeling issue such as double counting between packaging formats. Reports are refreshed annually, with interim updates when a material event changes demand, pricing, or supply conditions. Before delivery, we complete a final pass to make sure the latest public indicators and interview learnings are reflected.
Mordor Intelligence's North America Foodservice Packaging Market Size Versus Other Published Estimates
Published market sizes for foodservice packaging can look different even when the topic sounds the same, because the scope, price basis, and timing choices are not uniform across studies. Differences usually come from whether sustainable formats are counted separately or blended, how packaging types are grouped, and whether values reflect manufacturer selling prices or downstream pricing.
The benchmark table shows a spread that largely reflects what each publisher includes as foodservice packaging, and how quickly price and mix changes are incorporated. In Mordor Intelligence's model, the value is tied to North America only and organized around foodservice formats and materials (including conventional and sustainable profiles), rather than folding in adjacent retail food packaging or broader transport packaging categories.
Benchmark comparison
| Source | Market Size | Gaps in Research Methodology |
|---|---|---|
| Mordor Intelligence | USD 26.24 B (2025) | |
| Industry Association A | USD 28.90 B (2025) | This estimate appears to use a wider packaging basket that can pull in parts of retail food packaging and broader distribution packaging, which inflates the addressable value beyond foodservice-only use cases. |
| Global Consultancy B | USD 24.10 B (2025) | This estimate likely applies more conservative price assumptions and may net out selected items like cutlery, stirrers, or specialty materials, which lowers the total even if end-market demand is similar. |
Across the three values, the main takeaway is that scope and pricing logic matter as much as demand growth. By keeping the model anchored to clear foodservice channels, consistent format definitions, and practical checks on price and mix, the final number remains traceable and repeatable year to year.
Key Questions Answered in the Report
What is the current value of the North America foodservice packaging market?
The market stands at USD 26.69 billion in 2026 and is projected to reach USD 30.37 billion by 2031.
Which segment is growing fastest within this market?
Biodegradable and specialty materials lead with a 4.32% CAGR forecast between 2026 and 2031.
How are single-use plastic bans affecting material choices?
State and federal bans are accelerating shifts toward molded fiber, rPET and compostable resins, especially in California and Canada.
Why is Mexico expected to grow faster than the United States and Canada?
Rising middle-class incomes, expanding quick-service chains and urbanization are driving a 4.01% CAGR through 2031 despite limited recycling infrastructure.
What technologies are converters adopting to stay competitive?
Companies are embedding QR-coded smart labels for traceability, installing advanced recycling lines for food-grade PCR and investing in dual-ovenable fiber trays.