
Market Overview
| Study Period | 2020 - 2031 |
|---|---|
| Forecast Data Period | 2026 - 2031 |
| Base Year Market Size (2025) | USD 14.90 Billion |
| Market Size (2026) | USD 16.98 Billion |
| Market Size (2031) | USD 32.63 Billion |
| Growth Rate (2026 - 2031) | 13.94 % |
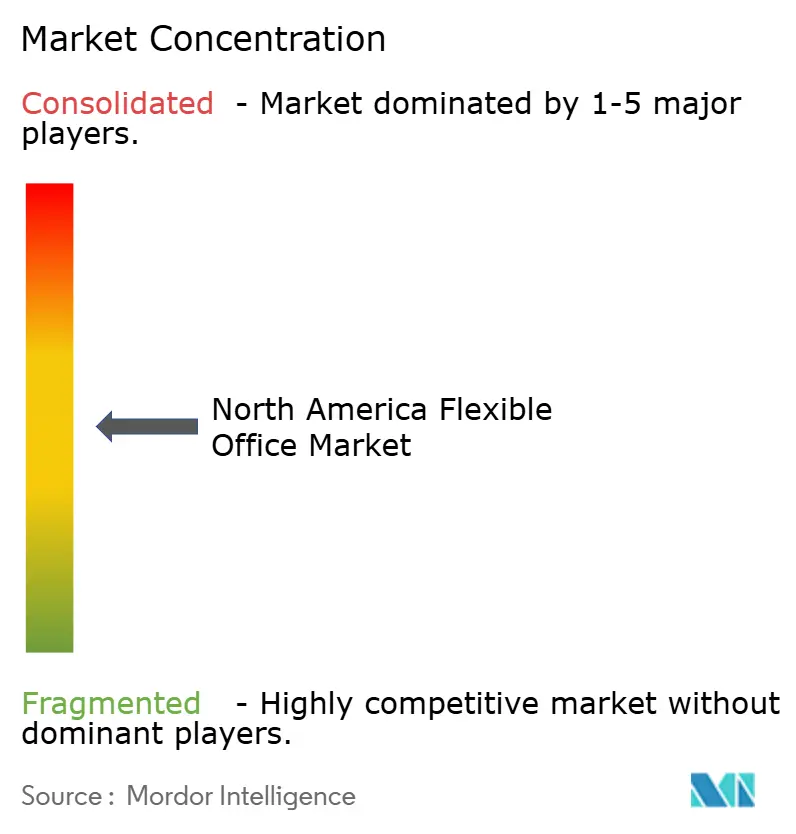
| Market Concentration | Medium |
Major Players *Disclaimer: Major Players sorted in no particular order Image © Mordor Intelligence. Reuse requires attribution under CC BY 4.0. | |
North America Flexible Office Market Analysis by Mordor Intelligence
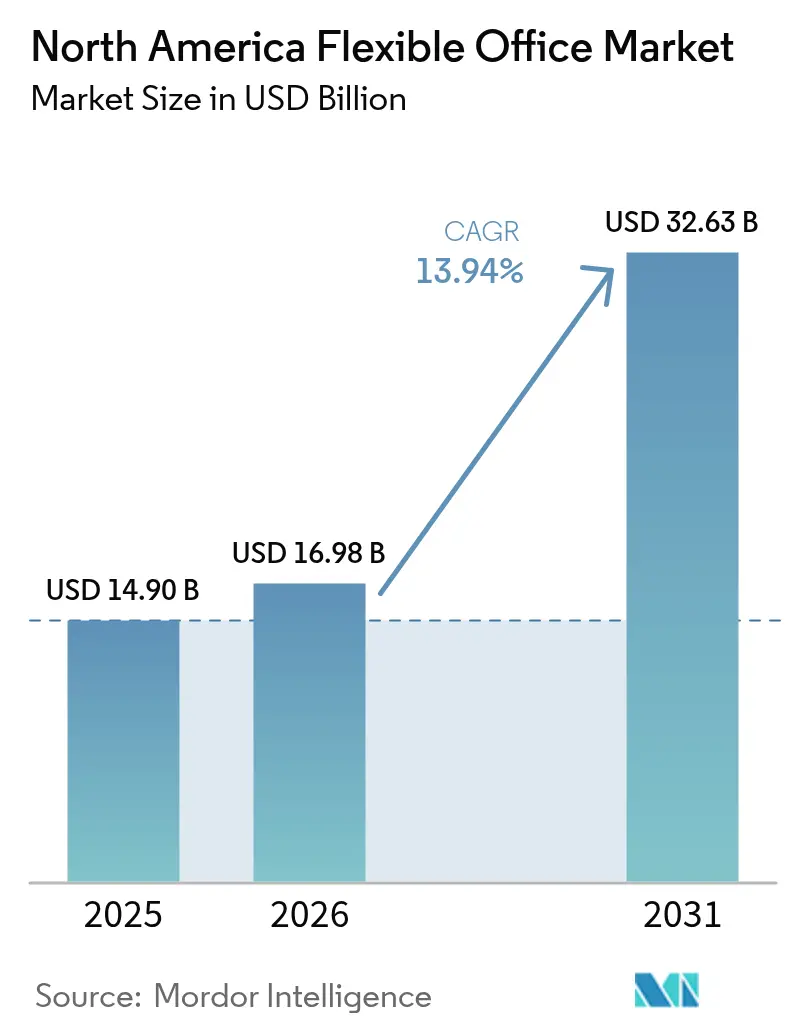
The North America Flexible Office Market size is expected to grow from USD 14.90 billion in 2025 to USD 16.98 billion in 2026 and is forecast to reach USD 32.63 billion by 2031 at 13.94% CAGR over 2026-2031. Rapid adoption of hybrid work models, growing acceptance of asset-light expansion strategies, and rising demand for technology-enabled, wellness-certified space underpin this growth path. Large enterprises are now treating flexible space as a strategic real-estate lever that supports fast geographic moves and workforce scaling with limited capital exposure. Startups and small firms widen demand by favoring plug-and-play offices that lower fit-out costs and speed team onboarding. Operators, meanwhile, refine partnership‐based rollouts that shift lease risk to landlords and accelerate entry into suburban and secondary markets, ensuring national coverage while preserving cash flow.
Key Report Takeaways
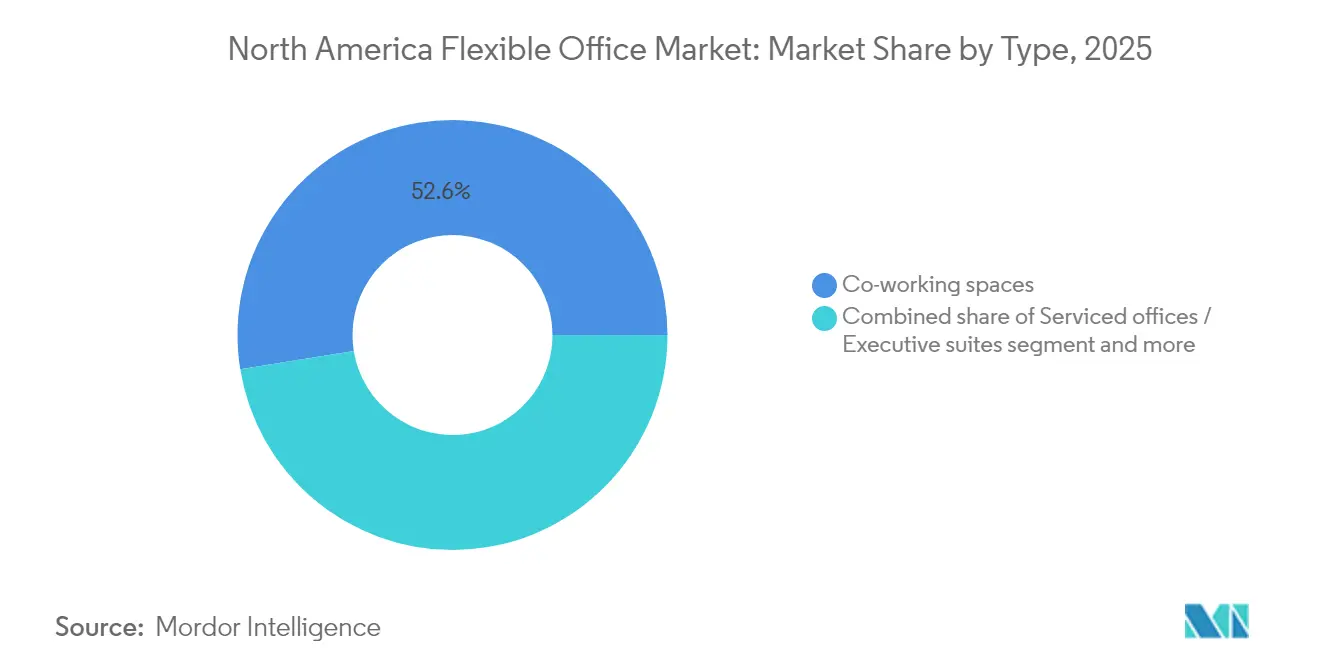
- By type, co-working solutions led with 52.55% revenue share in 2025; the hybrid and virtual office segment is projected to grow at 15.20% CAGR through 2031.
- By sector, information technology held 34.63% of the North America flexible office market share in 2025, while banking, financial services, and insurance are set to expand at 15.48% CAGR to 2031.
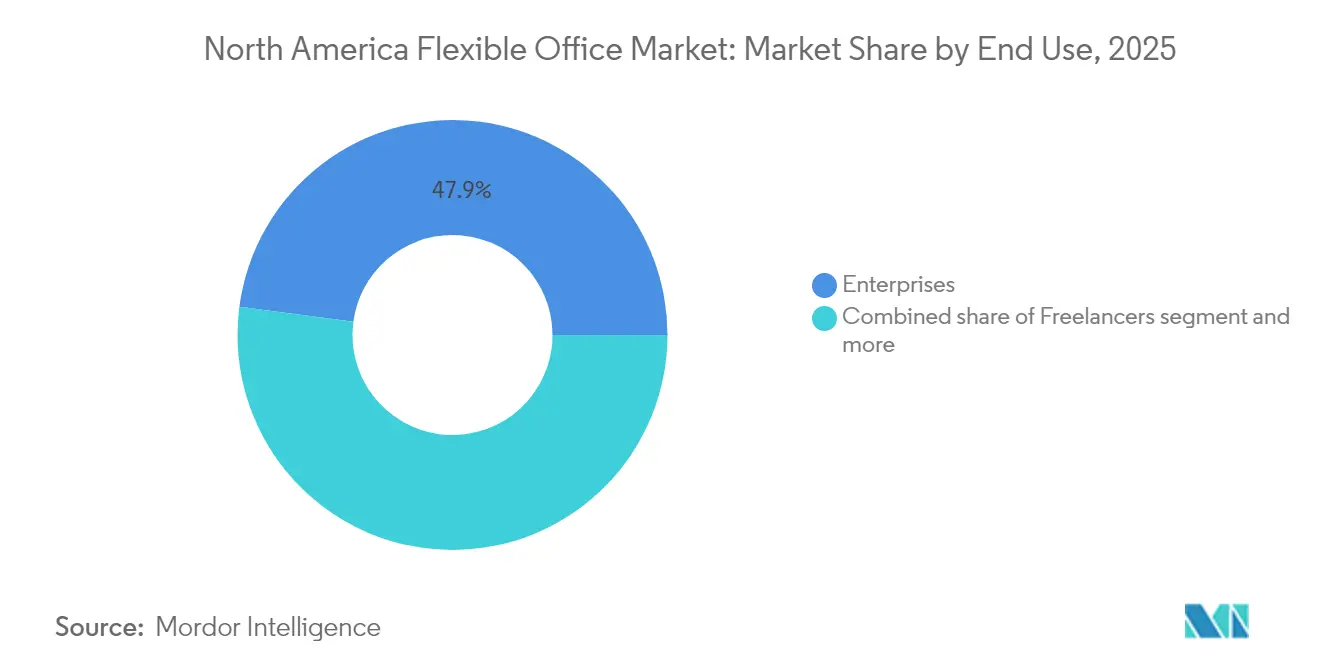
- By end use, enterprise clients accounted for 47.90% of demand in 2025; startups and emerging companies recorded the quickest rise at 16.02% CAGR through 2031.
- By geography, the United States commanded 79.65% share of the North America flexible office market size in 2025; Mexico is forecast to grow at 16.47% CAGR between 2026 and 2031.
Note: Market size and forecast figures in this report are generated using Mordor Intelligence’s proprietary estimation framework, updated with the latest available data and insights as of 2026.
North America Flexible Office Market Trends and Insights
Drivers Impact Analysis*
| Driver | (~) % Impact on CAGR Forecast | Geographic Relevance | Impact Timeline |
|---|---|---|---|
| Surging hybrid and remote work models | +3.2% | United States core metros | Medium term (2-4 years) |
| Startup and SME expansion | +2.8% | US tech hubs, Canadian corridors, Mexico border cities | Long term (≥4 years) |
| Asset-light rollouts by major operators | +2.1% | Tier-1 US metros, suburbs | Short term (≤2 years) |
| Distributed teams seeking satellite hubs | +1.9% | Suburban North America | Medium term (2-4 years) |
| Tech-enabled workspace management | +1.7% | Innovation-heavy cities | Long term (≥4 years) |
| Wellness and sustainability focus | +1.4% | California, Northeast US | Medium term (2-4 years) |
| Source: Mordor Intelligence | |||
Surging Hybrid and Remote Work Models Driving Corporate Demand for Flexible Leasing Formats
The shift toward hybrid work models is reshaping corporate occupancy strategies. While hybrid policies now steer 92% of corporate occupancy choices, a mere 17% of companies enforce strict attendance mandates. This leniency has left many corporate headquarters underutilized. In response, enterprises are reallocating 10% to 50% of their portfolios into flexible spaces, a trend management anticipates will surge in the coming two years. Current utilization rates hover between 60% and 85% of 2019 benchmarks, rendering long leases less efficient. Highlighting this shift, major players like Amazon recently inked a deal for 141,000 square feet at a WeWork facility, catering to their dynamic seating requirements. This strategic move emphasizes the growing belief that agile spaces play a pivotal role in talent retention and cost management amidst unpredictable demand fluctuations[1].
Growth of Startups and SMEs Increasing Preference for Plug-and-Play, Scalable Office Setups
The growing preference for flexible office setups among startups and SMEs is reshaping the commercial real estate landscape. Venture funding, particularly in AI, is luring early-stage firms back to physical offices. Many of these firms are pushing for a four-day office week to boost collaboration. Flexible office spaces are now offering furnished suites, high-speed internet, and reception services. This comes without the typical USD 135 per square foot fit-out cost prevalent across the Americas. By sidestepping this expense, startups showcase capital discipline, a trait highly valued by investors. As teams grow, flexible membership models allow founders to adjust their desk count monthly, aligning real estate costs with headcount. These dynamics collectively underpin the projected 16.55% CAGR growth in startup demand through 2030. The trend highlights the increasing importance of adaptable and cost-efficient office solutions in supporting business growth.
Strategic Expansion of Major Coworking Operators Through Joint Ventures and Asset-Light Models
The coworking industry is witnessing a strategic shift as operators adopt innovative models to drive growth and mitigate risks. Operators like IWG are opting for management agreements over long leases. This strategy not only paves the way for approximately 1,000 new global sites but also safeguards the balance sheet from the risks associated with fixed rents. In a significant move, WeWork's exit from Chapter 11 in 2024 wiped out USD 4 billion in debt and slashed USD 12 billion from future rent obligations, underscoring the potency of asset-light restructuring. Commercial real estate behemoths are also making their mark: CBRE's USD 800 million acquisition of Industrious seamlessly merges flexible operations with its traditional brokerage services. Such partnerships not only offer landlords a comprehensive workspace management solution but also grant operators swift access to premium towers that were once deemed too risky to lease.
Rise of Distributed Teams Encouraging Demand for Satellite and Suburban Flex Locations
The shift toward suburban coworking spaces is reshaping the U.S. flexible workspace market. As employers ease commute burdens for their hybrid staff, 45% of U.S. coworking spaces have shifted to suburban areas. WeWork's collaboration with Vast Coworking has opened the doors to over 75 suburban locations, offering businesses convenient neighborhood hubs. These sites are increasingly favored by companies for project teams that convene in person a few times weekly, all while staying close to their client bases. Furthermore, as firms tap into talent beyond traditional downtown areas, the demand for suburban spaces surges. This strategy not only diversifies geographic risk but also reduces occupancy costs compared to central business districts. The growing preference for suburban coworking spaces highlights a significant evolution in workplace dynamics.
Restraints Impact Analysis*
| Restraint | (~) % Impact on CAGR Forecast | Geographic Relevance | Impact Timeline |
|---|---|---|---|
| Elevated leasing and operating costs | −2.3% | New York, San Francisco, Toronto | Short term (≤2 years) |
| Market saturation in major cities | −1.8% | Manhattan, San Francisco, Los Angeles, Chicago | Medium term (2-4 years) |
| Economic slowdown affecting decisions | −1.5% | North America | Short term (≤2 years) |
| Fragmented zoning frameworks | −0.9% | US-Canada border areas, Mexico | Long term (≥4 years) |
| Source: Mordor Intelligence | |||
Elevated Leasing and Operating Costs in Tier-1 Metros Impacting Provider Margins
The coworking market in 2024 is navigating a challenging landscape shaped by rising costs and shifting dynamics. In 2024, Class A rents climbed by 3.1%. However, with tenant improvement budgets tightening, operators found themselves absorbing increased fit-out costs while maintaining stable membership prices. Manhattan saw 192 leases surpassing USD 100 per square foot, sidelining numerous coworking brands from iconic buildings. Since 2022, inflation has driven up construction material costs by 11%, inflating per-desk build expenses and narrowing profit margins. In response, providers are adopting dynamic pricing, introducing premium service tiers, and strategically exiting underperforming locations to safeguard their yields[2].
Market Saturation in Major Cities Creating Competitive Pressure and Price Dilution
In major downtowns, flexible office spaces now outnumber tenants, leading to intense price competition among providers. San Francisco reports a vacancy rate of approximately 34.9%, and similar conditions in Manhattan result in operators vying for a limited client pool. While WeWork and IWG dominate, controlling nearly 50% of the U.S. market, a surge of smaller brands and traditional landlords—boosting overall supply by 5% last quarter with their short-term suites—has weakened pricing power. The pace of repurposing vacant towers is sluggish, with 46% of real-estate professionals pointing to zoning and permitting challenges as primary obstacles, leaving excess space on the market. In a bid to protect margins, operators are adopting dynamic pricing, introducing concierge-level amenities, and venturing into suburbs. Notably, 45% of U.S. coworking venues have now relocated to these areas, seeking demand outside the bustling city centers.
*Our forecasts treat driver/restraint impacts as directional, not additive. The impact forecasts reflect baseline growth, mix effects, and variable interactions.
Segment Analysis
By Type: Co-Working Retains Leadership While Hybrid Models Accelerate
Co-working held 52.55% of 2025 revenue, anchoring the North America flexible office market with familiar open-plan layouts that appeal to freelancers, SMEs, and project teams. Its scale advantage lets operators negotiate favourable management agreements and bulk-buy amenities, keeping desk prices competitive. Yet clients now expect more privacy and advanced tech, prompting co-working brands to retrofit pods and video-ready rooms. These upgrades keep the largest segment sticky even as needs evolve.
Hybrid and virtual office solutions post a 15.20% CAGR and are reshaping expectations through on-demand passes, mailing addresses, and video conference credits bundled under one invoice. As enterprise clients trial four-day office rosters, they reserve smaller blocks of space across multiple locations rather than large dedicated suites. This shift supports occupancy smoothing for operators and unlocks higher yield per square foot, helping the North America flexible office market size for hybrid offerings climb steadily through 2031. Platforms like Industrious’s Deskpass merger illustrate how integrated booking networks scale reach without adding leased inventory.

By Sector: Technology Dominates While Financial Services Gains Momentum
Information technology captured 34.63% of the 2025 demand thanks to cloud developers and AI labs seeking collaboration hubs near talent clusters. Many firms combine main hubs in San Francisco, Seattle, or Austin with satellite suites in secondary cities to widen hiring pools. They also adopt sensor-driven layouts that enable usage analytics, reinforcing the industry’s early adoption pattern.
Banking, financial services, and insurance log the fastest 15.48% CAGR as remote‐trading desks and advisory teams break free from downtown towers. In Manhattan alone, finance signed most leases, topping USD 100 per square foot, yet even these firms allocate selective functions to managed suites that assure data privacy. As compliance frameworks evolve, operators introduce secure network tiers and soundproof rooms, boosting credibility with regulated clients and lifting the North America flexible office market share for this segment by the close of the decade.
By End Use: Enterprise Leads but Startup Growth Outpaces
Enterprises generated 47.90% of 2025 occupancy, leveraging large-format suites for project sprints, M&A integration teams, and regional sales pods. They prize flexible contracts that let managers add or shed capacity each quarter in line with shifting headcount, stabilising utilisation for operators, and supporting a resilient revenue base.
Startups and emerging businesses display a 16.02% CAGR as venture investment rebounds. They value the ability to relocate inside a single network as teams scale, avoiding deposit losses tied to traditional leases. Operators tailor entrepreneurship programmes, investor pitch nights, and discounted legal clinics to solidify loyalty. Freelancers and consultants maintain steady desk bookings that backfill daily vacancy gaps, ensuring occupancy remains diversified even during enterprise renewal cycles. This spread improves revenue predictability across the North America flexible office industry.
Geography Analysis
The United States dominated with an 79.65% share of the North America flexible office market in 2025, driven by dense headquarters clusters and a mature technology base that prizes agile space. New York, San Francisco, Los Angeles, and Chicago each recorded landmark rents above USD 100 per square foot for premium suites, revealing sustained demand from finance, media, and life-science tenants. Federal agencies also boost adoption as the General Services Administration permits coworking usage to meet tighter space per employee targets.
Canada contributes a stable slice of regional revenue, anchored by Toronto, Vancouver, and Montreal. These cities lure multinational tenants with bilingual skill sets and strong innovation programmes. Operators emphasize wellness and sustainability credentials, aligning with national carbon policies. Montreal’s coworking scene rebounded after earlier closures by shifting to community-driven events and landlord partnerships that traded revenue shares for lower base rent, sustaining supply despite vacancy headwinds.
Mexico delivers the highest 16.47% CAGR, buoyed by nearshoring moves from U.S. manufacturers and logistics firms seeking proximity to consumer markets without stateside cost structures. Industrial parks report 98% occupancy, spurring overflow demand for nearby office suites that host procurement, quality control, and engineering staff. Lower wage and construction costs let operators price memberships competitively while offering Grade-A finishes, positioning Mexican hubs as strategic bridges for firms balancing cost and responsiveness across the entire North America flexible office market size forecast horizon.
Regulatory Landscape
In the United States, policy direction around federal workplace utilization has tightened, influencing demand for shorter-term, shared, and on-demand space. The Utilizing Space Efficiently and Improving Technologies (USE IT) Act (P.L. 118-272), signed in January 2025, set a 60% occupancy metric for federal office buildings. OMB memorandum M-25-25 (issued February 2025) also requires agencies to implement space design standards capped at 150 square feet per person and report utilization data to GSA and OMB. Together, these measures support portfolio consolidation and utilization tracking, which tends to increase interest in flexible formats that can be scaled without long, fixed commitments.
In Canada, changes to planning and building policy can affect project delivery and compliance costs for office fit-outs and conversions. Ontario enacted the Building Homes and Improving Transportation Infrastructure Act, 2026 (Bill 98) in June 2026, amending the Planning Act to limit certain municipal authority to impose mandatory enhanced development standards on site plans, and Canada also updated Real Property (GST/HST) Regulations via a June 2026 Canada Gazette publication. In parallel, a March 2026 US executive action directed a review of federal regulatory barriers to development, including permitting and retroactive building code applications. These actions point to an active regulatory environment around permitting, standards, and real property rules that can shape flexible-office supply additions and renovation timelines across North America.
Value Chain Analysis
The value chain starts with asset owners (REITs, developers, and institutional landlords) offering underutilized or repositioned office inventory, and it continues with flexible workspace operators that design the product, manage the member experience, and run day-to-day operations. A growing share of supply is delivered through management agreements, revenue-share structures, and franchise arrangements rather than traditional long-term master leases. This approach shifts capital intensity and lease risk toward landlords, while keeping operators focused on operating performance. CBRE's January 2025 acquisition of Industrious highlights how brokerage capabilities, building operations, and flex management can be bundled into a single platform offering.
Upstream enablers include architects, workplace strategists, general contractors, modular furniture vendors, and office technology providers (access control, booking, connectivity, AV, and analytics). Downstream, enterprise occupiers, SMEs, and freelancers procure flexible space through direct operator sales, and increasingly through networked access products that extend coverage without adding leased inventory. For example, WeWork's partner-network arrangement with Vast Coworking, announced in October 2024, supports distributed access. Utilization reporting requirements in federal real estate and rising fit-out complexity are also increasing the importance of standardized operating playbooks, data capture, and repeatable retrofit packages across multi-city portfolios.
Competitive Landscape
The North America flexible office market competition remains moderate, with WeWork and IWG running half of all flexible inventory yet facing rising pressure from asset-light upstarts and landlord-backed brands. WeWork’s debt-free relaunch cut fixed rent exposure, freeing cash for technology upgrades that improve booking efficiency and member analytics. IWG’s franchise-style agreements energise suburban rollout, giving property owners revenue shares instead of fixed rent while retaining brand consistency.
Traditional real-estate brokers are integrating flexible offerings to protect brokerage fees in a downsizing world. CBRE’s USD 800 million purchase of Industrious folded 2000 on-demand spaces into its service stack, creating a one-stop workplace advisory and operations platform. JLL, Cushman & Wakefield, and Colliers strengthen managed-suite arms as occupiers request turnkey, data-rich solutions over pure brokerage transactions.
Niche providers gain ground by targeting verticals such as life sciences, legal, or creative media. Many secure former department stores and convert them into lab-ready or production-studio coworking suites, tapping municipal incentives for downtown revitalisation. Suburban operators exploit cheaper real estate, layering strong community programming and child-care add-ons that attract hybrid workers seeking neighbourhood convenience. This fragmentation widens choice for tenants but also sets the stage for new waves of M&A as brands chase network effects and tech synergies.
North America Flexible Office Industry Leaders
-
International Workplace Group plc
-
WeWork
-
Industrious
-
Knotel
-
Servcorp
- *Disclaimer: Major Players sorted in no particular order
Market Opportunities and Future Outlook
Rising fit-out and technology requirements create whitespace for operators and landlords that can package capital-intensive build-outs into managed, plug-and-play offerings. In 2026, medium-quality office fit-out costs in North America were cited at about USD 295 per square foot, which increases the hurdle for tenants to self-deliver space and strengthens the case for furnished suites with bundled AV, connectivity, and workplace services. This supports opportunities in turnkey private suites, secure network tiers for regulated users, and standardized retrofit programs that convert vacant Class A floors into flexible inventory without relying on multi-year tenant improvement negotiations.
Portfolio consolidation and utilization discipline in both the public and private sectors also favor distributed access models. US federal utilization mandates, including the USE IT Act and M-25-25 utilization reporting to GSA and OMB, reinforce active footprint management. Enterprise adoption patterns, illustrated by Amazon's 141,000-square-foot lease at a WeWork site, also show how flex formats are used for rapid scaling and dynamic seating. Operators that can provide suburban and secondary-market coverage through partner and management agreements, such as WeWork's partner network with Vast, have a pathway to broaden supply where commute-minimizing satellite hubs and multi-location passes are prioritized over single CBD headquarters footprints.
Recent Industry Developments
- July 2026: International Workplace Group (IWG) announced plans to open 12 new flexible workspace locations in Illinois, extending coverage beyond the Chicago metro area into central Illinois. The rollout adds capacity in secondary markets where hybrid teams are seeking closer-to-home work points, strengthening network density for enterprise accounts with distributed employees.
- April 2026: WeWork launched WeWork Go, an on-demand workspace solution featuring private office pods, debuting in Washington, DC. The offering expands WeWork's addressable demand beyond traditional memberships by targeting professionals who need privacy and availability in shorter sessions, reinforcing the shift toward on-demand and app-enabled access.
- October 2024: WeWork announced a partnership with Vast Coworking Group that gives WeWork members access to more than 75 suburban locations through its Coworking Partner Network. This asset-light expansion increases geographic reach without taking on new long-term leases, while aligning supply with the growing preference for neighborhood hubs in hybrid work routines.
Research Methodology Framework and Report Scope
Market Definition and Coverage
In this report, we define the North America flexible office market as the paid provision of flexible workspace access and services, including coworking, serviced or managed offices, private flexible suites, and virtual office plans, across the United States, Canada, and Mexico.
Scope exclusions: We exclude conventional long-lease office rentals that do not offer flexible terms, and we also exclude landlord-only building revenues that are not tied to flexible workspace services.
Segmentation Overview
- By Type
- Co-Working Space
- Serviced offices / Executive suites
- Others (Hybrid, Virtual Office)
- By Sector
- Information Technology (IT and ITES)
- BFSI (Banking, Financial Services and Insurance)
- Business Consulting & Professional Service
- Other Services (Retail, Lifesciences, Energy, Legal Services)
- By End Use
- Freelancers
- Enterprises
- Start Ups and Others
- By Country
- United States
- Canada
- Mexico
Data Sources, Market Sizing, and Validation
Desk Research
Desk research started with public indicators that describe the office demand pool and supply shifts, then moved to flexible workspace specific signals that show adoption and pricing. We used sources such as the US Census Bureau and Statistics Canada for business counts and services activity, and the US Bureau of Labor Statistics for employment levels tied to office using sectors.
To anchor the real estate context, we also used publications and dashboards from the Federal Reserve (rates and credit conditions), the US General Services Administration (government office footprint signals), and city-level open data portals for commercial building and permits where available. These were complemented with company filings, investor presentations, operator websites, and press coverage to capture product definitions and commercial terms. For cross-checks, we used paid subscriptions that support company financials and news screening, and a global contracts and tenders feed to pick up larger enterprise workspace awards. This list is illustrative, and many other public and paid sources were used during data collection, validation, and clarification.
Primary Interviews and Surveys
Primary interviews and surveys were used to test what we saw in desk research, especially around how contracts are priced, how occupancy is managed, and how enterprises combine flexible space with conventional leases. We spoke with operators, landlords, brokers, corporate real estate teams, and workplace strategy roles across the US, Canada, and Mexico, then used follow-up checks to close gaps on utilization, discounting, and churn assumptions.
Distribution of primary research fieldwork respondents
| Company type | Respondent position |
|---|---|
| Top tier: 32% | CXOs: 17% |
| Mid tier: 49% | Functional/Unit leaders: 37% |
| Smaller Players: 19% | Managers: 46% |
Market-Sizing & Forecasting
Sizing was built using a top-down and bottom-up approach, where the starting point came from reconstructing the addressable office demand pool by country and then applying flexible office penetration and price realizations to convert that pool into value. In practice, we linked demand to indicators such as office using employment, new business formation, corporate headcount mix by sector, and the share of hybrid work policies that push demand toward shorter term commitments.
To keep the model grounded, we ran selective bottom-up checks using supplier rollups, sampled seat and office pricing, and utilization benchmarks shared by interviewees. We then compared these outputs against the top-down total and adjusted when gaps were persistent. Key inputs used as market fingerprints included average contract length trends, desk-to-private office mix shifts, effective price per workstation (after incentives), and the proportion of enterprise deals in total memberships, since these are more directly tied to realized revenue than list price.
For forecasting, we leaned on scenario analysis with a simple multivariate regression layer to connect market growth to rate conditions, employment growth in office heavy sectors, and net absorption signals, followed by expert validation to avoid overreacting to short-term cycles. Where bottom-up coverage was thin in smaller cities or newer operators, we filled using observed price bands and occupancy ranges from comparable metros, then rechecked those assumptions with respondents who operate across multiple markets.
Data Validation & Update Cycle
Validation was done through triangulation across independent signals, including consistency checks between implied workstations, utilization rates, and revenue per workstation, then a second pass to ensure country splits match known supply and demand patterns. Outliers were flagged when growth rates or implied pricing moved outside reasonable bands, and we re-contacted sources when the variance could not be explained by a clear event such as a new opening wave or a change in enterprise procurement.
Before sign-off, the model and assumptions are reviewed in steps by more than one analyst so definition, math, and narrative stay aligned. Reports are refreshed annually, and interim checks are triggered when material events occur, such as large operator exits, major expansion announcements, or sharp rate moves that change corporate real estate decisions. Right before delivery, we run a final update pass so the numbers reflect the latest available public releases and validated field inputs.
Mordor Intelligence's North America Flexible Office Market Sizing Compared With Other Published Estimates
Published market sizes for flexible offices can look far apart because the underlying revenue line being counted is not always the same, and because pricing and utilization are treated differently by each publisher. In this market, the biggest drivers tend to be whether virtual office plans are included, whether Mexico is modeled with the same depth as the US and Canada, and how quickly occupancy and discounts are assumed to normalize after demand shocks.
Some external estimates roll flexible office into a broader coworking only view, or they expand it to include conventional serviced commercial real estate income. Mordor Intelligence counts flexible workspace revenues tied to flexible terms and membership style contracts, while keeping traditional long-lease office rents and unrelated landlord building income out of scope, which tightens the value base and improves comparability across countries.
Benchmark comparison
| Source | Market Size | Gaps in Research Methodology |
|---|---|---|
| Mordor Intelligence | USD 14.90 B (2025) | |
| Global Consultancy A | USD 12.40 B (2025) | Uses a narrower definition focused mainly on coworking memberships and excludes a portion of serviced and managed private office revenues, which reduces the total value in enterprise heavy metros. |
| Industry Association B | USD 17.80 B (2024) | Blends flexible office with adjacent serviced real estate income and applies higher assumed utilization without consistent country level validation, which inflates value when converted into annual revenue. |
The table shows that most of the spread comes from definition choices and from how effective pricing and utilization are converted into annual revenue. By keeping the scope tied to flexible contracts, checking implied workstations against utilization ranges, and aligning country coverage, our estimate stays traceable to a few clear inputs that can be rechecked as the market changes.
Key Questions Answered in the Report
What is the current value of the North America flexible office market?
The market stands at USD 16.98 billion for 2026 and is forecast to grow at 13.94% CAGR to reach USD 32.63 billion by 2031.
Which office type holds the largest share?
Co-working spaces lead with 52.55% share in 2025, though hybrid and virtual models are expanding the fastest at 15.20% CAGR.
How dominant is the United States within the region?
The United States commanded 79.65% of regional revenue in 2025, driven by strong enterprise demand and extensive operator footprints.
Which end-user group is growing most rapidly?
Startups and emerging businesses record the highest growth at 16.02% CAGR as venture funding rebounds and teams seek scalable space.
What strategic trend shapes operator expansion?
Most leading brands now adopt asset-light management agreements or franchise structures to scale quickly while limiting lease obligations.
How do wellness certifications influence demand?
The WELL Coworking Rating incentivises operators to integrate air quality, lighting, and nourishment features, attracting corporates with ESG commitments and health-focused employees.