
Market Overview
| Study Period | 2020 - 2031 |
|---|---|
| Forecast Data Period | 2026 - 2031 |
| Base Year Market Size (2025) | USD 5.51 Billion |
| Market Size (2026) | USD 6.6 Billion |
| Market Size (2031) | USD 16.26 Billion |
| Growth Rate (2026 - 2031) | 19.77 % |
| Market Concentration | Low |
Major Players *Disclaimer: Major Players sorted in no particular order Image © Mordor Intelligence. Reuse requires attribution under CC BY 4.0. | |
North America Fleet Management Solutions Market Analysis by Mordor Intelligence
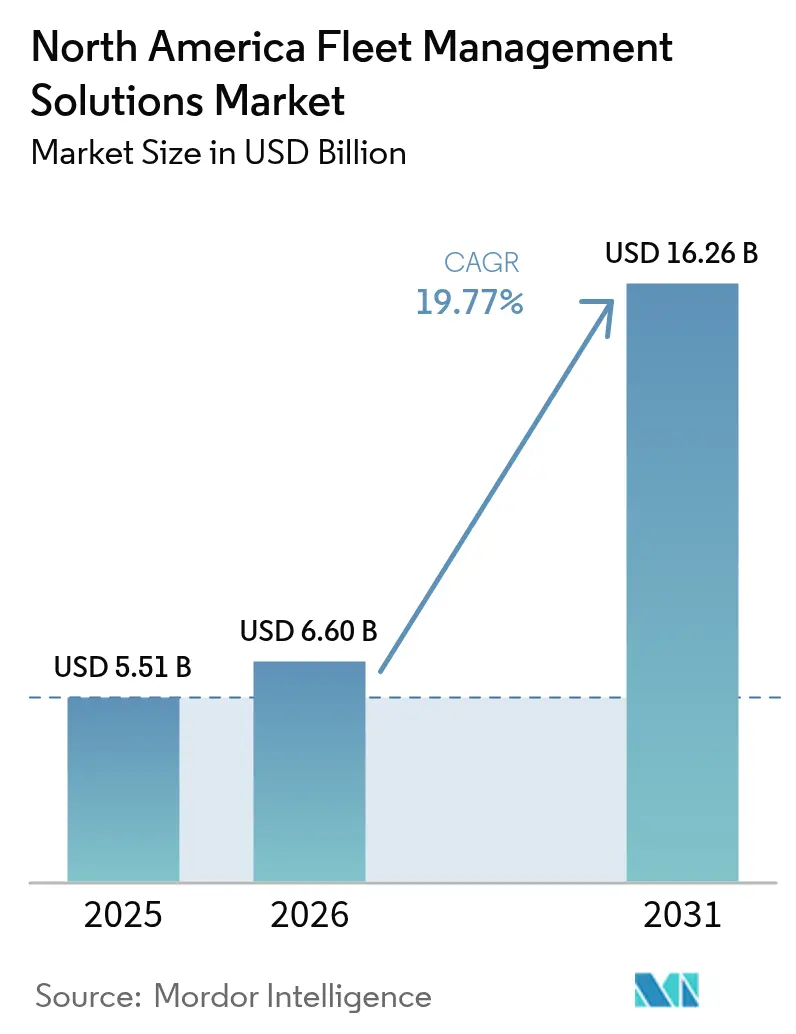
The North America fleet management solutions market size is expected to grow from USD 5.51 billion in 2025 to USD 6.6 billion in 2026 and is forecast to reach USD 16.26 billion by 2031 at 19.77% CAGR over 2026-2031. Robust federal safety mandates, expanding cloud telematics architectures, and corporate net-zero commitments are converging to accelerate platform adoption. Artificial-intelligence predictive maintenance and video-based driver analytics are shrinking downtime and insurance exposure, while EV-ready telematics help operators coordinate charging and carbon accounting. Nearshoring is lifting cross-border freight volumes, prompting demand for bilingual, scalable software that simplifies United States-Mexico-Canada trade corridor compliance. Heightened cybersecurity threats and evolving data-privacy rules are convincing vendors to hard-wire encryption, role-based access, and zero-trust policies into their roadmaps.[1]
Key Report Takeaways
- By deployment, cloud captured 61.58% of the fleet management solutions market share in 2025, while hybrid deployment is projected to expand at 22.04% CAGR through 2031.
- By application, asset management accounted for 28.44% of the fleet management solutions market size in 2025, whereas safety and compliance management is advancing at 23.71% CAGR through 2031.
- By end-user industry, transportation and logistics held 37.62% of the fleet management solutions market in 2025; energy and utilities are forecast to grow at 22.35% CAGR to 2031.
- By fleet size, medium fleets represented 44.02% of the fleet management solutions market in 2025, while large fleets are expected to expand at 21.42% CAGR through 2031.
- By geography, the United States commanded 84.92% of the fleet management solutions market in 2025, yet Mexico is projected to register 22.56% CAGR through 2031.
Note: Market size and forecast figures in this report are generated using Mordor Intelligence’s proprietary estimation framework, updated with the latest available data and insights as of 2026.
Market Trends and Insights
Drivers Impact Analysis of North America Fleet Management Solutions Market*
| Driver | (~) % Impact on CAGR Forecast | Geographic Relevance | Impact Timeline |
|---|---|---|---|
| Favorable market regulations coupled with growing emphasis on operational efficiency | +3.20% | North America, with strongest impact in United States and Canada | Medium term (2-4 years) |
| Advent of Green Fleets and corporate net-zero targets | +4.10% | Global, with early adoption in United States, expanding to Mexico | Long term (≥ 4 years) |
| Technological advancements lowering total cost of ownership | +3.80% | North America, with technology leaders in United States and Canada | Short term (≤ 2 years) |
| Growing integration of video-based safety analytics | +2.90% | United States and Canada, emerging in Mexico | Medium term (2-4 years) |
| Uptake of EV-ready telematics platforms | +3.50% | United States and Canada leading, Mexico following | Long term (≥ 4 years) |
| AI-enabled predictive maintenance for mixed-asset fleets | +2.70% | United States and Canada, limited Mexico adoption | Medium term (2-4 years) |
| Source: Mordor Intelligence | |||
Favourable Market Regulations and Operational Efficiency
Electronic-logging-device and hours-of-service mandates are anchoring telematics adoption across the continental trucking network. As carriers integrate compliance modules, they unlock real-time visibility that improves routing, idle-time reduction, and fuel spend, enabling many fleets to shift cost-of-ownership to the top of the agenda. Consolidated rules under the USMCA are simplifying cross-border reporting, allowing platforms to harmonize safety and environmental data for tri-national operations.[2]
Advent of Green Fleets and Net-Zero Targets
Climate commitments are reshaping acquisition strategies, with utilities and consumer brands publishing timelines to electrify light-duty and portioned heavy-duty assets. Federal clean-fleet incentives and state-level zero-emission truck regulations are pushing operators to blend EV scheduling, battery-health diagnostics, and renewable-energy sourcing into a single dashboard. The dual need to track both internal-combustion and electric metrics is a catalyst for mixed-powertrain modules within fleet management solutions market platforms.
Technological Advances Lowering Total Cost of Ownership
Machine-learning engines digest millions of sensors points to forecast part failures, slashing emergency repairs and service-bay queues. Coupled with automated route optimization and real-time driver coaching, the technology delivers quantifiable fuel and maintenance savings that narrow the payback window, particularly for medium and large fleets. Cloud scalability and subscription pricing further level the playing field for smaller operators.
Growing Integration of Video-Based Safety Analytics
Dual-lens and inward-facing cameras now embed edge compute that flags distraction, harsh braking, and tailgating in real time. Insurers in the United States are offering premium discounts for fleets that demonstrate sustained safety-score improvements, converting video telematics from discretionary spend to risk-management staple. The data also feeds driver-engagement programs that can boost retention in a tight labour environment.
Restraints Impact Analysis of North America Fleet Management Solutions Market*
| Restraint | (~) % Impact on CAGR Forecast | Geographic Relevance | Impact Timeline |
|---|---|---|---|
| Persistent data-privacy and driver surveillance concerns | -2.10% | United States and Canada, with varying provincial/state regulations | Short term (≤ 2 years) |
| Limited cellular coverage in rural/long-haul corridors | -1.80% | Rural areas across North America, particularly northern Canada and Mexico | Medium term (2-4 years) |
| Rising cybersecurity threats to connected vehicles | -2.40% | North America, with particular vulnerability in cross-border operations | Short term (≤ 2 years) |
| Fragmented regulatory landscape for cross-border fleets | -1.60% | United States-Mexico-Canada trade corridors | Medium term (2-4 years) |
| Source: Mordor Intelligence | |||
Persistent Data-Privacy and Driver Surveillance Concerns
Labor groups and provincial-level privacy statutes limit the capture and retention of driver-behaviour footage. Fleets deploying inward-facing cameras must negotiate union agreements outlining purpose, storage duration, and access rights. Vendors are countering with privacy-by-design architectures that segment personally identifiable information and provide anonymized scoreboards.
Rising Cybersecurity Threats to Connected Vehicles
Telematics gateways, OTA firmware, and third-party plug-ins enlarge the attack surface. Ransomware campaigns targeting fleet back-office servers and spoofed GPS data incidents have forced operators to add intrusion-detection systems, secure boot processes, and multi-factor authentication across the stack. Collaborative security audits with hardware suppliers are becoming table stakes during RFP cycles.
*Our forecasts treat driver/restraint impacts as directional, not additive. The impact forecasts reflect baseline growth, mix effects, and variable interactions.
North America Fleet Management Solutions Market Segment Analysis
By Deployment:
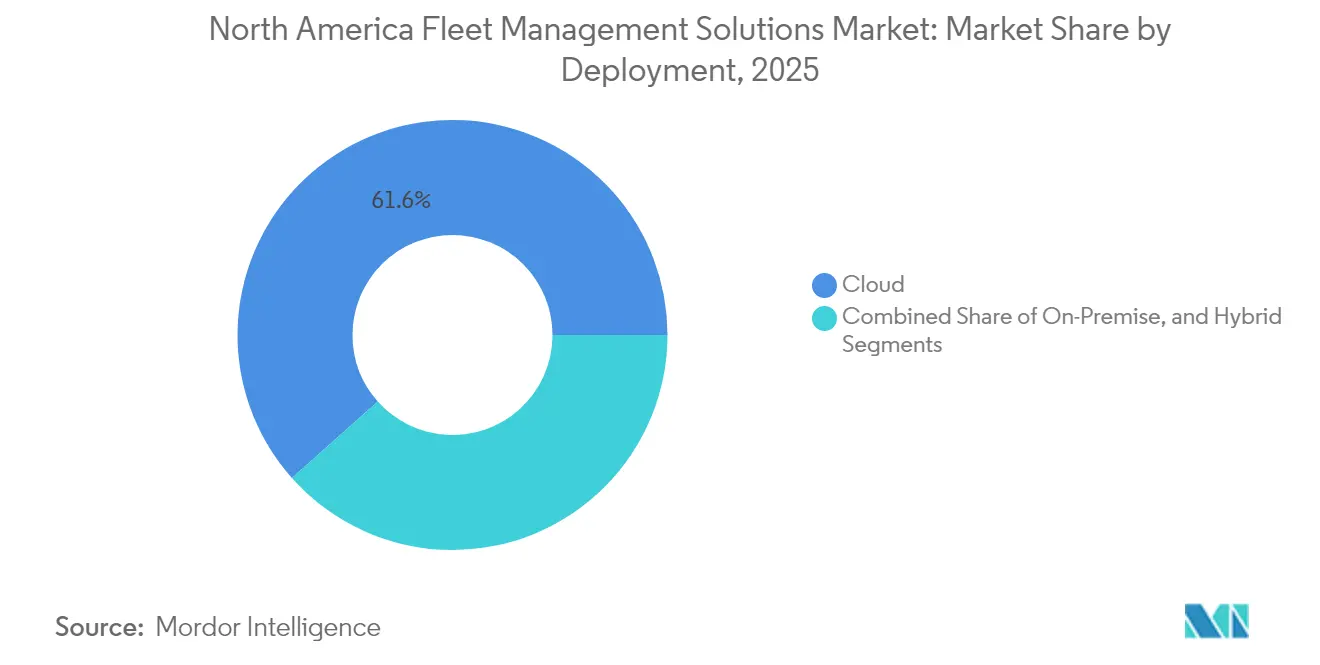
Cloud Dominance Drives ScalabilityCloud services held the largest stake, delivering 61.58% fleet management solutions market share in 2025 as operators favoured subscription economics and instant feature updates. Hybrid architectures are forecast to post a leading 22.04% CAGR to 2031, combining edge processing for latency-sensitive safety alerts with cloud analytics for strategic planning. On-premises instances persist where data-sovereignty or intermittent connectivity requires local hosting, but the relative slice is expected to erode as cloud resilience and encryption standards mature.
Large shippers increasingly pilot hybrid nodes at depots to process high-bandwidth sensor feeds while synchronizing with regional data lakes overnight. Government agencies managing emergency vehicles still lean on private clouds vetted under FedRAMP or equivalent frameworks. The expansion of satellite-backhaul options is also easing cloud adoption along long-haul corridors previously deemed connectivity deserts.

By Application:
Safety Solutions Accelerate Beyond Asset TrackingWhile asset management retained 28.44% of the fleet management solutions market size in 2025, safety and compliance modules are charting the fastest expansion at 23.71% CAGR as dash-cam AI and electronic driver-vehicle-inspection-report automation gain traction. Driver coaching dashboards and risk-scoring matrices integrate seamlessly with insurer portals, reducing claims cycles.
Operational planners are layering congestion analytics and weather overlays atop core location data to carve fuel consumption by single-digit percentages. Sustainability reporting and battery-state-of-charge orchestration are emerging as premium add-ons, allowing vendors to upsell existing clients. Cross-suite dashboards improve data coherence, minimizing swivel-chair workflow fatigue for dispatchers.
By End-User Industry:
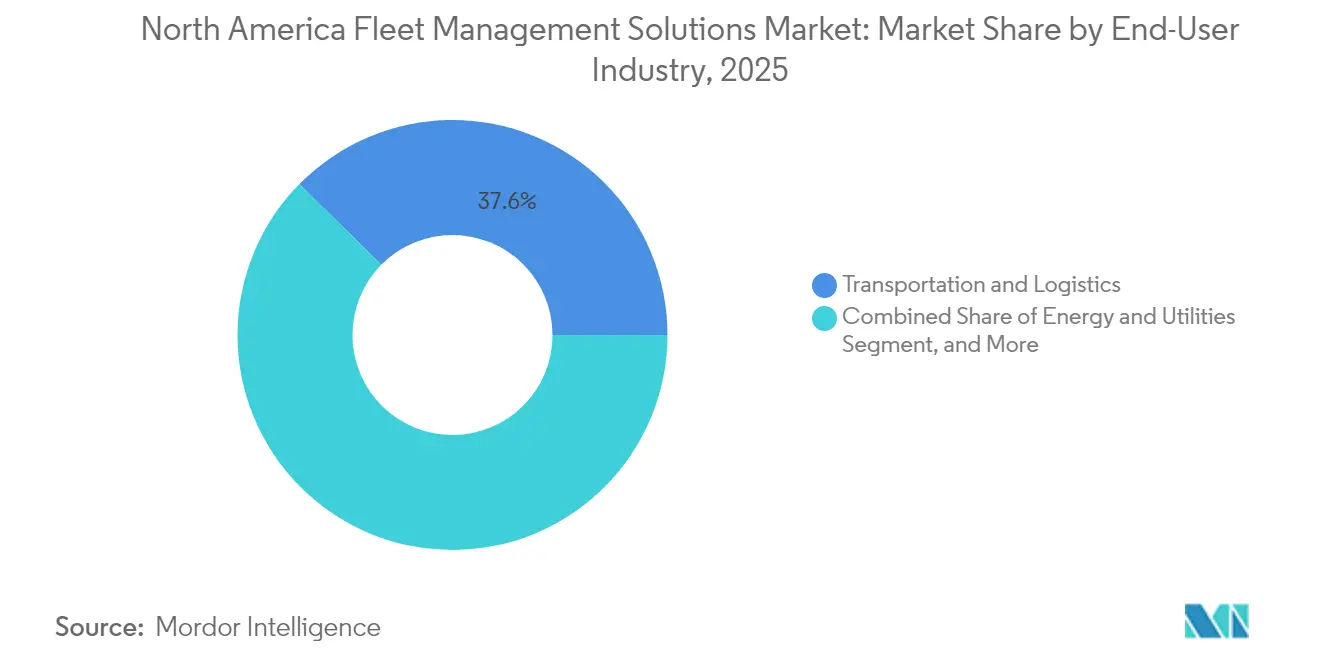
Utilities Lead Growth TransformationTransportation and logistics accounted for 37.62% of the fleet management solutions market in 2025, yet utilities are poised for the sharpest climb at 22.35% CAGR through 2031 as grid-modernization and vehicle-to-grid pilots multiply. Utilities treat telematics not only as an operational necessity but also as a grid-balancing enabler when electric bucket trucks and service vans act as mobile storage.
Construction, manufacturing, and public-sector fleets follow with specialized needs such as power-take-off monitoring or chain-of-custody documentation for hazardous goods. Industry-specific regulations, from OSHA site-safety logs to FDA cold-chain integrity, continue to influence module selection and customization budgets.
By Fleet Size:
Large Fleets Propel Advanced Analytics UptakeMedium fleets delivered 44.02% revenue during 2025, reflecting balanced complexity and budget flexibility. However, fleets exceeding 251 vehicles will see the quickest acceleration, growing at 21.42% CAGR as economies of scale justify predictive analytics, bespoke integrations, and multi-year SaaS commitments.
Conversely, micro fleets rely on stripped-down apps that bundle GPS, basic DVIR, and automated IFTA reporting under app-store pricing. Tiered licensing now allows upward mobility as operators surpass fleet-size thresholds, ensuring client stickiness for platform vendors.
Geography Analysis
United States Fleet Management Solutions Market
The United States dominated with 84.92% of 2025 spend, anchored by stringent federal mandates and dense commercial-freight corridors that amplify ROI for data-rich solutions. Urban congestion tolling and clean-air-zone expansion are prompting metro fleets to track granular emissions, while California’s Advanced Clean Fleets rule sets a template other state may follow. Federal tax credits for alternative powertrains are channelling grant dollars into integrated EV-telematics rollouts.
Canada Fleet Management Solutions Market
Canada’s vast geography, severe winters, and provincial rule variations present unique hurdles, yet its large-distance haulers gain outsized value from predictive maintenance and fuel-tax automation. Provincial zero-emission-vehicle targets and Clean Fuel Regulations are steering utilities and municipal fleets toward dashboards that consolidate GHG reports with maintenance workflows. Satellite-enabled connectivity vendors are partnering with telecoms to plug rural gaps, opening new opportunities for the fleet management solutions market.
Mexico Fleet Management Solutions Market
Mexico, forecast to advance at 22.56% CAGR, benefits from manufacturing relocation and heightened cross-border freight. Growing demand for Spanish-language interfaces, customs-document digitization, and peso-denominated invoicing has spurred regional ISVs to integrate with established North American platforms. Public-sector safety programs are also encouraging transport concessions to adopt ELD-equivalent devices, extending addressable market depth.
Regulatory Landscape
Regulation in North America continues to anchor fleet management deployments around safety, digital compliance records, and emissions reporting. In the United States, the Federal Motor Carrier Safety Administration (FMCSA) maintains the core compliance framework for interstate commercial fleets, reinforcing the move toward electronic records through ongoing rulemaking and guidance updates in 2026 (including updated guidance on prohibited coercion and FAQs related to CDL rules). FMCSA also expanded program funding support in 2026, announcing USD 217 million in grants for the trucking and bus industries, reinforcing technology-enabled safety, compliance, and enforcement workflows.
Canada operates through a federal-provincial model built on the Canadian Council of Motor Transport Administrators (CCMTA) National Safety Code (NSC), a 16-standard template adopted by provinces and territories, alongside federal requirements for extra-provincial carriers under the Commercial Vehicle Drivers Hours of Service Regulations (noted as modified June 5, 2026). CCMTA also issued the Canadian ELD Technical Standard 1.3 (September 29, 2025), tightening interoperability and technical compliance expectations for electronic logging. Across the region, clean-fleet policy signals, including US Executive Order 14057 (100% ZEV acquisitions for federal light-duty by end of FY2027, and all federal acquisitions by 2035), push fleet platforms to add EV readiness, charging coordination, and auditable sustainability reporting alongside traditional safety and operations modules.
Competitive Landscape
The fleet management solutions market remains moderately fragmented, yet consolidation is accelerating as platform strategists seek scale in subscriber counts and data lakes. Recent transactions such as PowerFleet’s USD 200 million purchase of Fleet Complete and Platform Science’s takeover of Trimble’s telematics arm signal a push toward end-to-end ecosystem control. Acquirers aim to fold hardware, edge compute, and AI frameworks into unified brands that lower client onboarding friction.
Telecommunications carriers leverage existing SIM footprints and 5G rollouts to embed telematics as value-added services, creating cross-sell synergies with IoT business units. Meanwhile, truck OEMs introduce factory-installed connectivity suites, challenging aftermarket hardware vendors. Niche disruptors target untapped pockets EV-charging analytics, construction-equipment telematics, toll-and-toll-violation reconciliation to differentiate against generalist platforms.
Cybersecurity posture has emerged as a critical differentiator; providers with ISO 27001 and ISO 21434 certifications secure contract footholds among government buyers and multinationals. Vertical-specific feature depth, local-language support, and open APIs influence buying decisions as fleets prioritize futureproofing and integration agility.[4]
North America Fleet Management Solutions Industry Leaders
-
PowerFleet, Inc.
-
Geotab, Inc.
-
Verizon Communications Inc. (Connect)
-
Omnitracs, LLC
-
GPS Trackit, Inc.
- *Disclaimer: Major Players sorted in no particular order

North America Fleet Management Solutions Market Companies Covered in this Report
- Geotab Inc.
- Verizon Communications Inc. (Verizon Connect)
- Trimble Inc.
- Samsara Inc.
- Omnitracs LLC
- PowerFleet Inc.
- MiX Telematics Ltd.
- Teletrac Navman (Vontier Corporation)
- Zonar Systems Inc.
- GPS Trackit Inc.
- Inseego Corp.
- Motive Technologies Inc.
- Fleet Complete (Constellation Software Inc.)
- Gurtam UAB
- Donlen LLC (Hertz Global Holdings Inc.)
- Enterprise Fleet Management Inc.
- ARI Fleet Management Company
- Azuga Inc. (Bridgestone Americas Inc.)
- KeepTruckin Inc.
- Michelin Connected Fleet (Sascar Tecnologia Automotiva S.A.)
Read Analysis of North America Fleet Management Solutions Companies
Market Opportunities and Future Outlook
Compliance digitalization and paperwork elimination across core FMCSA workflows are creating a direct opportunity for integrated fleet platforms. In 2026, FMCSA finalized changes that move fleets further toward fully electronic compliance operations, including authorization of electronic Driver Vehicle Inspection Reports (eDVIRs) effective March 23, 2026, and a final rule published June 22, 2026 that removes the requirement for drivers to carry a printed ELD operator manual (effective July 22, 2026). These updates support demand for unified systems that combine ELD, DVIR, maintenance, safety coaching, and audit-ready document retention, particularly for carriers operating across multiple states and cross-border corridors where process standardization reduces administrative burden.
Vendor and fleet actions also point to whitespace around advanced maintenance, asset uptime, and next-generation operating models (EV and autonomous), which require stronger orchestration layers. Estes expanded its partnership with Samsara in March 2026 to deploy equipment monitoring and connected asset maintenance across 43,000-plus trailers, highlighting monetizable demand for maintenance automation and high-volume asset health workflows beyond basic tracking. OEM-led ecosystems are widening procurement pathways as well, with Stellantis launching its Pro One commercial fleet ecosystem in North America in June 2026, centered on the Pro One NEXT uptime command center, which increases the need for tighter integration between OEM data, dealer/service networks, and third-party fleet platforms. In parallel, autonomous operations readiness is becoming more concrete, supported by Element Fleet Managements multi-year partnership with Waymo (announced June 2026) spanning fleet readiness, maintenance, and charging infrastructure management.
Recent Industry Developments in North America Fleet Management Solutions Market
- July 2026: Geotab renewed its fleet management partnership with the State of Connecticut Department of Administrative Services, covering more than 3,600 vehicles. The renewal reinforces Geotabs position in large public-sector fleets where compliance reporting, uptime, and standardized procurement favor platform vendors with proven deployments.
- March 2026: Estes expanded its partnership with Samsara to roll out Equipment Monitoring and Connected Asset Maintenance across its 43,000-plus trailers. The deployment elevates connected maintenance from a feature to a scaled operational program, strengthening demand for predictive workflows tied directly to trailer health and shop execution.
- March 2025: Fleetio raised USD 450 million and agreed to acquire Auto Integrate, adding a large repair-shop connectivity layer to its maintenance authorization network. The move deepens integration between fleet operators and service ecosystems, tightening the linkage between software workflows, parts decisions, and repair throughput.
North America Fleet Management Solutions Market Report Scope and Research Methodology
Market Definition and Coverage
For this study, the market covers software and connected services used to plan, monitor, and control commercial and service fleets across North America, including tools that support compliance, driver performance, vehicle health, and day-to-day fleet operations.
Scope exclusions: We exclude consumer personal vehicle tracking apps, standalone insurance underwriting services, and general IT consulting that is not delivered as a fleet solution.
Segments Covered in This Report
- By Deployment
- On-Premise
- Cloud
- Hybrid
- By Application
- Asset Management
- Information Management
- Driver Management
- Safety and Compliance Management
- Risk Management
- Operations Management
- Other Applications
- By End-User Industry
- Transportation and Logistics
- Energy and Utilities
- Construction
- Manufacturing
- Other End-User Industries
- By Fleet Size
- Small Fleets (1-50 vehicles)
- Medium Fleets (51-250 vehicles)
- Large Fleets (251+ vehicles)
- By Country
- United States
- Canada
- Mexico
Data Sources, Market Sizing, and Validation
Desk Research
Desk research was used to anchor the market to measurable signals like fleet activity, safety compliance needs, and digital adoption across the United States, Canada, and Mexico. We referenced public and official sources such as US Department of Transportation and FMCSA materials, Bureau of Transportation Statistics datasets, Statistics Canada transportation tables, and INEGI transport and economic statistics for Mexico. Where it helped, we also reviewed guidance and publications from agencies connected to emissions controls and vehicle inspection requirements, since regulatory pressure often drives telematics and safety monitoring adoption.
To translate those signals into revenue, we reviewed supplier disclosures such as annual reports, investor presentations, product literature, and pricing pages, then supplemented with reputable press and association publications that discuss fleet operating costs and technology penetration. We also used paid subscriptions for company financial intelligence, news and financials, and patent databases when public disclosures were too high level for line-item estimation. The sources listed here are illustrative, and we reviewed additional materials to collect data points, validate assumptions, and clarify market scope.
Primary Interviews and Surveys
We interview fleet owners, solution buyers, operations leaders, and technology specialists in the United States, Canada, and Mexico. Their input helps clarify adoption by fleet size, renewal behavior, deployment mix, pricing, and unmet needs. Surveys and expert checks are also used to resolve gaps in public data and test the assumptions behind the North American model.
Distribution of primary research fieldwork respondents
| Company type | Respondent position |
|---|---|
| Top tier: 26% | CXOs: 18% |
| Mid tier: 49% | Functional/Unit leaders: 30% |
| Smaller Players: 25% | Managers: 52% |
Market-Sizing & Forecasting
We sized the market using a top-down build that starts from the addressable fleet base and usage intensity, then reconstructs value through adoption and spending patterns for fleet software and connected services. In practice, the model links commercial fleet counts by country with solution penetration by fleet size, then applies typical subscription and service spend per vehicle or per fleet account, before adjusting for product bundling and multi-year contract structures.
To keep the totals realistic, we cross-checked the outputs with selective bottom-up approximations, such as sampled price plans multiplied by expected active vehicle counts, partner channel checks on attach rates, and supplier revenue split estimates from public filings. Key inputs treated as market fingerprints include connected vehicle penetration in commercial fleets, compliance and safety program intensity, average vehicles per fleet by size band, renewal behavior for software subscriptions, and mix shift from on-premise deployments to cloud. Where data was missing for smaller providers or private firms, we filled gaps using conservative peer benchmarks by solution type, then validated the ranges through interviews.
For forecasting, scenario analysis was used so adoption and pricing can move differently under tighter regulation, changing fuel costs, and faster digitization of field operations. Each scenario was tied back to variables interviewees could comment on, such as expected telematics adoption in small fleets, the pace of video and safety feature uptake, and typical annual price uplifts in subscription contracts.
Data Validation & Update Cycle
Validation was done through multiple checks so the final numbers remain consistent with how fleets buy and how suppliers report. We compared model results against independent signals like commercial vehicle parc trends, technology adoption indicators, and public revenue disclosures, then investigated any large variances before sign-off. When an anomaly appeared, such as an outlier spend per vehicle or an unrealistic penetration jump, assumptions were revisited and interview follow-ups were triggered.
Before delivery, the latest news, regulatory changes, and major product or pricing announcements are reviewed so the market view reflects current conditions. Reports are refreshed annually, and interim updates are made when material events meaningfully change demand or supplier revenues.
Mordor Intelligence's North America Fleet Management Solutions Market Estimate Compared With Other Published Estimates
Published market sizes for fleet management solutions in North America can look far apart because firms do not always count the same revenue streams, and they also differ on which countries and buyer types are included. Timing adds another layer, since some studies use older pricing and adoption rates even as subscription renewals and cloud migrations change.
Standalone vehicle financing and leasing revenue sits outside Mordor Intelligence's scope here, which is a common reason other estimates land higher when they bundle financing with telematics and fleet operations software. Differences also show up when studies treat video telematics hardware as a full pass-through value instead of focusing on solution revenue, and when they use one blended spend per vehicle without adjusting for fleet size mix and compliance-driven use cases in the United States, Canada, and Mexico.
Benchmark comparison
| Source | Market Size | Gaps in Research Methodology |
|---|---|---|
| Mordor Intelligence | USD 5.51 B (2025) | |
| Global Consultancy A | USD 7.20 B (2025) | Often bundles adjacent spend such as leasing and financing administration, and may also count a larger share of hardware value instead of focusing on recurring solution revenue. |
| Industry Association B | USD 4.80 B (2025) | Typically reflects member reported revenues and may undercount private and smaller providers, and it can miss cross border deployments when reporting is organized by local chapters. |
The spread in the table mainly comes down to what is counted as a fleet solution, and how consistently pricing and penetration are updated across fleet sizes and countries. By tying the estimate to a defined demand pool (commercial fleets) and to repeatable inputs like adoption, typical subscription spend, and renewal behavior, we can keep the total transparent and easier to recreate.
Key Questions Answered in the Report
How fast is the North America fleet management solutions market expected to grow?
The market is projected to post a 19.77% CAGR between 2026 and 2031, rising from USD 6.6 billion to USD 16.26 billion.
Which deployment model is most popular with North American fleets?
Cloud platforms dominate with 61.58% share, favored for scalability and automatic feature updates.
Which fleet application segment will grow the quickest?
Safety and compliance management solutions are forecast to expand at 23.71% CAGR as AI-based video analytics gain traction.
What end-user industry shows the strongest growth outlook?
Energy and utilities fleets are projected to record a 22.35% CAGR through 2031, driven by electrification and grid-modernization projects.
Why are large fleets adopting telematics faster than small fleets?
Fleets with more than 251 vehicles unlock economies of scale that justify predictive analytics, bespoke integrations, and multi-year SaaS contracts.
What is the biggest operational concern limiting broader adoption?
Rising cybersecurity threats to connected vehicles are prompting fleets to demand hardened, zero-trust telematics architectures before rollout.