
Market Overview
| Study Period | 2021 - 2031 |
|---|---|
| Forecast Data Period | 2026 - 2031 |
| Base Year Market Size (2025) | USD 8.39 Billion |
| Market Size (2026) | USD 8.94 Billion |
| Market Size (2031) | USD 12.27 Billion |
| Growth Rate (2026 - 2031) | 6.52 % |
| Market Concentration | Medium |
Major Players *Disclaimer: Major Players sorted in no particular order Image © Mordor Intelligence. Reuse requires attribution under CC BY 4.0. | |
North America Flavored Milk Market Analysis by Mordor Intelligence
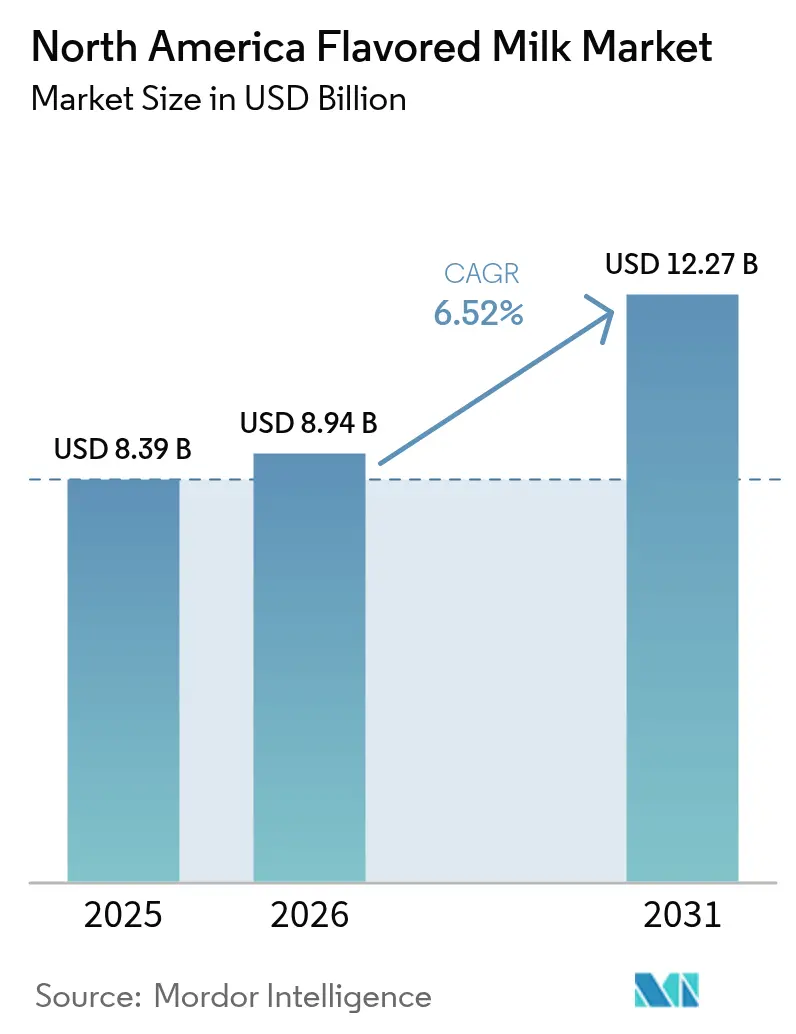
North America flavored milk market size in 2026 is estimated at USD 8.94 billion, growing from 2025 value of USD 8.39 billion with 2031 projections showing USD 12.27 billion, growing at 6.52% CAGR over 2026-2031. This market size projection signals a clear growth runway that reflects resilient demand, widening product repertoires, and an active regulatory backdrop that favors innovation. Rising incomes in Mexico, continued private-label expansion in the United States, and sustained product reformulation to meet school nutrition rules keep volume momentum strong[1]. Demand is further underpinned by supply-side advances in aseptic processing that lower logistics costs, investment in aluminum-free barriers that cut carton emissions by 61%, and a steady pipeline of fortified SKUs positioned as convenient protein sources for adults. Competitive intensity remains moderate as leading processors navigate carton shortages, acquire shelf-life assets, and diversify packaging, yet new entrants still find room in niche protein-enriched and plant-based lines. These factors collectively establish a positive near-term outlook for the North America flavored milk market even as pressure rises from sugar-reduction mandates and the fast-growing appeal of dairy alternatives.
Key Report Takeaways
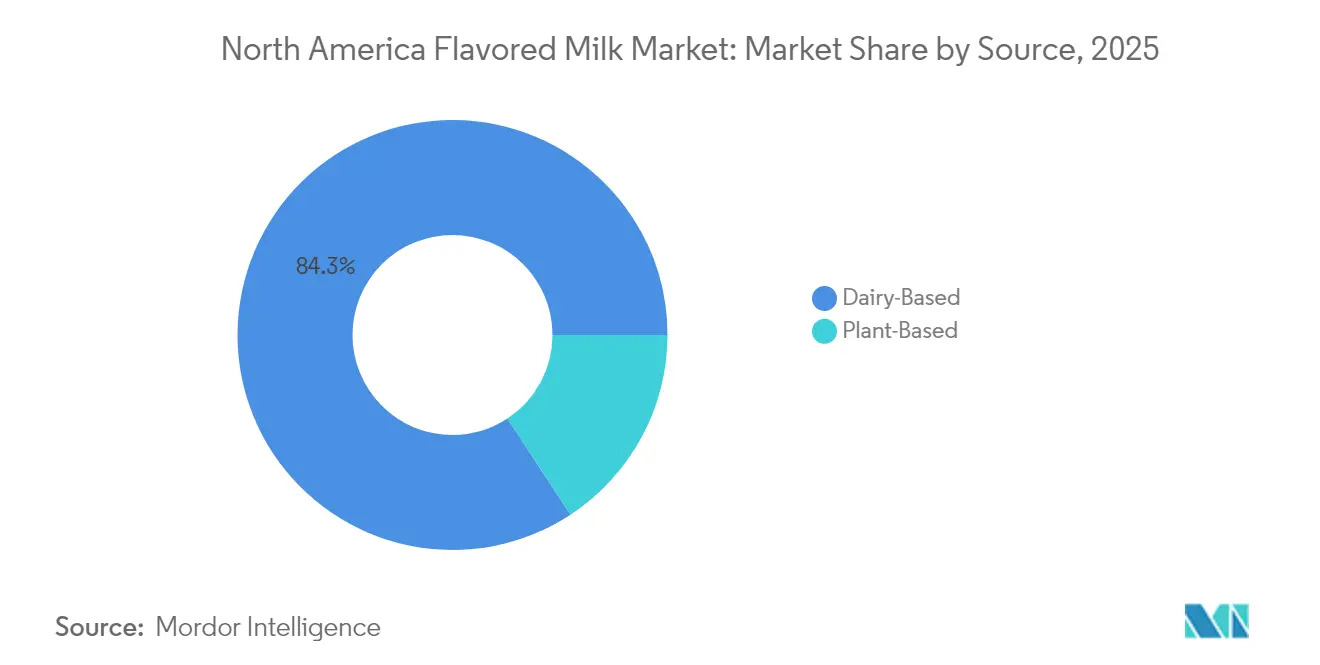
- By source, dairy-based products led with an 84.25% share of the North America flavored milk market in 2025; plant-based alternatives are projected to expand at 10.21% CAGR through 2031.
- By distribution channel, the off-trade segment commanded 71.05% of the North America flavored milk market size in 2025, while also recording the highest growth at 12.05% CAGR to 2031.
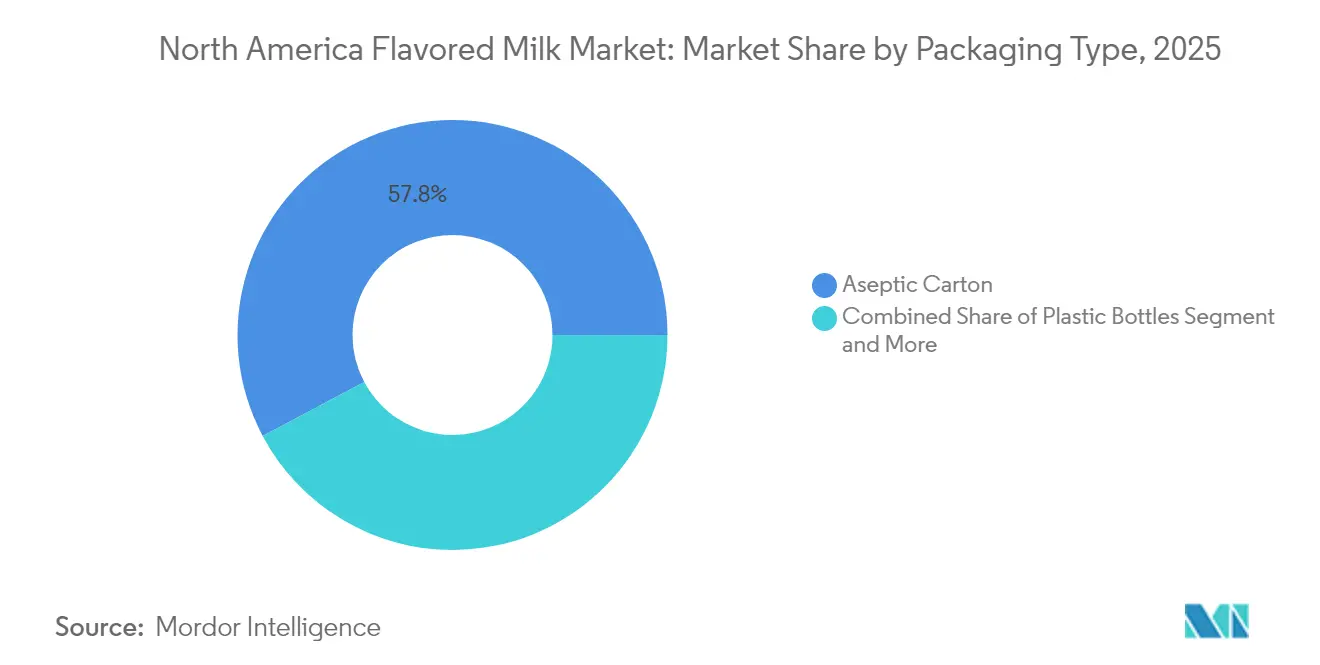
- By packaging type, aseptic cartons captured 57.78% revenue share in 2025; plastic bottles are advancing at an 8.52% CAGR through 2031.
- By geography, the United States accounted for 76.20% of North America flavored milk market share in 2025, whereas Mexico is forecast to grow the fastest at 6.58% CAGR to 2031.
Note: Market size and forecast figures in this report are generated using Mordor Intelligence’s proprietary estimation framework, updated with the latest available data and insights as of 2026.
Market Trends and Insights
Drivers Impact Analysis of North America Flavored Milk Market*
| Driver | % Impact on CAGR Forecast | Geographic Relevance | Impact Timeline |
|---|---|---|---|
| Rising demand for convenient, nutrient-dense RTD dairy beverages | +1.2% | North America-wide, strongest in urban centers | Medium term (2-4 years) |
| Product innovation in child-targeted flavors and formats | +0.8% | US and Canada school districts | Short term (≤ 2 years) |
| Fortified / protein-enriched SKUs for health-conscious adults | +0.9% | US metropolitan areas, expanding to Mexico | Medium term (2-4 years) |
| USDA post-2024 school meal rules boosting flavored low-fat milk | +1.5% | United States K-12 institutions | Short term (≤ 2 years) |
| Digital personalized-nutrition tie-ins for athletic recovery | +0.4% | North America fitness markets | Long term (≥ 4 years) |
| Advances in aseptic processing & shelf-life extension technologies lowering cold-chain dependence | +1.1% | Regional distribution networks | Medium term (2-4 years) |
| Source: Mordor Intelligence | |||
Rising Demand for Convenient, Nutrient-Dense RTD Dairy Beverages
Consumer migration toward ready-to-drink formats accelerates as lifestyle demands prioritize convenience without compromising nutritional density. The shift reflects broader demographic trends where 42% of US consumers purchased private-label products in 2024 to manage inflation pressures, creating opportunities for premium RTD flavored milk positioned as accessible nutrition[2]. Aseptic processing technologies enable ambient storage and extended distribution reach, reducing cold-chain dependencies that historically limited market penetration in rural and emerging regions. FDA regulations under 21 CFR 113 require validated thermal processes and continuous monitoring for commercially sterile RTD products, establishing quality benchmarks that differentiate premium offerings from commodity alternatives. The regulatory framework supports innovation in packaging formats, with SIG's aluminum-free barrier materials achieving 12-month shelf life while reducing carbon footprints by 61% compared to traditional aseptic cartons[3]. This technological advancement addresses sustainability concerns while maintaining product integrity across temperature-variable distribution networks.
Product Innovation in Child-Targeted Flavors and Formats
The April 2024 USDA final rule caps added sugars at 10 g per 8-oz serving in schools, triggering widespread reformulation and flavor engineering to balance taste and compliance. Processors now integrate natural fruit concentrates and low-glycemic sweetener systems to maintain sensory appeal. FDA standards of identity under 21 CFR 131.110 allow characterizing flavor ingredients, granting flexibility for school-compliant innovations. Package-level engagement, such as interactive graphics on half-pints, bolsters lunchtime excitement while portion-control formats mitigate waste during ongoing carton supply shortages. These developments keep flavored milk entrenched as a preferred beverage in educational settings across the North America flavored milk market.
Fortified / Protein-Enriched SKUs for Health-Conscious Adults
Adult consumers adopt flavored milk as an accessible recovery beverage that naturally delivers casein, whey, and electrolytes often sought in sports drinks. FDA fortification policy sets vitamin A and D minima yet allows extra micronutrients, encouraging processors to add zinc, magnesium, or omega-3s for additional value. Retailers capitalize by dedicating chilled space to high-protein flavored milk lines that command premiums over conventional variants. Private labels leverage co-packing to test functional concepts, evidenced by refrigerated private-label foods rising 7.5% y-o-y in 2024. Consistent quality controls imposed by the Pasteurized Milk Ordinance allow processors to upscale without compromising safety, underscoring the North America flavored milk market’s reputation for trustworthy functional beverages.
USDA Post-2024 School Meal Rules Boosting Flavored Low-Fat Milk
School meal programs serve 30 million U.S. children daily and account for 427 million gallons of fluid milk sales, making compliance with added-sugar caps mission-critical. The Healthy School Milk Commitment covers processors responsible for over 90% of volume, guaranteeing supply pipelines for reformulated SKUs. Uniform specifications around fat-free and low-fat milk streamline procurement, lower switching costs, and cement flavored milk as a staple in meal reimbursements. Early-moving firms that developed compliant recipes enjoy first-mover shelf space advantages, reinforcing brand loyalty among younger demographics in the North America flavored milk market.
Restraints Impact Analysis of North America Flavored Milk Market*
| Restraint | % Impact on CAGR Forecast | Geographic Relevance | Impact Timeline |
|---|---|---|---|
| Heightened scrutiny of added sugars in beverages | -0.9% | US regulatory focus, expanding to Canada | Short term (≤ 2 years) |
| Shift toward plant-based lactose-free alternatives | -1.3% | Urban North America, strongest in US West Coast | Medium term (2-4 years) |
| Local school-district bans on flavored milk varieties | -0.6% | US school districts, particularly California and Northeast | Short term (≤ 2 years) |
| Supply tightness and price spikes in aseptic carton laminates | -0.8% | North America packaging supply chain | Medium term (2-4 years) |
| Source: Mordor Intelligence | |||
Heightened Scrutiny of Added Sugars in Beverages
USDA restrictions represent the first nationwide sugar limits in school meals, capping flavored milk sugars at 10 g per serving from July 2025. Child and Adult Care Food Program guidance discourages high-sugar beverages, expanding institutional pressure beyond K-12. Public-health campaigns amplify messaging, nudging parents toward reduced-sugar choices. Reformulating without compromising taste elevates R&D costs, and natural sweeteners such as monk fruit or stevia alter flavor profiles that risk consumer attrition. Plant-based competitors highlight naturally lower sugars in their marketing, intensifying substitution threats within the North America flavored milk market.
Shift Toward Plant-Based Lactose-Free Alternatives
FDA draft guidance published in March 2025 permits terms like “soy milk” while encouraging voluntary nutrition comparisons, lowering labeling barriers for dairy alternatives. Plant-based household penetration climbed to 33% by 2016 and retail sales reached USD 2.4 billion by 2020, demonstrating rising mainstream acceptance. Institutional settings must still meet nutrient equivalency, yet these drinks escape dairy-specific sugar caps, giving them formulation latitude. Improvements in protein fortification close historic nutritional gaps, making alternatives more competitive on school menus if prices converge. These dynamics subtract incremental volume from the North America flavored milk market over the medium term.
*Our forecasts treat driver/restraint impacts as directional, not additive. The impact forecasts reflect baseline growth, mix effects, and variable interactions.
North America Flavored Milk Market Segment Analysis
By Source:
Dairy Leads While Plant-Based RisesDairy-based flavored milk held 84.25% North America flavored milk market share in 2025, anchored by established supply chains and nutritional superiority that satisfies federal meal guidelines. Consistent regulatory definitions under 21 CFR 131.110 shield dairy positioning, while the Pasteurized Milk Ordinance ensures quality integrity across state lines. The North America flavored milk market size for dairy-based offerings is forecast to climb to USD 9.94 billion by 2031 at a 5.86% CAGR, driven by shelf-life technologies that open low-frequency shopping regions and by fortified lines that command premium pricing. Large cooperatives such as Dairy Farmers of America capitalize on member milk pools to scale aseptic capacity efficiently, while brands like Nesquik exploit broad retail penetration to sustain volume leadership.
Plant-based alternatives accelerate at 10.21% CAGR through 2031, reaching USD 2.37 billion and eroding a portion of dairy share. FDA’s March 2025 guidance grants labeling certainty, and voluntary comparison statements incentivize manufacturers to bridge protein gaps through soy or pea fortification. Market entrants position oat-based drinks as allergen-friendly options with lower sugar, courting health-conscious millennials. Retailers dedicate end-caps to dairy-free flavored SKUs, supporting trial. The North America flavored milk industry adjusts by co-packing plant-based lines to hedge against share drift, while dairy lobbyists pursue legislative avenues to restrict the milk nomenclature, an outcome still uncertain.

By Distribution Channel:
Off-Trade Dominance ContinuesOff-trade outlets commanded 71.05% of the North America flavored milk market in 2025, aided by double-digit online grocery growth and the convenience of grab-and-go multi-packs. Private-label momentum is strong: refrigerated store brands advanced in 2024 as consumers traded down amid inflation. Retailers negotiate long-term supply partnerships that favor processors able to guarantee carton availability and school-compliant formulations. Promotions around family-size value packs stimulate pantry loading, supporting average price realizations.
On-trade growth lags amid lingering packaging volatility; still, institutional volumes remain steady given mandated school meal demand. Carton shortages in 2024 forced distributors to source generic labels and temporary plastic alternatives. Foodservice chains adopt portion-controlled plastic bottles with high-barrier films to extend shelf life, balancing cost pressures with waste-reduction targets. As supply normalizes, operators expect flavored milk rotation to regain historical cadence, yet tighter sugar rules may slightly temper volume gains in certain age cohorts.
By Packaging Type:
Carton Stability Meets Bottle InnovationAseptic cartons retained 57.78% share of the North America flavored milk market in 2025 thanks to line speed, cost efficiency, and widespread equipment base. New aluminum-free full-barrier substrates lower carbon footprints and answer recycling critiques while preserving 12-month ambient shelf life. The North America flavored milk market size for aseptic cartons is anticipated to surpass USD 6.98 billion by 2031 as school programs and shelf-stable club packs keep demand solid. Industry groups encourage multi-supplier sourcing after the Pactiv Evergreen closure exposed single-point failure risk.
Plastic bottles grow at 8.52% CAGR, buoyed by resealability, portability, and premiumizing opportunities. Lightweight PET coupled with oxygen-scavenging layers reduces material use yet safeguards flavor stability. Processors deploy shrink-sleeve graphics to convey protein or sugar-reduction claims, capturing impulse buys at c-stores. Retail merchandisers favor upright visibility, and bottle multipacks facilitate ecommerce shipping, further expanding reach within the North America flavored milk market.
Geography Analysis
United States and Mexico Flavored Milk Market
In 2025, the U.S. dominated North America's flavored milk market, holding a commanding 76.20% share. This dominance is bolstered by a robust refrigeration infrastructure, stringent adherence to FDA regulations, and the substantial demand from the National School Lunch Program. Innovations in private labels and a crossover with sports nutrition are driving heightened demand in grocery stores. Meanwhile, processors are channeling investments into UHT lines, eyeing export prospects in Latin America. When carton supply disruptions arose, the IDFA showcased its logistical agility by coordinating alternate sourcing, ensuring school deliveries remained uninterrupted. This adaptability not only resolved immediate challenges but also fortified the market's resilience. Mexico, though starting from a smaller base, is on track in the market. Factors like rising disposable incomes and modernized retail landscapes are making flavored milk more accessible in urban supermarkets. Thanks to the USMCA, cross-border supply synergies are not just streamlining operations but also fast-tracking technology transfers. Local plants are now installing aseptic fillers, a technology once exclusive to their northern counterparts. Multinational companies are ramping up marketing efforts around protein-fortified drinks, tapping into the burgeoning fitness culture and aiming to capture a larger slice of the North American flavored milk market.
Canada Flavored Milk Market
Canada's flavored milk scene is characterized by mature yet consistent consumption patterns. Here, bilingual labeling and nutrient criteria are closely aligned with U.S. standards, albeit with some local tweaks. The country's supply-managed dairy system not only ensures top-notch raw milk quality but also offers pricing transparency, bolstering producer margins. With a growing emphasis on sustainability, there's a push for carton recycling and a keen interest in low-carbon packaging. In a forward-thinking move, processors are trialing aluminum-free barriers, anticipating a trend that may soon gain traction in the U.S. While certain provinces see a surge in plant-based products, innovations in flavors and lactose-free dairy options continue to win over loyal consumers.
Regulatory Landscape
In the United States, flavored dairy milk formulation and naming are anchored in FDA standards of identity, including 21 CFR 131.110, which allows optional ingredients such as flavoring and characterizing ingredients within standardized milk. Commercially sterile shelf-stable flavored milk produced via retorting or aseptic processes must also meet FDA thermal processing and monitoring requirements under 21 CFR 113, reinforcing process validation discipline for extended-shelf-life products supplied into off-trade and institutional channels.
In Canada, the Canadian Food Inspection Agency (CFIA) administers dairy compositional and labeling expectations through the Food and Drug Regulations and incorporated-by-reference documents, including Canadian Standards of Identity (Volume 1) and the Food Compositional Standards Document (FCSD). These documents include standards for flavored milk variants (for example, named-flavor skim milk). A labeling anchor came in February 2026, when CFIA issued updated common name requirements that transition terminology from "modified milk ingredients" to "milk-derived ingredients," with an implementation transition period extending to 2030. Packaged flavored milk and ingredient users therefore need to align ingredient statements and label approvals accordingly.
Value Chain Analysis
The value chain starts with raw milk procurement from dairy farms and cooperatives, followed by collection, chilling, and transport to processors operating under the Pasteurized Milk Ordinance framework for food safety and interstate movement. Processors then standardize and fortify milk, blend flavors and sweeteners, and apply pasteurization or UHT/aseptic processing, before filling products into aseptic cartons, plastic bottles, or other formats for distribution through refrigerated and ambient logistics networks. In the United States, school and institutional demand acts as a specification-driven offtake point, which reinforces planning around compliant low-fat and reduced-sugar formulations.
Packaging and processing inputs, particularly aseptic carton materials and UHT/aseptic line capacity, remain critical nodes that shape availability and cost. Changes in the broader dairy processing system, including reform discussions around USDA Milk Marketing Orders and investments that add new processing capacity, influence how efficiently milk is absorbed into higher-value categories such as shelf-stable flavored milk, protein-enriched drinks, and private-label offerings. Downstream, off-trade retailers and online channels dominate volume with multi-pack merchandising and private-label sourcing, while foodservice and schools rely on contracted distribution and consistent packaging supply to maintain continuity.
Competitive Landscape
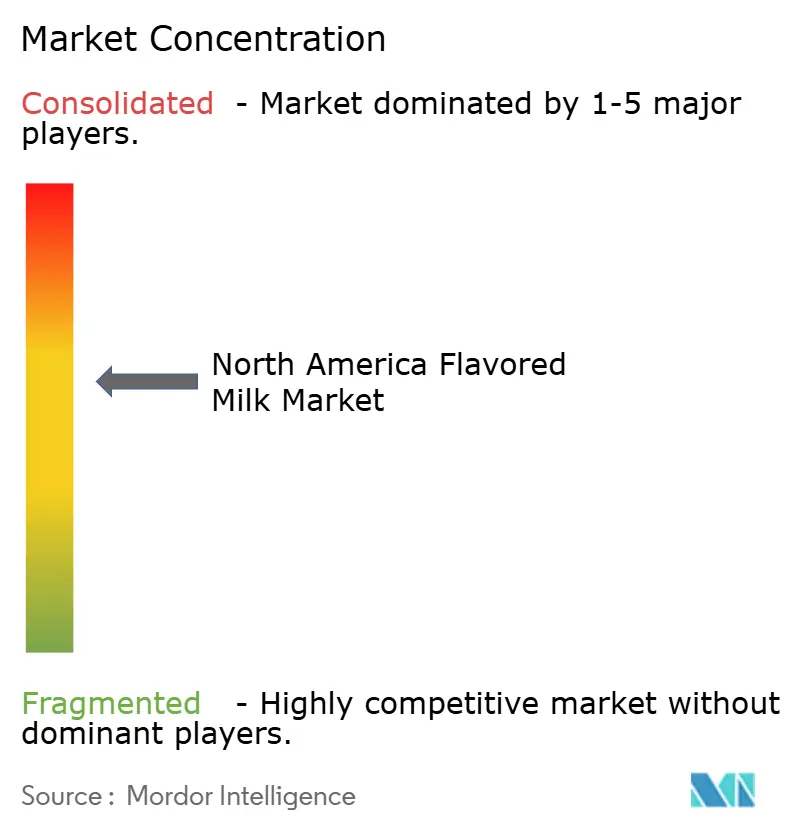
The North America flavored milk market shows a moderate concentration score of 6/10 as the top tier of processors commands a sizable yet not dominant slice of revenue. Nestlé leverages Nesquik’s brand equity and broad retail presence, upgrading recipes to sub-10 g sugar to retain shelf prominence in K-12 supply lists. Dairy Farmers of America capitalizes on cooperative milk supply and recently expanded aseptic filling at acquired facilities to meet private-label demand. Saputo diversifies with plant-based flavored beverages under recently purchased alt-dairy brands, hedging against dairy-volume risk in urban markets. Danone’s Horizon Organic line uses bottle lightweighting to appeal to environmentally conscious parents, while Kraft Heinz exploits cross-category synergy between cheese snacking and Kool-Aid flavored milk co-branding.
Consolidation continues as Maola Local Dairies acquired HP Hood’s Philadelphia UHT plant in March 2024, shoring up shelf-life capacity and retaining 160 union positions. Patent filings around aluminum-free aseptic materials, sugar-reduction enzymes, and extended-shelf-life filtration reflect sustained R&D outlays aimed at margin expansion. Start-ups emphasize direct-to-consumer fulfillment of fortified, lactose-free flavored milks in recyclable PET, targeting millennials seeking transparent sourcing. The interplay between scale advantages of incumbents and brand nimbleness of newcomers keeps price competition contained while encouraging premium innovation across the North America flavored milk market.
North America Flavored Milk Industry Leaders
-
Nestle S.A
-
Danone
-
Dairy Farmers of America
-
Saputo Inc.
-
The Kraft Heinz Company
- *Disclaimer: Major Players sorted in no particular order
North America Flavored Milk Market Companies Covered in this Report
- Nestle S.A.
- Dairy Farmers of America
- Saputo Inc.
- Danone S.A.
- The Kraft Heinz Company
- The Hershey Company
- Fairlife LLC
- Agropur Dairy Cooperative
- Grupo Lala
- Borden Dairy
- H.P. Hood LLC
- Prairie Farms Dairy
- Oakhurst Dairy
- Hiland Dairy
- Clover Sonoma
- Kroger (Dairy Division)
- Chobani (Ultra-Filtered Milk)
- Arla Foods
- Dean Foods (legacy brands under DFA)
- Mondel?z International (Yoo-hoo)
Market Opportunities and Future Outlook
High-protein flavored milk and ultrafiltered dairy formulations represent a clear whitespace as processors and retailers expand functional, lower-sugar propositions for both adults and family shoppers. A concrete capacity signal came in January 2026, when Michigan Milk Producers Association (MMPA) marked an expansion of its ultrafiltered milk processing facility in Ovid, Michigan. This increased system capability to supply high-protein dairy ingredients that can be deployed into protein-forward flavored milk and RTD dairy beverages.
Retailer-led vertical integration and regional processing footprints also create an opportunity for consistent supply, freshness, and private-label expansion in off-trade. In April 2026, Walmart opened its third owned and operated milk processing facility in Robinson, Texas, investing USD 350 million to process milk products including 1% chocolate milk. The additional capacity tightens control over supply and supports broader assortment management at the store level. At the industry level, IDFA reported in October 2025 that US dairy processors committed USD 11 billion in new and expanded manufacturing capacity across 19 states, supporting more UHT, extended-shelf-life, and value-added flavored milk production as brands navigate school sugar limits, packaging constraints, and competition from dairy alternatives.
Recent Industry Developments in North America Flavored Milk Market
- April 2026: Dairy Farmers of America (DFA) launched TruMoo Star Wars Blue Milk (vanilla low-fat) nationwide starting April 16, 2026. The limited-time licensed product approach supports retail velocity and brand engagement in core flavored milk, while keeping offerings aligned with lower-fat positioning used in many institutional specifications.
- October 2025: The International Dairy Foods Association (IDFA) reported that US dairy processors committed USD 11 billion in new and expanded manufacturing capacity across 19 states, spanning 2025 through early 2028. The scale and breadth of investment supports more UHT/aseptic and value-added dairy beverage output, which directly expands the manufacturing runway for shelf-stable and protein-forward flavored milk formats.
- March 2024: Maola Local Dairies acquired HP Hood’s Philadelphia UHT plant, strengthening its shelf-life processing footprint while retaining unionized jobs at the site. The transaction added UHT capacity that supports wider distribution for shelf-stable flavored milk and private-label programs that benefit from longer shelf life and simplified logistics.
North America Flavored Milk Market Report Scope and Research Methodology
Market Definition and Coverage
This market covers ready-to-drink flavored milk sold across North America in value terms, including dairy-based and plant-based options that are positioned and priced as flavored milk beverages.
Scope exclusions: Plain white milk, drinkable yogurt, dairy-based meal replacements, and powdered beverage mixes are excluded unless they are sold and labeled as flavored milk.
Segments Covered in This Report
- By Source
- Dairy-Based
- Plant-Based
- By Distribution Channel
- On-Trade
- Off-Trade
- Supermarkets / Hypermarkets
- Convenience Stores
- Specialist Stores
- Online Retail
- Other Channels
- By Packaging Type
- Aseptic Cartons
- Plastic Bottles
- Glass Bottles
- Others
- By Geography
- United States
- Canada
- Mexico
- Rest of North America
Data Sources, Market Sizing, and Validation
Desk Research
Desk work starts with building a clean fact base on milk production, processing, and beverage sales signals across the United States, Canada, and Mexico. We rely on public sources such as USDA (dairy supply and price series), Statistics Canada, the Government of Canada trade data portal, and Mexico INEGI for baseline food and beverage indicators that help anchor demand.
To translate those indicators into a practical market model, we also review items such as FDA and Health Canada guidance for labeling and dairy standards, customs and tariff-line trade releases, and peer-reviewed nutrition and dairy science journals for consumption and formulation context. Company annual reports, investor presentations, and press releases are used to confirm product focus (flavors, packaging moves, and channel emphasis) and to track major launches. Where needed, a paid subscription focused on company financials and a shipment-level import export database are used to sanity-check scale and timing. These examples are not exhaustive, and many other public sources were also used to collect, verify, and clarify data points.
Primary Interviews and Surveys
Primary work is used to confirm what is actually counted as flavored milk at shelf and foodservice, and to pressure-test pricing, channel splits, and growth drivers that do not show up cleanly in public datasets. We speak with a mix of processors, brand owners, ingredient and packaging participants, distributors, and retail and foodservice stakeholders across North America so gaps from desk findings can be narrowed and assumptions can be cross-checked.
Distribution of primary research fieldwork respondents
| Company type | Respondent position |
|---|---|
| Top tier: 37% | CXOs: 14% |
| Mid tier: 45% | Functional/Unit leaders: 42% |
| Smaller Players: 18% | Managers: 44% |
Market-Sizing & Forecasting
The model begins with a top-down build where the flavored milk demand pool is reconstructed from fluid milk consumption signals, flavored milk penetration by channel, and observed price ladders by pack type, which are then adjusted for country-level mix. Bottom-up checks are run selectively using sampled price per liter times estimated volumes, plus channel checks on what sells through supermarkets, convenience, online, and on-trade, so totals do not drift away from market reality.
Key inputs used include average retail price movement for flavored milk versus plain milk, packaging mix shifts (aseptic cartons versus plastic and glass), dairy versus plant-based share changes, promotional intensity and premiumization signals, and foodservice recovery trends that affect on-trade volumes. When direct data is thin for smaller channels or niche plant-based SKUs, we fill gaps using proxy indicators like shelf space checks, trade commentary on distribution wins, and cross-country ratio logic that is validated with interview feedback.
For forecasting, we use scenario analysis tied to expected milk price cycles, packaging cost trends, and channel growth outlooks, and then we apply smoothing to avoid unrealistic year-to-year jumps. Assumptions on price progression and mix are revisited during the forecast build so growth is not driven by a single aggressive variable.
Data Validation & Update Cycle
Before finalizing, our estimates are triangulated against independent signals such as dairy beverage category growth, milk production and availability trends, and observed price ranges by packaging and channel. If a variance looks unusual, the driver is traced back to the input layer, and follow-up calls are triggered to re-check the assumption that caused the swing.
A multi-step review is done where one analyst checks model math and source alignment, and another reviews whether the story matches real market behavior in each country. Reports are refreshed annually, and interim updates are made when material events occur, such as sharp milk price changes, major regulation updates, or channel disruptions. Right before delivery, a final pass is completed so clients receive the latest updated view.
Mordor Intelligence's North America Flavored Milk Market Estimate Compared With Other Published Estimates
Published market sizes for flavored milk in North America often do not match because the counted products and the year used as the starting point are not always the same. Differences also come from how pricing is treated, especially when some sources let inflation and premium packs drive most of the growth.
A common gap driver in this space is whether plant-based flavored milk is included alongside dairy, and whether on-trade servings are measured as a beverage market or kept closer to packaged retail sales. Some publishers also mix in adjacent dairy drinks like drinkable yogurt or protein shakes, or they apply a broad beverage multiplier when hard volume cues are limited, which can push the number up quickly. The spread in the table is largely explained by keeping the scope limited to flavored milk sold as such across dairy and plant-based sources, and by re-checking country price ladders by packaging before locking the base year, which is how the current estimate was set by Mordor Intelligence.
Benchmark comparison
| Source | Market Size | Gaps in Research Methodology |
|---|---|---|
| Mordor Intelligence | USD 8.39 B (2025) | |
| Industry Publisher A | USD 16.25 B (2025) | The estimate appears to use a wider revenue scope that can inflate the total, with less clarity on whether adjacent dairy beverages and broader flavored dairy drinks are included alongside flavored milk. |
| Market Research Outlet B | USD 3.10 B (2023) | The figure is anchored to an earlier base year and reads closer to a narrower retail-focused view, which can undercount on-trade and some off-trade channels and can apply a simpler price progression path. |
Looking across the three figures, most of the difference comes from scope breadth and how pricing and channel coverage are handled over time. When the counted products are clearly separated from nearby dairy drinks and the price and mix assumptions are checked against observable packaging and channel signals, the result stays easier to explain and repeat from one update cycle to the next.
Key Questions Answered in the Report
How large is the North America flavored milk market in 2026?
It stands at USD 8.94 billion and is projected to grow at 6.52% CAGR to USD 12.27 billion by 2031 (2026-2031).
Which source segment is growing fastest?
Plant-based flavored milk is expanding at 10.21% CAGR, outpacing dairy-based lines yet still representing a smaller share.
Why are off-trade channels leading sales?
Consumers favor at-home consumption and private-label value, giving off-trade outlets a 71.05% share and the highest growth at 12.05% CAGR.
How will new USDA sugar limits affect flavored milk?
Processors must reformulate to cap added sugars at 10 g per 8-oz serving by July 2025, accelerating investment in low-sugar flavor systems.
What packaging innovation is most influential?
Aluminum-free full-barrier aseptic cartons cut carbon footprints by 61% while preserving 12-month shelf life, aligning with sustainability mandates.