
Market Overview
| Study Period | 2020 - 2031 |
|---|---|
| Forecast Data Period | 2026 - 2031 |
| Base Year Market Size (2025) | USD 67.01 Billion |
| Market Size (2026) | USD 77.01 Billion |
| Market Size (2031) | USD 154.33 Billion |
| Growth Rate (2026 - 2031) | 14.92 % |
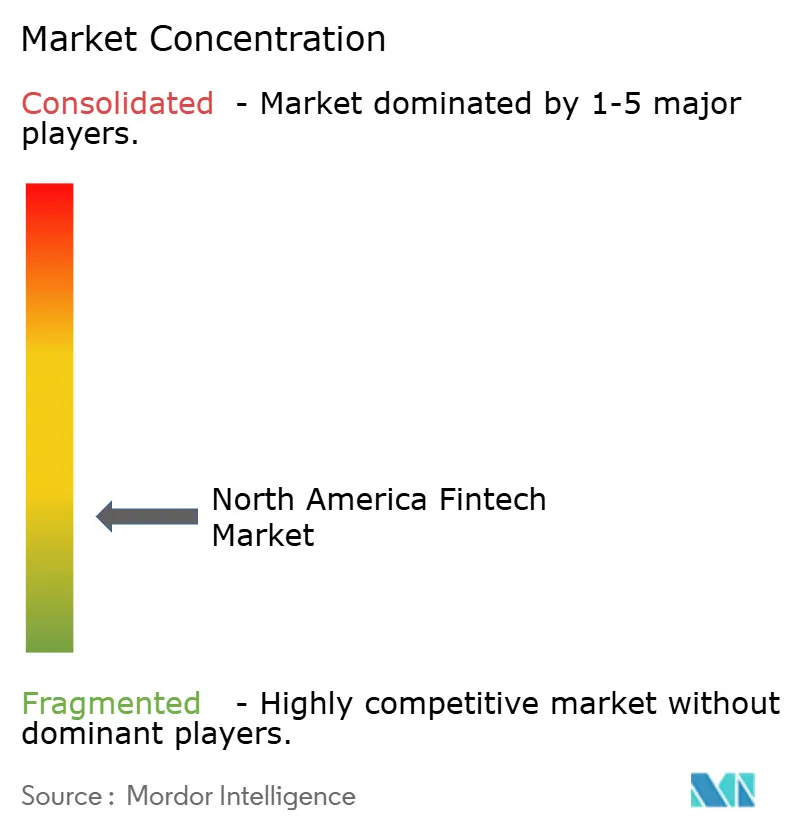
| Market Concentration | Low |
Major Players *Disclaimer: Major Players sorted in no particular order Image © Mordor Intelligence. Reuse requires attribution under CC BY 4.0. | |
North America Fintech Market Analysis by Mordor Intelligence
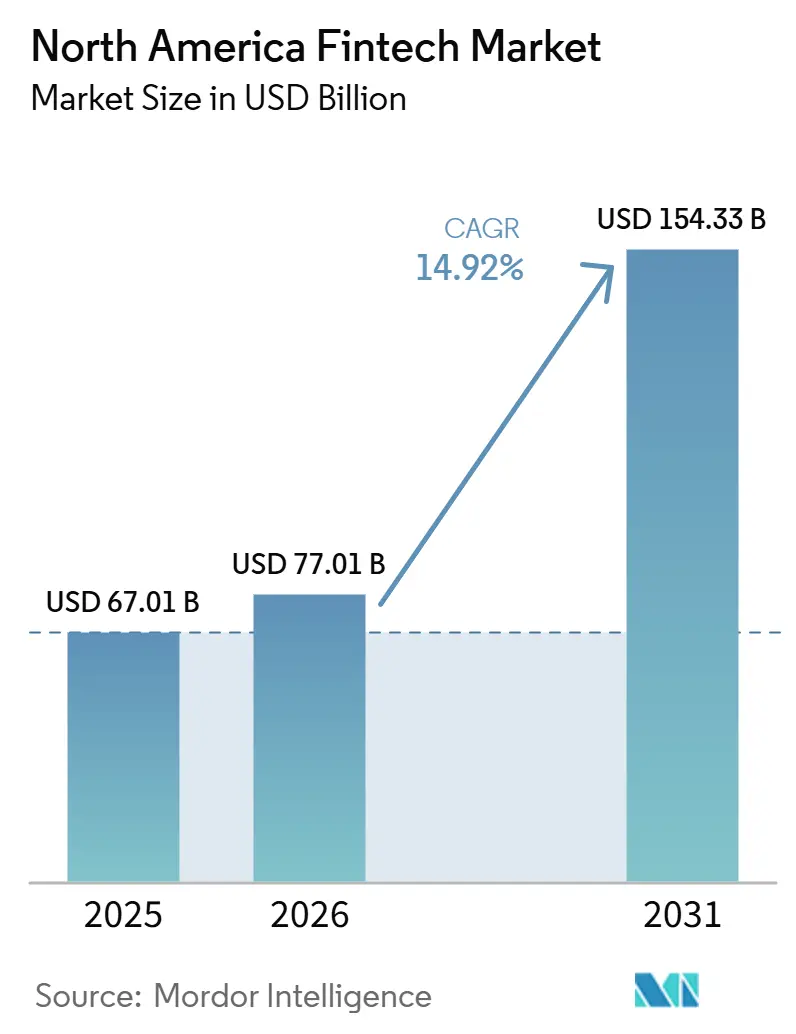
The North America Fintech Market size is projected to be USD 67.01 billion in 2025, USD 77.01 billion in 2026, and reach USD 154.33 billion by 2031, growing at a CAGR of 14.92% from 2026 to 2031.
Real-time payment rails, consolidation around regulatory compliance, and broad deployment of generative AI are simultaneously expanding addressable revenue pools and compressing cost structures. FedNow’s connection to more than 900 U.S. financial institutions has accelerated instant settlement adoption, while Consumer Financial Protection Bureau (CFPB) rulemaking is encouraging scale-driven mergers among nonbank operators able to amortize supervision costs. Digital wallets anchored to card funding remain the channel of choice for everyday payments, and neobanks are capturing a growing share of younger households by keeping customer acquisition costs below USD 25 per account. Small-business demand for software-embedded payments, gains in fraud-orchestration accuracy, and early pilots of tokenized deposits are further propelling the North America fintech market toward double-digit growth through the decade.
Key Report Takeaways
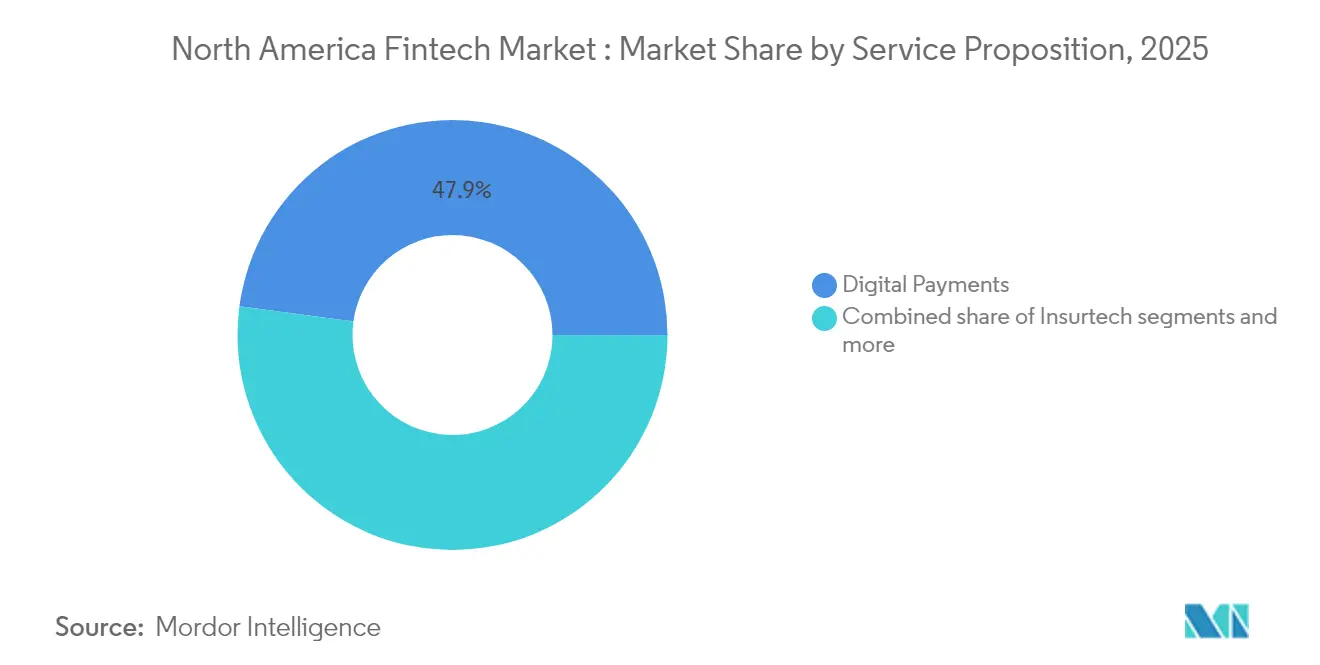
- By service proposition, digital payments captured 47.86% of the North America fintech market share in 2025, while neobanking is forecast to grow fastest at a CAGR of 21.95% between 2026 and 2031.
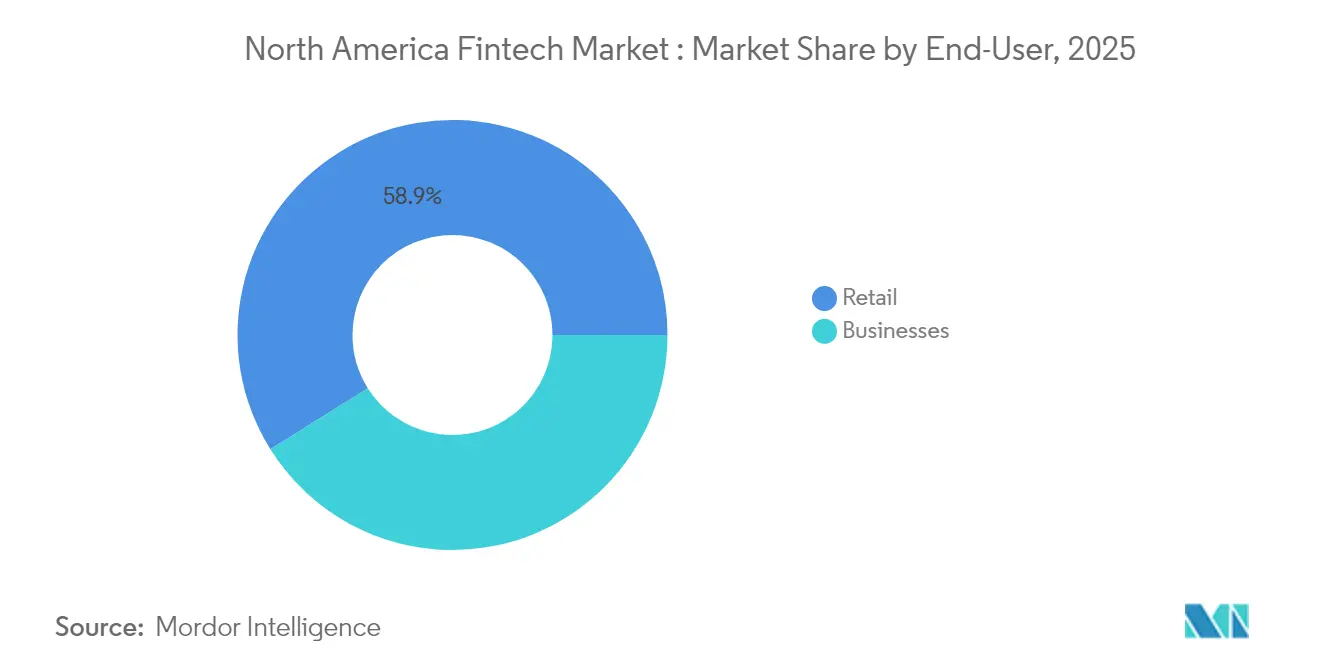
- By end-user, retail accounted for 58.92% of the North America fintech market share in 2025, with business users expected to expand at a growth rate of 17.74% CAGR during 2026–2031.
- By user interface, mobile apps represented 63.61% of the North America fintech market share in 2025, while POS/IoT devices are projected to rise at a 19.6% CAGR through 2031.
- By geography, the United States led with 72.05% of the North American fintech market share in 2025, while Mexico is anticipated to grow at the fastest rate of 16.9% CAGR from 2026 to 2031.
Note: Market size and forecast figures in this report are generated using Mordor Intelligence’s proprietary estimation framework, updated with the latest available data and insights as of 2026.
North America Fintech Market Trends and Insights
Drivers Impact Analysis*
| Driver | % Impact on CAGR Forecast | Geographic Relevance | Impact Timeline |
|---|---|---|---|
| P2P and card-funded digital-wallet dominance | +3.2% | United States, Canada | Medium term (2-4 years) |
| SME uptake of integrated POS/ISV suites | +2.8% | United States, Canada | Short term (≤ 2 years) |
| Bank–fintech BaaS/API partnerships | +2.5% | Region-wide | Medium term (2-4 years) |
| FedNow and other real-time rail monetization | +1.9% | United States, Canada | Long term (≥ 4 years) |
| AI-based fraud-orchestration savings | +2.1% | Region-wide | Short term (≤ 2 years) |
| Tokenized deposits and programmable money pilots | +1.4% | United States | Long term (≥ 4 years) |
| Source: Mordor Intelligence | |||


P2P and Card-Funded Digital-Wallet Dominance
Card-backed wallets such as Apple Pay, PayPal, and Cash App processed more than USD 1.7 trillion in combined volume during 2024, illustrating the scale advantage gained by remaining inside established card networks. Consumers continue to prefer wallets that keep existing credit lines intact, and Venmo’s quarterly throughput climbed 10% to USD 75.6 billion, reinforcing the stickiness of P2P ecosystems. FedNow’s request-to-pay functionality is expected to open complementary revenue streams for wallet providers that overlay value-added messaging and invoice services. At the same time, a January 2025 CFPB rule brings nonbank payment apps handling more than 50 million annual transactions under direct federal examination, raising the fixed-cost bar for smaller entrants.
SME Uptake of Integrated POS/ISV Suites
Small merchants are turning to software-embedded payments that consolidate ordering, loyalty, payroll, and lending. Toast derived 87% of its 2024 top line from payments, hardware, and ancillary financial services rather than license fees, revealing the monetization power of bundled offerings. Community banks acknowledge that losing the merchant cash-management relationship threatens low-cost core deposits, and several have begun white-labeling point-of-sale fintech products to defend share. Market observers expect the embedded-finance revenue pool to grow from USD 185 billion in 2024 to USD 228 billion in 2028, implying a North America fintech market expansion path that rewards vertically integrated players.
Bank–Fintech BaaS/API Partnerships
The Banking-as-a-Service revenue opportunity is moving from proofs of concept toward scaled production, with the regional BaaS market anticipated to reach USD 66 billion by 2030[1]Cole Gottlieb, “PayPal Partners With Fiserv; C&R Acquires SpringFour,” Cross River, crossriver.com. . Fintechs gain speed to market, while chartered institutions unlock fee income from excess compliance capacity. The 2024 failure of middleware provider Synapse exposed operational gaps and accelerated FDIC plans to require daily reconciliation of for-benefit-of accounts, putting a premium on robust data pipelines. PayPal’s program with Fiserv to embed “Fastlane” guest checkout inside bank merchant portals demonstrates how BaaS can extend distribution without direct consumer acquisition costs.
AI-Based Fraud-Orchestration Savings
Deploying machine learning across transaction monitoring has cut fraud write-offs by 50% for early adopters while trimming manual reviews 60%. The Federal Trade Commission tallied USD 8.8 billion in U.S. consumer scam losses in 2024, underscoring the addressable problem set[2]Federal Trade Commission, “Consumer Sentinel Network Data Book 2024,” ftc.gov.. PayPal reports that its AI models now score 1,000 transactions per second and save more than 1 million annual customer hours previously spent resolving false positives. The growing wage premium for GenAI engineers, however, could drag implementation timelines for smaller wallets and processors.
Restraints Impact Analysis*
| Restraint | (~) % Impact on CAGR Forecast | Geographic Relevance | Impact Timeline |
|---|---|---|---|
| Intensifying CFPB and state compliance costs | −2.3% | United States | Short term (≤ 2 years) |
| Rising cyber-insurance premiums post-ransomware | −1.8% | Region-wide | Medium term (2-4 years) |
| Cloud-compute price inflation | −1.5% | Global | Medium term (2-4 years) |
| Talent gap in GenAI and zero-trust security | −1.2% | U.S., Canada | Long term (≥ 4 years) |
| Source: Mordor Intelligence | |||
Intensifying CFPB and State Compliance Costs
Direct CFPB supervision now applies to about seven large nonbank payment providers, expanding examination scope to data privacy, fraud-refund timing, and account closures[3]Consumer Financial Protection Bureau, “Final Rule: Large Nonbank Payment Providers,” cfpb.gov. . California and New York regulators initiated 37% of fintech enforcement actions in 2024, collecting USD 30 million in consumer restitution. Although an April 2025 CFPB memo signals fewer federal sweeps, the requirement to publicly file all settlement orders under the nonbank registry rule raises reputational stakes for compliance lapses.
Rising Cyber-Insurance Premiums Post-Ransomware
Cyber insurance premiums surge following high-profile ransomware incidents affecting financial services, with 72% of companies exceeding cloud budgets and up to one-third of cloud spending wasted on unused resources. These cost pressures particularly impact API-heavy fintechs that rely on cloud infrastructure for scalability and real-time processing capabilities. Treasury and Financial Services Sector Coordinating Council resources for secure cloud adoption highlight regulatory focus on concentration risk in large cloud providers. FinOps implementations can reduce cloud spending by 20-30%, but require specialized expertise that competes with cybersecurity talent in tight labor markets. The cloud computing market's 16.8% CAGR through 2030 indicates continued cost inflation pressures that may force fintech consolidation or pricing adjustments to maintain unit economics.
*Our forecasts treat driver/restraint impacts as directional, not additive. The impact forecasts reflect baseline growth, mix effects, and variable interactions.
Segment Analysis
By Service Proposition: Digital Payments Continue to Dominate
Digital payments controlled 47.86% of the North America fintech market share in 2025, translating to roughly USD 32.1 billion in segment revenue. Card-funded wallets ride the installed card-network rails, providing instant scale and merchant acceptance. PayPal alone processed USD 1.7 trillion in total payment volume, while Cash App’s monthly active users surpassed 55 million. Digital lending gained ground as AI underwriting models cut approval times to under 10 seconds, and digital investment portals grew assets by waiving commissions.
Neobanking, although smaller today, is forecast to race ahead at a 21.95% CAGR and could command more than one-fifth of the North America fintech market by 2031. Chime’s eight-million-plus account base illustrates the low-cost viral growth economics; its customer acquisition cost averages USD 20, versus nearly USD 925 for traditional banks. Insurtech startups using telematics and behavioral data are shaving loss ratios for auto and home policies. Across propositions, incumbents are embedding financing, insurance, and wealth modules directly inside consumer wallets, expanding average revenue per user without raising switching friction.


By End-User: Retail Leads but Business Adoption Is Accelerating
Retail use accounted for 58.92% of the North America fintech market size in 2025, reflecting widespread wallet penetration among smartphone owners. Consumers gravitate toward fee-free checking, automated budgeting, and cash-back rewards that outclass legacy bank accounts. P2P volumes surpassed USD 400 billion in 2024 as Venmo, Zelle, and Cash App became default money-movement channels for younger demographics.
Business-oriented fintech services, however, are on track for the faster 17.74% CAGR through 2031. SMEs increasingly prefer all-in-one point-of-sale packages bundling inventory, payroll, and lending. Toast’s USD 1.1 billion of 2024 gross profit, 87% of which came from payments and hardware, shows how payments-led platforms are monetizing operational data. Spend-management providers such as Brex, Ramp, and Airbase are issuing physical and virtual cards that route real-time expense data back into ERP systems, reducing manual reconciliation costs by 60–70%. Compliance badges such as SOC 2 and ISO 27001 have become table stakes for vendors selling into mid-market and enterprise tiers.
By User Interface: Mobile Apps Hold the Lion’s Share
Mobile applications captured 63.61% of all front-end interactions in 2025, cementing smartphones as the primary gateway to financial services. Push-notification rails enable context-aware offers, and biometric logins have reduced abandoned sessions. PayPal reports that more than 70% of its transactions now originate on mobile screens.
POS and IoT devices are the fastest-rising interface category, set to expand at a 19.6% CAGR. Square’s evolution from dongles to full cloud-based registers underscores the shift toward hardware-software-payments convergence. Connected vending machines, parking meters, and mobility turnstiles are embedding NFC readers that authorize payments without phones or cards, creating ambient commerce. Browser-based portals remain vital for back-office workflows such as reconciliation, lending dashboards, and investment analysis, but their share of total user minutes is declining each year.
Geography Analysis
The North American fintech market remains anchored in the United States, which generated 72.05% of the 2025 transaction value on the back of mature banking infrastructure, deep venture funding, and regulatory clarity. FedNow has introduced instant settlement across all 50 states, and more than 900 institutions have connected to the service, positioning banks to monetize request-to-pay overlays. While CFPB oversight raises compliance outlays, it also standardizes rules of the road, lowering macro legal uncertainty for scaled players.
Canada contributes a modest but stable share, buoyed by open-banking consultations and strong capital-market pipelines. Fintech investment hit USD 9.5 billion in 2024 after high-profile deals involving Nuvei and Neo Financial. Cross-border e-commerce flows with the United States encourage product localization more than new regulatory approval, allowing Canadian providers to adapt U.S. codebases with limited rewrites.
Mexico is the breakout growth story, projected to deliver a 16.9% CAGR and lift its share of the North America fintech market beyond 10% by 2031. Internet penetration has reached 81.2%, and the country now hosts more than 1,000 active fintech firms serving 70 million users. Mercado Libre’s fintech arm grew its 2024 revenue by 37%, underscoring the headroom in payments and credit among underbanked populations. The Comisión Nacional Bancaria y de Valores continues to refine sandbox regimes that foster innovation while monitoring systemic risk.
Regulatory Landscape
In the United States, fintech oversight in payments and consumer finance is tightening around scale thresholds, and rulemaking is extending into newer rails. A January 2025 CFPB rule brought large nonbank payment providers (more than 50 million annual transactions) under direct federal examination, and the CFPB nonbank registry rule (finalized June 2024) increases disclosure obligations by requiring public reporting of covered enforcement orders. In May 2026, a White House executive order directed federal financial regulators to conduct a time-bound review of regulations and supervisory practices to streamline processes tied to fintech innovation, shaping how quickly platforms can pursue charters, licenses, and product approvals.
Digital assets and stablecoin-related activity are also moving further into formal prudential frameworks. In April 2026, the FDIC Board authorized a notice of proposed rulemaking to implement GENIUS Act requirements for FDIC-supervised permitted payment stablecoin issuers, covering reserve assets, redemption, and risk management. In Canada, consumer-driven banking (open banking) advanced in June 2026 when draft Consumer-Driven Banking Regulations were published for comment, establishing a framework overseen by the Bank of Canada for secure financial data sharing, which increases the emphasis on standardized consent, security, and liability models for API-based fintech distribution.
Value Chain Analysis
The North American fintech value chain begins with regulated data and money-movement incumbents, including banks, card networks, and payment processors, which provide accounts, underwriting capacity, and settlement access. From there, enablement layers such as core banking platforms, identity and fraud tools, cloud infrastructure, and API and data networks connect fintech applications to financial institutions. Distribution is increasingly mediated by mobile apps, wallets, and vertical SaaS platforms embedding payments and lending, while real-time rails in the United States, led by FedNow, add an extra layer for instant settlement and request-to-pay overlays. The 2024 failure of middleware provider Synapse highlighted operational dependencies in BaaS stacks and elevated expectations for reconciliation, data lineage, and for-benefit-of account controls.
On the capital-markets and wealth side, incumbents are integrating specialist fintech capabilities into core platforms rather than rebuilding end-to-end. State Street partnered with, and took a minority stake in, Apex Fintech Solutions (September 2025) to use digital custody and clearing capabilities, and BlackRock partnered with and made a minority investment in AccessFintech (November 2025) to improve post-trade connectivity between Aladdin and the Synergy Network. Cross-border commerce and logistics add another demand node for fintech through working-capital and payments modernization, with trade volatility and congestion on US-Mexico routes increasing the value of faster settlement, better reconciliation, and risk controls for B2B payment orchestration.
Competitive Landscape
The North American fintech market exhibits moderate concentration with the top five players commanding significant market share, indicating significant fragmentation and competitive intensity across multiple service categories. PayPal leads the market peer segment revenue share in Q1 2025, leveraging its USD 1.7 trillion annual payment volume and 400 million active accounts to maintain its market position despite intensifying competition. However, organic growth disruption increasingly drives market consolidation more than merger and acquisition activity, with digital-native providers like Stripe, Square, and Adyen collectively gaining significant market share between 2016-2021 through superior technology and customer experience rather than acquisitions[4]Joel Van Arsdale and Sameer Verma, “M&A No Longer the Key Driver of Consolidation in U.S. Merchant Payments,” Flagship Advisory Partners, flagshipadvisorypartners.com..
Strategic differentiation emerges through vertical specialization and integrated service offerings that create switching costs and customer stickiness. Toast's success in restaurant point-of-sale systems, generating 87% of gross revenues from payments and adjacent services rather than software subscriptions, exemplifies how vertical focus enables premium pricing and comprehensive customer relationships. Incumbent processors retain wholesale payment volume but lose merchant margin as integrated software vendors capture pricing power through bundled solutions that combine payments with business management tools. Banking-as-a-Service partnerships create new competitive dynamics as traditional banks monetize regulatory charters and infrastructure while fintechs focus on customer experience and product innovation, though recent operational failures like Synapse highlight execution risks in these arrangements.
White-space opportunities emerge in cross-border B2B payment orchestration for mid-market exporters and GenAI-driven hyper-personalized wealth management micro-pods that leverage artificial intelligence to provide customized investment advice and portfolio management services. The Federal Deposit Insurance Corporation's enhanced recordkeeping requirements for Banking-as-a-Service relationships create compliance frameworks that may consolidate the market toward established players with robust operational infrastructure while raising barriers for new entrants.
North America Fintech Industry Leaders
PayPal
Fiserv
Stripe
Block (Square & Cash App)
FIS
- *Disclaimer: Major Players sorted in no particular order

Market Opportunities and Future Outlook
Two high-visibility whitespace areas remain centered on cross-border B2B payment orchestration and tokenization-linked settlement modernization. Cross-border trade flows between the United States, Canada, and Mexico continue to expose frictions from fragmented invoicing, slow settlement, and liquidity timing in carrier-freight forwarder relationships, creating room for platforms that combine collections, FX, reconciliation, and credit decisioning inside logistics and vertical SaaS workflows. FedNow connectivity (900-plus U.S. financial institutions) provides a rail anchor for faster domestic legs, while Mexico's growth profile and expanding fintech firm base support localized collection and payout tools that fit regional compliance needs.
A second opportunity area focuses on regulated custody, tokenized deposits, and tokenized securities workflow integration, where traditional infrastructure providers are moving into production activity. DTCC processing of live production trades involving tokenized securities in July 2026 shows tokenized instruments being routed through established post-trade plumbing rather than staying confined to pilots, which expands integration and risk-management work for brokers, custodians, and fintech middleware. At the same time, chartering pathways for digital-asset-related services are becoming more concrete, including the OCC granting a national trust bank charter to Circle in July 2026 for digital asset custody under federal oversight, which raises competitive pressure for custody, compliance, and treasury-management stacks that can operate under bank-grade controls.
Recent Industry Developments
- July 2026: The OCC granted Circle a de novo national trust bank charter to establish Circle National Trust and operate digital asset custody under federal oversight. The approval advances a charter-based route for crypto-native firms to internalize regulated functions, increasing competitive pressure on custody, compliance, and treasury-management providers that support institutional flows.
- March 2025: PayPal unveiled its "PayPal 2.0" roadmap focused on AI-driven checkout optimization and a USD 50 billion debit-card TPV goal. The strategy reinforces the shift toward cost-to-serve reduction and conversion lift via AI, while using debit as a retention and funding lever across wallet and merchant ecosystems.
- September 2024: PayPal partnered with Fiserv to integrate Fastlane guest checkout, extending streamlined checkout to merchants served through Fiserv channels and enabling access to Venmo payment options. The tie-up strengthens bank-channel distribution for PayPal-branded checkout capabilities and supports deeper integration between traditional acquirers and wallet-led payment networks.


Research Methodology Framework and Report Scope
Market Definition and Coverage
For this report, the North America fintech market is defined as revenue generated from technology-led financial services delivered through digital channels, where the solution directly enables payments, lending, investing, insurance distribution, digital banking, or money management for end users in North America.
Scope exclusions: We exclude pure IT services, generic cloud hosting, and non-financial software that does not directly enable a financial transaction, account, or regulated financial product.
Segmentation Overview
- By Service Proposition
- Digital Payments
- Digital Lending & Financing
- Digital Investments
- Insurtech
- Neobanking
- By End-User
- Retail
- Businesses
- By User Interface
- Mobile Applications
- Web / Browser
- POS / IoT Devices
- By Geography
- Canada
- United States
- Mexico
Data Sources, Market Sizing, and Validation
Desk Research
We start with desk research to lock the market boundary and build the base layer of inputs that can be checked repeatedly. Public sources are used to understand payment and digital banking usage, supervised-entity coverage, and cross-border activity, such as central bank and regulator publications, consumer finance and payments statistics, and national statistics agencies in the US and Canada.
We also review materials that explain product adoption and monetization signals, such as filings and investor presentations from listed financial institutions and fintech platforms, plus reputable business press and association websites that discuss real-time payments, open banking style APIs, and digital identity. Patent databases help us confirm where product innovation is being concentrated, for example in fraud tools and onboarding flows. In addition, a paid subscription for company financials and intelligence is used to normalize reported revenue lines and reduce double counting across multi-product firms. The desk research sources mentioned here are illustrative, and many other public documents and datasets were also used for data collection, validation, and clarification.
Primary Interviews and Surveys
Primary work is used to pressure-test desk assumptions that are hard to observe directly, especially pricing logic, take rates, product bundles, and what revenue is counted as fintech versus adjacent bank tech. We spoke with executives, product leaders, risk and compliance teams, and channel partners across the US and Canada, plus additional North America coverage, so that adoption signals and monetization ranges could be validated from both the supply and buyer sides.
Distribution of primary research fieldwork respondents
| Company type | Respondent position |
|---|---|
| Top tier: 25% | CXOs: 14% |
| Mid tier: 61% | Functional/Unit leaders: 28% |
| Smaller Players: 14% | Managers: 58% |
Market-Sizing & Forecasting
Sizing is built using a mix of top-down and bottom-up checks, but the main spine is top-down and reconstructs the revenue pool by mapping fintech service activity in North America into monetizable value pools, and then applying realistic monetization ranges. Once that is in place, we corroborate the totals using selective bottom-up approximations, such as sampling vendor revenue disclosures, using channel checks on typical pricing, and applying simple ASP times volume logic for high-volume rails.
Inputs used in the model are picked because they can be explained and re-checked, including digital payment volumes and usage shifts, digital banking and wallet adoption, lending origination trends and credit risk tightening, investment account activity and fee pressure, and insurance distribution digitization. We also track regulatory and infrastructure signals that move the market faster or slower, for example real-time payment rail expansion and KYC and AML enforcement intensity, because these directly influence onboarding, fraud loss, and conversion rates.
For forecasting, scenario analysis is used, with a base case shaped by expert views on adoption speed, pricing progression, and loss rates, and then stress and upside cases are run for rate-sensitive lending and transaction-heavy payment revenue. Where bottom-up data is missing for smaller firms, we fill gaps by using peer-group ranges from interviews, and then we cap results using independent constraints like addressable customer pools and realistic take-rate bands.
Data Validation & Update Cycle
Validation happens in layers so that one data point cannot swing the outcome on its own. We compare the modeled totals against independent signals, such as reported revenue mixes in filings, public payments and banking usage series, and observed changes in credit quality and fraud loss discussions, and then any outliers are re-checked back to the assumptions that created them.
Before sign-off, a second analyst review is completed to test arithmetic, scope consistency, and year-over-year movement, and follow-up calls are triggered when a metric falls outside expected ranges. Reports are refreshed annually, with interim updates when material events occur, and a final pre-delivery review is done so clients receive the most current view available at the time.
Mordor Intelligence's North America Fintech Market Size Measured Against Other Published Estimates
Published market sizes for fintech in North America often do not match because different studies count different revenue lines, and some blend transaction value with market revenue. Differences also show up when one model treats neobanking and digital banking fees as fintech, but another only counts pure-play platforms.
Payment usage series, lending origination patterns, and fee take-rate ranges collected during validation are the checks that keep Mordor Intelligence aligned to revenue that is directly earned from fintech propositions in North America, rather than broader financial technology spend. Scope choices, such as whether to include bank core modernization work, how to treat crypto trading revenue, and how quickly pricing is assumed to normalize after rate changes, tend to create most of the spread.
Benchmark comparison
| Source | Market Size | Gaps in Research Methodology |
|---|---|---|
| Mordor Intelligence | USD 67.01 B (2025) | |
| Trade Journal A | USD 4.93 T (2023) | This figure is based on fintech transaction value, which is a flow metric, and it is not directly comparable to revenue-based market sizing used in this report. |
| Regional Consultancy B | USD 41.20 B (2024) | This estimate appears to use a narrower coverage of fintech revenue pools and can undercount diversified platforms by excluding adjacent fee streams like digital banking and embedded finance monetization. |
Looking at the three values together, the biggest driver is the unit being measured, since transaction value can be orders of magnitude larger than revenue. The second driver is boundary discipline, especially around digital banking style fees and embedded finance economics, which can change the total meaningfully even if growth rates look similar.


Key Questions Answered in the Report
How large is the North America fintech market in 2026?
It stands at USD 77.01 billion and is projected to reach USD 154.33 billion by 2031.
Which service proposition leads regional revenue?
Digital payments hold 47.86% of 2025 revenue and remain the core growth engine.
What is driving the rapid rise of neobanks?
Customer acquisition costs under USD 25 per account and mobile-first design fuel a 21.95% CAGR outlook.
Why are SMEs adopting integrated POS platforms?
Bundled software and payments cut operational complexity and unlock lending and analytics features.
How will FedNow influence the competitive landscape?
Instant settlement enables request-to-pay overlays that can lift non-interest income at banks and wallets alike.
Which geography is expected to grow fastest through 2031?
Mexico, with a 16.9% CAGR, driven by high internet penetration and an underbanked population.
Page last updated on:


 Your data is secure and never sold or shared.


