Market Overview
| Study Period | 2018 - 2031 |
|---|---|
| Base Year For Estimation | 2025 |
| Forecast Data Period | 2026 - 2031 |
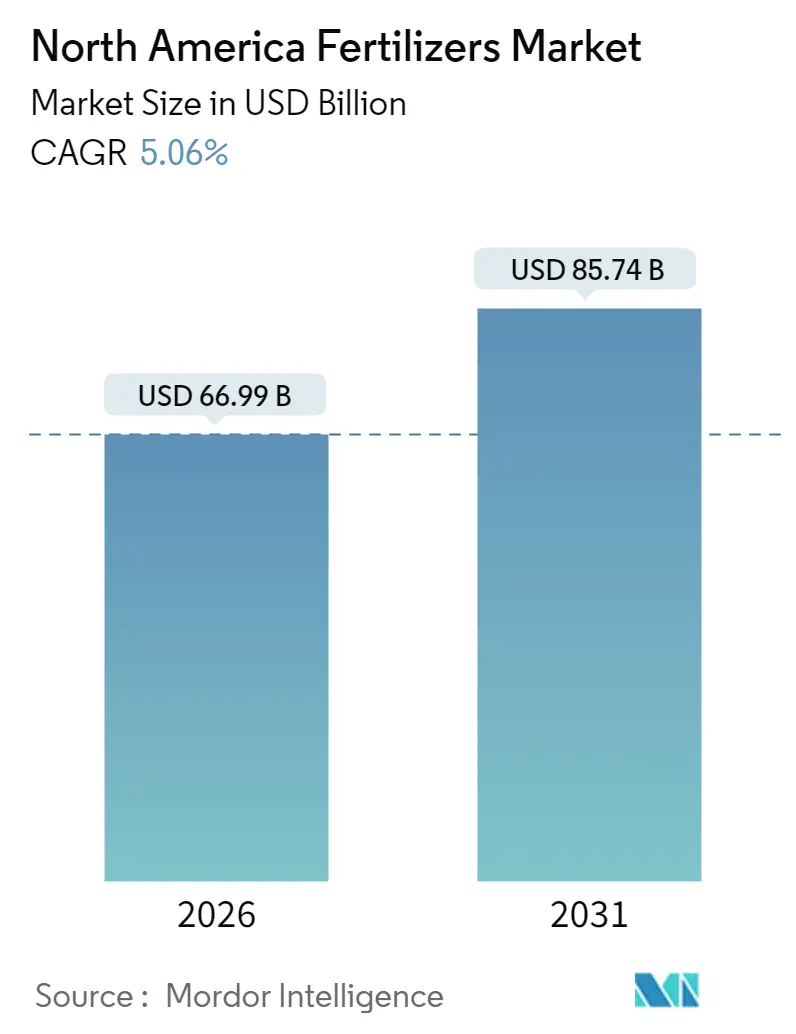
| Market Size (2026) | USD 66.99 Billion |
| Market Size (2031) | USD 85.74 Billion |
| Growth Rate (2026 - 2031) | 5.06% CAGR |
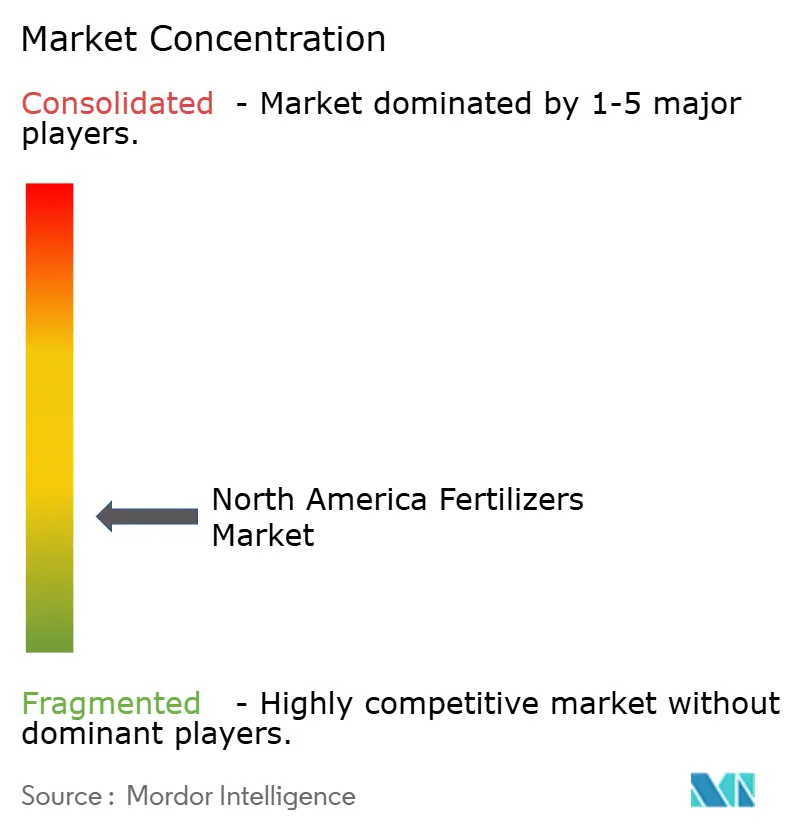
| Market Concentration | Low |
Major Players*Disclaimer: Major Players sorted in no particular order Image © Mordor Intelligence. Reuse requires attribution under CC BY 4.0. | |
North America Fertilizers Market Analysis by Mordor Intelligence
The North America fertilizers market is expected to grow from USD 63.76 billion in 2025 to USD 66.99 billion in 2026 and is forecast to reach USD 85.74 billion by 2031 at 5.06% CAGR over 2026-2031. Current momentum is driven by expanding corn and soybean acreage, domestic capacity additions that reduce import risk, and precision agriculture tools that push nutrient use efficiency across roughly 270 million cultivated acres[1]Source: USDA Economic Research Service, “Farm Sector Income Forecast,” ers.usda.gov . Producers also face tightening environmental rules that reward coated and controlled-release products, while government incentives for green ammonia encourage fresh capital investment in low-carbon production assets[2]Source: US Department of Energy, “Hydrogen Production Tax Credits,” energy.gov. Supply resilience has improved after the 2021–2022 transport disruptions. However, logistics upgrades and freight cost declines continue to support the standardization of products, keeping imported potash and phosphates cost-competitive. Competitive intensity remains fragmented because regional soil variability and crop diversity limit product standardization. This opens space for specialty blenders, agronomy service firms, and platform-based challengers that tailor solutions at the field level.
Key Report Takeaways
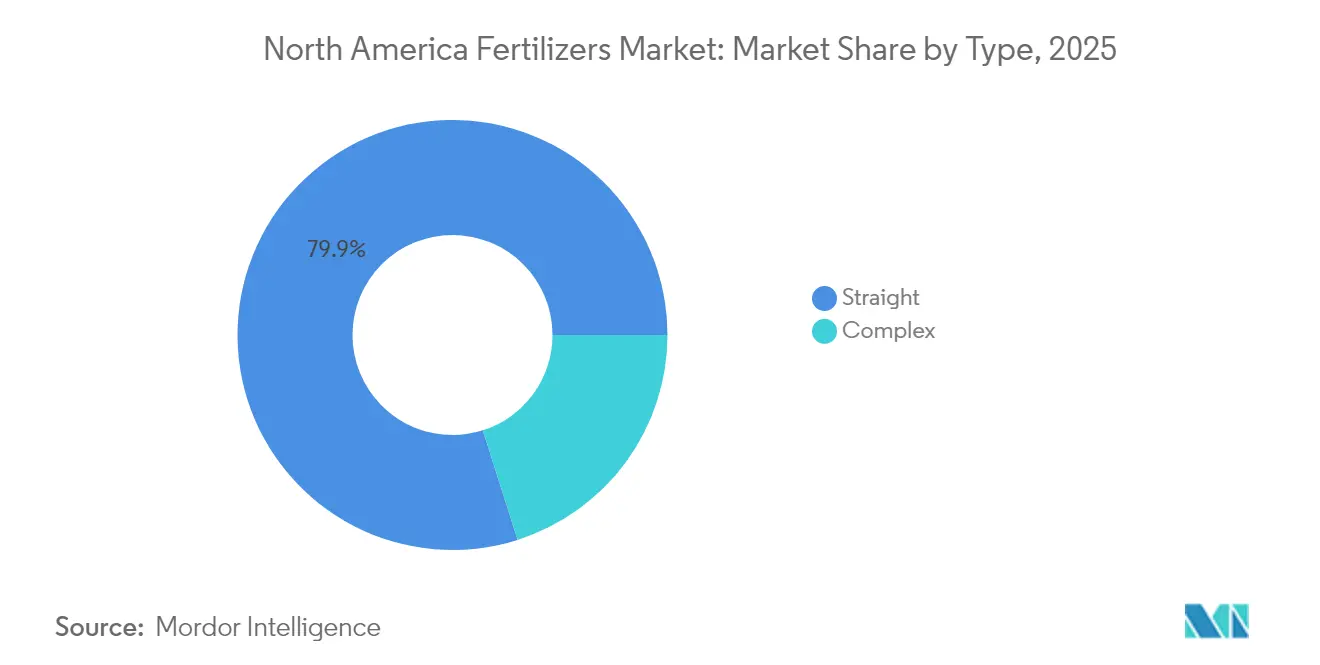
- By type, straight fertilizers led with 79.90% of the North America fertilizers market share in 2025, whereas complex products are projected to register the fastest 6.72% CAGR through 2031.
- By form, conventional fertilizers captured 82.60% revenue in 2025, while specialty fertilizers are on track for the highest 5.55% CAGR to 2031.
- By application mode, soil placement accounted for 83.60% of the North America fertilizers market size in 2025, whereas fertigation is expanding at a 5.62% CAGR.
- By crop type, field crops consumed 87.20% of nutrients in 2025, while horticultural crops are forecast to post a 6.18% CAGR through 2031.
- By geography, the United States dominated with a 46.70% share in 2025, while Canada is projected to have the fastest growth rate of 5.58% from 2026 to 2031.
Note: Market size and forecast figures in this report are generated using Mordor Intelligence’s proprietary estimation framework, updated with the latest available data and insights as of January 2026.
North America Fertilizers Market Trends and Insights
Drivers Impact Analysis
| Driver | (~) % Impact on CAGR Forecast | Geographic Relevance | Impact Timeline |
|---|---|---|---|
| Expansion of United States corn and soybean acreage | +0.9% | Midwest states and Ontario | Medium term (2–4 years) |
| Shift toward specialty fertilizers for high-value crops | +0.7% | California, Florida, Pacific Northwest | Short term (≤ 2 years) |
| Federal and state incentives for green ammonia plants | +0.6% | Gulf Coast and Quebec | Long term (≥ 4 years) |
| Biofuel blending mandates that boost nitrogen demand | +0.5% | Corn Belt and Prairie Provinces | Medium term (2–4 years) |
| Regenerative farming that lifts micronutrient use | +0.4% | Great Plains and Canadian Prairies | Long term (≥ 4 years) |
| Controlled environment farming that relies on water-soluble NPK | +0.3% | Urban hubs and greenhouse clusters | Short term (≤ 2 years) |
| Source: Mordor Intelligence | |||
Expansion of United States corn-and-soy acreage
Corn and soybean plantings are anticipated to reach 96.2 million acres by 2026. Each extra million acres calls for about 180,000 metric tons of nitrogen fertilizer[3]Source: United States Natural Resources Conservation Service, “Comprehensive Nutrient Management Plans,” nrcs.usda.gov. Growth is tied to renewable fuel standards and steady export sales. Although new hybrids use nitrogen more efficiently, the larger footprint keeps total consumption on an upward path. Most new acres sit in Iowa, Illinois, and Nebraska, where pipeline networks carry low-cost ammonia. When corn follows corn, fields need heavier nitrogen programs, which secures demand for the rest of the decade.
Shift toward specialty fertilizers for high-value crops
Fruit, nut, and vegetable growers in California’s Central Valley have already adopted specialty products on roughly 2.8 million acres[4]Source: California Department of Food and Agriculture, “Agricultural Statistics Review,” cdfa.ca.gov. Controlled-release granules cut labor and deliver steady nutrition that protects fruit size, color, and shelf life. Water-soluble lines work with fertigation systems that fine-tune feeding in avocado and citrus orchards. Organic premiums help offset the higher price of these inputs, which often run 40 to 60% above standard grades. Florida citrus growers employ the same strategy to fight disease pressure with intensive micronutrient programs.
Federal and state incentives for green-ammonia plants
Federal tax credits worth as much as USD 3 per kilogram for clean hydrogen ammonia have changed the math for new projects. CF Industries has earmarked USD 200 million for carbon capture at its Donaldsonville site, aiming to sequester 2 million metric tons of CO₂ each year by 2027. Long-term offtake deals with farm cooperatives give investors confidence, and Quebec’s low-cost hydro power positions Canada as a future export base. The buildout will unfold gradually through 2030, but the direction is set.
Biofuel blending mandates boosting nitrogen demand
Renewable fuel rules that call for 5.68 liters of corn ethanol every year lift nitrogen demand because a bushel of corn needs about 0.5 kg of the nutrient. Ethanol plants cluster in Iowa, Nebraska, and Illinois, creating a regional pull for fertilizer distributors. Rising petroleum prices make ethanol margins more attractive, which in turn encourages more acres and heavier application rates. Cellulosic crops that qualify for advanced biofuel credits require their own tailored fertilizer plans, further widening the market.
Restraints Impact Analysis
| Restraint | (~) % Impact on CAGR Forecast | Geographic Relevance | Impact Timeline |
|---|---|---|---|
| Volatile natural-gas prices are inflating nitrogen costs | -0.5% | Gulf Coast and Alberta | Short term (≤ 2 years) |
| Stricter regulations on phosphate runoff in the Great Lakes basin | -0.4% | States and provinces around the Great Lakes | Medium term (2–4 years) |
| On-farm manure nutrient recycling curbing synthetic demand | -0.3% | Regions with dense livestock populations | Long term (≥ 4 years) |
| Potash logistics bottlenecks via St. Lawrence Seaway | -0.2% | Eastern United States and Maritime Canada | Short term (≤ 2 years) |
| Source: Mordor Intelligence | |||
Volatile natural-gas prices are inflating nitrogen costs
Ammonia production uses roughly 28 to 30 MMBtu of natural gas for every metric ton, so fertilizer costs rise and fall with Henry Hub futures that peaked at USD 9.50 per MMBtu during the 2024 winter heating season. Seasonal demand surges and pipeline constraints amplify the volatility. Manufacturers hedge fuel costs where possible, yet farmers still see higher prices in spring when usage spikes.
Stricter regulations on phosphate runoff in the Great Lakes basin
Anaerobic digesters and separation systems now recover 60-70% of nutrients from livestock waste. In Iowa, North Carolina, and Wisconsin, many growers spread this recycled material with variable-rate rigs that match crop needs, acre by acre. The practice reduces purchases of commercial phosphorus and potassium, slowing sales growth in counties with a high animal population.
Segment Analysis
By Type: Straight Fertilizers Dominate Volume Applications
Straight fertilizers accounted for 79.90% of North America fertilizers market share in 2025, a figure indicating that large-scale grain growers continue to rely on single nutrient products for dependable, low-cost coverage. Nitrogen grades dominate this group because the acres of corn and wheat across the Great Plains and Midwest drive steady demand. Complex blends, which combine several nutrients into one prill, post the fastest 6.72% CAGR through 2031, as specialty-crop growers favor balanced mixes that reduce application passes and lower labor costs.
Potassic grades match that 6.72% pace owing to Canada’s potash mines and a wider appreciation of potassium’s role in drought defense and quality gains. Coated versions of all three fertilizer types are gaining popularity rapidly because polymer and sulfur layers help curb nutrient losses and enable farms to meet water quality regulations. Precision soil tests flag growing gaps in zinc, manganese, and boron, so micronutrient add-ons within straight formulations are becoming more common. Variable rate rigs then drop the right product in the right zone, a shift that reflects an era when higher yields demand far more targeted nutrition than the old “blanket” NPK approach.
Note: Segment shares of all individual segments available upon report purchase
Get Detailed Market Forecasts at the Most Granular Levels
Download PDF
By Form: Specialty Formulations Command Premium Markets
Conventional fertilizer accounted for 82.60% of revenue in 2025, as cost conscious grain producers stick with proven workhorses. The specialty fertilizer segment, is pacing the field with an 5.55% CAGR, driven by water-quality mandates and rising labor costs that favor single shot programs over multiple trips. Growers in high value fruit, nut, and vegetable sectors willingly pay premiums when slow-release coatings boost nutrient use efficiency and protect product quality.
Liquids also gain ground because they flow through injection equipment that lets operators tweak rates on the fly. Building those coatings requires significant capital and expertise, which shields established manufacturers from quick copycats. Most research now focuses on developing tougher shells and steadier release curves, ensuring that nutrient supply matches crop demand on a daily basis.
By Application Mode: Soil Applications Maintain Dominance
Soil placement methods maintained an 83.60% share of the North America fertilizers market size in 2025, supported by a fleet of spreaders and toolbars that can cover thousands of acres each spring. Even so, fertigation logs the strongest 5.62% CAGR because drip and pivot systems in water-stressed zones meter nutrients more precisely and slash runoff. Environmental labels and carbon programs also encourage farms to focus on pinpoint delivery rather than wide area broadcasts. Equipment firms now sell combo rigs that seed, fertilize, and apply crop protection in a single pass, reducing fuel use and soil compaction. Foliar sprays remain a niche tool for addressing quick micronutrient deficiencies when tissue samples reveal a deficiency mid-season. Paired with GPS and prescription maps, variable-rate tech fine-tunes soil applications, cutting waste and stacking yield gains.
A second wave of investment is now targeting sensor-guided applicators that read real-time chlorophyll or soil moisture data and adjust nutrient flows on the move, thereby shrinking the gap between agronomic prescriptions and in-field execution. Custom-application firms bundle these tools with drone imagery to verify compliance with watershed rules, giving growers proof points that can earn sustainability premiums from grain buyers and food companies.
By Crop Type: Field Crops Drive Volume Demand
Field crops accounted for 87.20% of all fertilizers in 2025, reflecting the significant footprint of corn and soybeans across North America. Horticulture is anticipated to growt at 6.18% CAGR as consumer demand for fresh produce, urban farming, and export deals fuels the expansion of acres dedicated to berries, tree nuts, and greenhouse grown greens. These crops require precise nutrition to meet size, color, and shelf-life specifications, so growers invest in tailored mixes rich in micronutrients and slow-release nitrogen. Controlled-release prills are favored because they feed plants steadily over long harvest windows. Custom programs tailored to each growth stage help packhouses and retailers maintain consistent quality, transforming fertilizer from a commodity cost into a value-adding tool.
Specialty crop operators are also showing a growing demand for enhance soil health to meet retailer-driven sustainability metrics. Year round greenhouse tomato and cucumber farms blend water-soluble NPK with calcium, magnesium, and trace elements in closed loop systems that recycle drainage water, reducing waste and improving nutrient balance. Such practices deepen demand for premium inputs while carving out differentiated revenue streams for suppliers able to service these high-touch programs.

Note: Segment shares of all individual segments available upon report purchase
Get Detailed Market Forecasts at the Most Granular Levels
Download PDF
Geography Analysis
The United States accounted for a 46.70% share of the North American fertilizers market in 2025, serving 270 million acres of harvested cropland that spanned various soil types and climate zones. Corn Belt states, such as Iowa, Illinois, Indiana, and Nebraska, benefit from dense ammonia pipelines and bulk terminal networks, which keep delivered costs low. The USD 500 million Fertilizer Production Expansion Program enhances supply security by supporting new domestic capacity, a move that reduces reliance on imports revealed during the 2021–2022 disruption period. California’s fruit and vegetable sector amplifies premium demand for water-soluble and controlled-release formulations that protect the USD 50 billion farm-gate value of specialty crops.
Canada represents the fastest-growing market, with a 5.58% CAGR, signaling upside tied to Prairie farm expansion and new green-ammonia ventures powered by abundant hydroelectricity. Canola and wheat rotations on 160 million acres lift call for sulfur-rich blends that match shorter growing seasons and colder soils. Rail links from Saskatchewan mines funnel potash into both domestic and United States spring runs, while Atlantic ports handle offshore imports that top up eastern demand. These logistics strengths, combined with sustainability certification goals, push per-acre application rates above historical norms, expanding the North American fertilizers market for Canadian suppliers.
Mexico held a prominent share of regional consumption in 2025 and is projected to track a significant CAGR through 2031 as modernization increases fertilizer use across 27 million hectares of cropland. The United States-Mexico-Canada Agreement (USMCA) trade rules lower tariffs and ease technology transfers that upgrade blending plants and agronomy services in Sinaloa, Sonora, and Jalisco. Balanced NPK and micronutrient formulas are gaining wider adoption as growers seek to capture export premiums for avocados, berries, and vegetables. Peso volatility raises costs for imported inputs, so distributors expand their local mixing capacity to hedge against currency swings.
Competitive Landscape
Market concentration remains fragmented, as the top five companies collectively hold 35.63% of regional revenue. CF Industries Holdings, Inc. holds a prominent share through its vertically integrated ammonia assets and dedicated pipeline links, which provide it with a freight advantage in the Gulf and Midwest. Nutrien Ltd. holds a significant share by combining potash mining in Saskatchewan with the largest farm retail network on the continent, enabling the firm to bundle products, agronomy services, and financing under one roof. The Mosaic Company controls a significant share of sales due to its captive phosphate rock, acid, and granulation capacity in Florida, which reduces exposure to imported rock. Yara International ASA, Koch Fertilizer LLC, and OCI Nitrogen round out the second tier with focused bets on enhanced efficiency coatings, low carbon ammonia, and import terminals that extend geographic reach without the capital intensity of new greenfield complexes.
Industry strategy centers on vertical integration and technology acquisition. CF Industries Holdings, Inc., set the tone by allocating USD 200 million to carbon capture at Donaldsonville, aiming to sequester 2 million metric tons of CO₂ each year by 2027 and secure premium pricing for low carbon nitrogen. Nutrien strengthened its data footprint through the USD 85 million purchase of Waypoint Analytical, adding 15 soil labs that feed prescription algorithms for 500 retail outlets. The Mosaic Company is investing USD 150 million to expand a Florida phosphate mine, which will add 500,000 metric tons of capacity and reduce its reliance on Moroccan rock imports. Koch Fertilizer LLC invested USD 75 million in an Iowa coating facility that doubles controlled release output for markets facing nutrient loss regulations.
Digital farming platforms are becoming a key battlefield. Major suppliers now embed variable rate maps, drone imagery, and weather linked advisories into product bundles so growers can verify return on investment and document stewardship metrics. Regional independents counter by leveraging deep local soil knowledge and rapid service, often partnering with equipment dealers that can apply customized blends within narrow spring windows. Start ups focused on carbon credit verification, and sensor driven fertigation are attracting venture capital and may become acquisition targets as incumbents seek new growth lanes. Collectively, these moves signal a market that favors firms able to marry physical product scale with data, sustainability credentials, and last-mile agronomy support.
North America Fertilizers Industry Leaders
CF Industries Holdings, Inc.
Nutrien Ltd.
The Andersons Inc.
The Mosaic Company
Yara International ASA
- *Disclaimer: Major Players sorted in no particular order
Need More Details on Market Players and Competitors?
Download PDF
Recent Industry Developments
- October 2024: CF Industries Holdings, Inc. invested USD 200 million to add carbon capture at the Donaldsonville complex, targeting 2 million metric tons of CO₂ sequestration annually by 2027. This move enlarges the regional pool of certified low-carbon nitrogen, allowing the company to command sustainability premiums while helping growers meet emerging scope-three emission targets.
- September 2024: Nutrien Ltd., acquired Waypoint Analytical for USD 85 million, adding fifteen soil labs that bolster precision recommendations. The expanded diagnostics network fuels demand for variable-rate and specialty blends, accelerating the shift toward data-driven fertilizer prescriptions across North America.
- August 2024: The Mosaic Company kicked off a USD 150 million phosphate mine expansion in Florida, adding 500,000 metric tons of annual capacity. By increasing domestic phosphate supply, the project cushions the market against import disruptions and steadies pricing for growers through the remainder of the decade.
North America Fertilizers Market Report Scope
Fertilizers are substances added to soil or plants to provide essential nutrients that promote growth and increase crop yield. The North America fertilizers market report is segmented by type, including complex and straight; by form, including conventional and specialty; by application mode, including soil, foliar, and fertigation; by crop type, including field crops, horticultural crops, turf and ornamental; and by geography, including the United States, Canada, Mexico, and rest of North America. The market forecasts are provided in terms of value (USD) and volume (metric tons).
Type
| Complex | ||
| Straight | Micronutrients | Zinc |
| Manganese | ||
| Copper | ||
| Iron | ||
| Boron | ||
| Molybdenum | ||
| Other Micronutrient | ||
| Nitrogenous | Urea | |
| Ammonium Nitrate | ||
| Anhydrous Ammonia | ||
| Other Nitrogenous | ||
| Phosphatic | Monoammonium Phosphate (MAP) | |
| Diammonium Phosphate (DAP) | ||
| Single Super Phosphate (SSP) | ||
| Triple Super Phosphate (TSP) | ||
| Other Phosphatic | ||
| Potassic | Muriate of Potash (MoP) | |
| Sulfate of Potash (SoP) | ||
| Other Potassic | ||
| Secondary Macronutrients | Calcium | |
| Magnesium | ||
| Sulfur | ||
By Form
| Conventional | |
| Specialty | Controlled Release Fertilizer (CRF) |
| Slow Release Fertilizer (SRF) | |
| Liquid Fertilizers | |
| Water-Soluble |
By Application Mode
| Soil |
| Foliar |
| Fertigation |
By Crop Type
| Field Crops |
| Horticultural Crops |
| Turf and Ornamental |
By Country
| United States |
| Canada |
| Mexico |
| Rest of North America |
| Type | Complex | ||
| Straight | Micronutrients | Zinc | |
| Manganese | |||
| Copper | |||
| Iron | |||
| Boron | |||
| Molybdenum | |||
| Other Micronutrient | |||
| Nitrogenous | Urea | ||
| Ammonium Nitrate | |||
| Anhydrous Ammonia | |||
| Other Nitrogenous | |||
| Phosphatic | Monoammonium Phosphate (MAP) | ||
| Diammonium Phosphate (DAP) | |||
| Single Super Phosphate (SSP) | |||
| Triple Super Phosphate (TSP) | |||
| Other Phosphatic | |||
| Potassic | Muriate of Potash (MoP) | ||
| Sulfate of Potash (SoP) | |||
| Other Potassic | |||
| Secondary Macronutrients | Calcium | ||
| Magnesium | |||
| Sulfur | |||
| By Form | Conventional | ||
| Specialty | Controlled Release Fertilizer (CRF) | ||
| Slow Release Fertilizer (SRF) | |||
| Liquid Fertilizers | |||
| Water-Soluble | |||
| By Application Mode | Soil | ||
| Foliar | |||
| Fertigation | |||
| By Crop Type | Field Crops | ||
| Horticultural Crops | |||
| Turf and Ornamental | |||
| By Country | United States | ||
| Canada | |||
| Mexico | |||
| Rest of North America | |||
Need A Different Region or Segment?
Customize Now
Market Definition
- MARKET ESTIMATION LEVEL - Market Estimations for various types of fertilizers has been done at the product-level and not at the nutrient-level.
- NUTRIENT TYPES COVERED - Primary Nutrients: N, P and K, Secondary Macronutrients: Ca, Mg and S, Micronutients: Zn, Mn, Cu, Fe, Mo, B, and Others
- AVERAGE NUTRIENT APPLICATION RATE - This refers to the average volume of nutrient consumed per hectare of farmland in each country.
- CROP TYPES COVERED - Field Crops: Cereals, Pulses, Oilseeds, and Fiber Crops Horticulture: Fruits, Vegetables, Plantation Crops and Spices, Turf Grass and Ornamentals
| Keyword | Definition |
|---|---|
| Fertilizer | Chemical substance applied to crops to ensure nutritional requirements, available in various forms such as granules, powders, liquid, water soluble, etc. |
| Specialty Fertilizer | Used for enhanced efficiency and nutrient availability applied through soil, foliar, and fertigation. Includes CRF, SRF, liquid fertilizer, and water soluble fertilizers. |
| Controlled-Release Fertilizers (CRF) | Coated with materials such as polymer, polymer-sulfur, and other materials such as resins to ensure nutrient availability to the crop for its entire life cycle. |
| Slow-Release Fertilizers (SRF) | Coated with materials such as sulfur, neem, etc., to ensure nutrient availability to the crop for a longer period. |
| Foliar Fertilizers | Consist of both liquid and water soluble fertilizers applied through foliar application. |
| Water-Soluble Fertilizers | Available in various forms including liquid, powder, etc., used in foliar and fertigation mode of fertilizer application. |
| Fertigation | Fertilizers applied through different irrigation systems such as drip irrigation, micro irrigation, sprinkler irrigation, etc. |
| Anhydrous Ammonia | Used as fertilizer, directly injected into the soil, available in gaseous liquid form. |
| Single Super Phosphate (SSP) | Phosphorus fertilizer containing only phosphorus which has lesser than or equal to 35%. |
| Triple Super Phosphate (TSP) | Phosphorus fertilizer containing only phosphorus greater than 35%. |
| Enhanced Efficiency Fertilizers | Fertilizers coated or treated with additional layers of various ingredients to make it more efficient compared to other fertilizers. |
| Conventional Fertilizer | Fertilizers applied to crops through traditional methods including broadcasting, row placement, ploughing soil placement, etc. |
| Chelated Micronutrients | Micronutrient fertilizers coated with chelating agents such as EDTA, EDDHA, DTPA, HEDTA, etc. |
| Liquid Fertilizers | Available in liquid form, majorly used for application of fertilizers to crops through foliar and fertigation. |
Need More Details on Market Definition?
Ask a Question
Research Methodology
Mordor Intelligence follows a four-step methodology in all our reports.
- Step-1: IDENTIFY KEY VARIABLES: In order to build a robust forecasting methodology, the variables and factors identified in Step-1 are tested against available historical market numbers. Through an iterative process, the variables required for market forecast are set and the model is built on the basis of these variables.
- Step-2: Build a Market Model: Market-size estimations for the forecast years are in nominal terms. Inflation is not a part of the pricing, and the average selling price (ASP) is kept constant throughout the forecast period for each country.
- Step-3: Validate and Finalize: In this important step, all market numbers, variables and analyst calls are validated through an extensive network of primary research experts from the market studied. The respondents are selected across levels and functions to generate a holistic picture of the market studied.
- Step-4: Research Outputs: Syndicated Reports, Custom Consulting Assignments, Databases & Subscription Platforms

Get More Details On Research Methodology
Download PDF


