
Market Overview
| Study Period | 2021 - 2031 |
|---|---|
| Forecast Data Period | 2026 - 2031 |
| Base Year Market Size (2025) | USD 0.90 Trillion |
| Market Size (2026) | USD 0.94 Trillion |
| Market Size (2031) | USD 1.19 Trillion |
| Growth Rate (2026 - 2031) | 4.78% CAGR |
| Market Concentration | Medium |
Major Players
*Disclaimer: Major Players sorted in no particular order Image © Mordor Intelligence. Reuse requires attribution under CC BY 4.0. |
|
North America Fashion Accessories Market Analysis by Mordor Intelligence
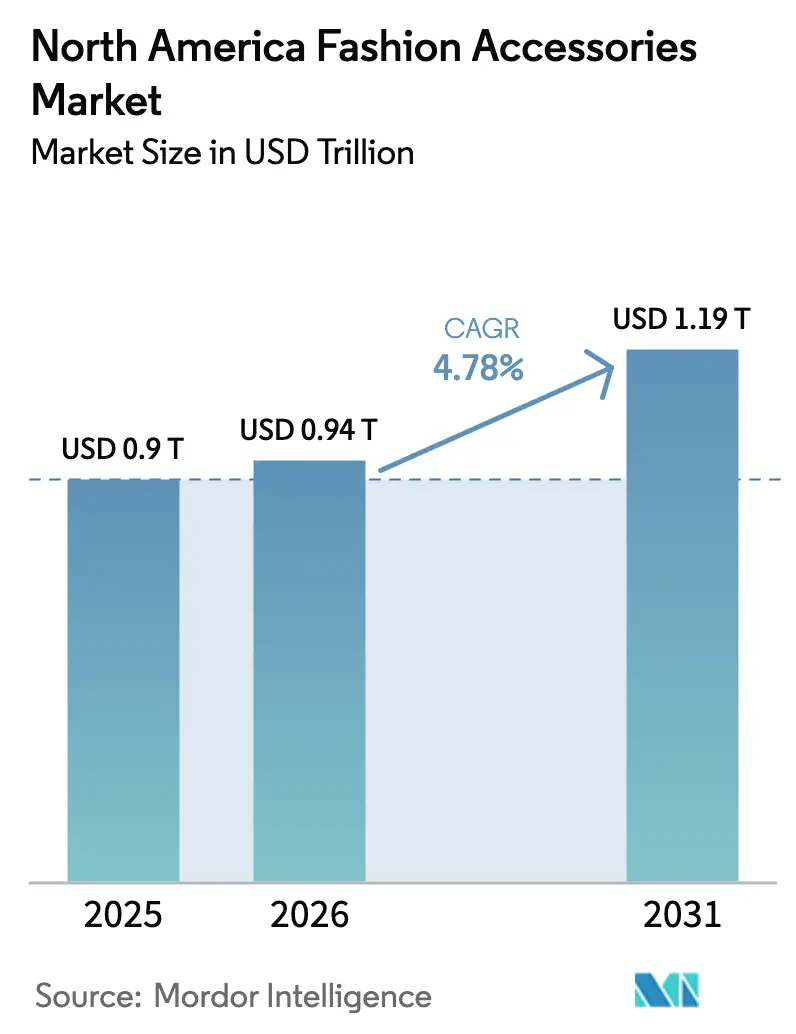
North American fashion accessories market size in 2026 is estimated at USD 0.94 trillion, growing from 2025 value of USD 0.90 trillion with 2031 projections showing USD 1.19 trillion, growing at 4.78% CAGR over 2026-2031. The current expansion is powered by digital-first retail formats, rising eco-awareness, and social-media-led trend cycles that reward brands able to blend functionality with prestige. Consumers have tightened discretionary budgets, yet they still trade up for accessories that communicate status or add meaningful utility, illustrating the market’s ability to absorb macro volatility. Apparel add-ons such as belts, scarves, and hats remain wardrobe staples, whereas watches are enjoying a renaissance owing to luxury horology and smart-wearable convergence. Additionally, Mexico’s urban middle class is lifting regional growth momentum, while the United States continues to anchor volumes and brand innovation. A steady pivot toward omnichannel experiences and traceable supply chains keeps reshaping competitive strategy across the North American fashion accessories market
Key Report Takeaways
- By product category, apparel accessories led with 57.10% revenue share in 2025; watches are projected to expand at a 5.05% CAGR through 2031.
- By end user, women captured 54.30% of the North American fashion accessories market share in 2025, while the children’s segment records the fastest 5.31% CAGR.
- By category, the mass tier captured 65.00% share of the North American fashion accessories market size in 2025, while the premium tier is forecast to grow 5.73% annually to 2031.
- By distribution channel, offline retail controlled 68.10% share in 2025; online sales are rising at a 6.02% CAGR and are set to reshape customer acquisition economics.
- By geography, the United States commanded 81.10% of 2025 revenue, whereas Mexico is advancing at a 6.32% CAGR through 2031.
Note: Market size and forecast figures in this report are generated using Mordor Intelligence’s proprietary estimation framework, updated with the latest available data and insights as of 2026.
North America Fashion Accessories Market Trends and Insights
Drivers Impact Analysis*
| Driver | (~) % Impact on CAGR Forecast | Geographic Relevance | Impact Timeline |
|---|---|---|---|
| Consumers' inclination towards luxury and status symbols | +1.2% | United States and Canada, with spillover to Mexico urban centers | Medium term (2-4 years) |
| Technological advancements in terms of design and raw material | +0.8% | North America, with early adoption in regional tech hubs | Long term (≥ 4 years) |
| Influence of social media and celebrity endorsements | +1.1% | North America core, particularly among Gen Z and Millennial demographics | Short term (≤ 2 years) |
| Sustainability and eco-conscious consumer demand | +0.7% | United States and Canada primarily, emerging in Mexico | Medium term (2-4 years) |
| Rising demand for sportswear from fitness-conscious consumers | +0.9% | North America, with strongest growth in United States | Short term (≤ 2 years) |
| Seasonal spikes and the influence of gift-giving culture | +0.6% | North America, with peak impact during Q4 holiday seasons | Short term (≤ 2 years) |
| Source: Mordor Intelligence | |||
Consumers' Inclination Towards Luxury and Status Symbols
Consumer appetite for luxury fashion accessories remains robust in the region. This trend is fueled by rising disposable incomes, urbanization, and the growing influence of social media platforms that promote luxury lifestyles. The U.S. Census Bureau highlights that the median household income in the United States reached approximately USD 80,610 in 2023, indicating a robust consumer base for luxury goods [1]Source: United States Census Bureau, "Income in the United States: 2023", census.gov . Furthermore, the growing millennial and Gen Z population, who are more inclined toward branded and high-end products, is significantly contributing to this trend. This demographic shift creates opportunities for brands that authentically connect with diverse consumer identities while maintaining luxury positioning. The polarization between high-net-worth individuals and middle-income consumers drives market segmentation, with ultra-high net worth individuals stabilizing premium segments while mass market consumers seek value-driven luxury alternatives.
Technological Advancements in Terms of Design and Raw Material
Fashion accessory innovation is increasingly focusing on smart functionality and sustainable materials, leading to the emergence of new product categories that merge traditional craftsmanship with modern technology. Notable advancements include the introduction of photochromic fiber displays, which allow for interactive and customizable light effects in textiles, marking a significant leap in wearable technology. Beyond mere aesthetics, material innovations are tackling sustainability challenges head-on. Brands are now turning to lab-grown leather alternatives and recycled precious metals, aligning with consumer demands for environmental responsibility. Furthermore, the infusion of artificial intelligence into design processes is paving the way for mass customization. This shift empowers brands to deliver personalized accessories on a larger scale without compromising on cost efficiency. Such technological strides not only offer a competitive edge to early adopters but also reshape consumer expectations, emphasizing functionality and environmental stewardship.
Influence of Social Media and Celebrity Endorsements
Social media platforms and celebrity endorsements significantly drive the market. The increasing penetration of social media has transformed how consumers discover and engage with fashion trends. Platforms like Instagram, TikTok, and Pinterest have become key channels for brands to showcase their products, leveraging influencers and celebrities to amplify their reach. According to StatCounter, Facebook dominated the social media landscape in May 2025, accounting for 57.91% of usage share, while Pinterest captured 16.54% and Instagram held 8.35%, highlighting the vast audience available for targeted marketing campaigns [2]Source: Statcounter Global Stats, “Social Media Stats Canada”, gs.statcounter.com . Celebrity endorsements further enhance brand visibility and credibility, influencing consumer purchasing decisions. The combination of social media influence and celebrity endorsements continues to shape consumer preferences, making it a critical driver for the fashion accessories market in North America.
Sustainability and Eco-conscious Consumer Demand
The growing emphasis on sustainability is significantly driving the North American fashion accessories market. Consumers in the region are increasingly prioritizing eco-friendly and sustainable products, reflecting a shift in purchasing behavior. This trend is fueled by heightened awareness of environmental issues, the adverse effects of fast fashion, and the desire to reduce carbon footprints. Fashion accessory manufacturers are responding by adopting sustainable practices, including the use of recycled and biodegradable materials, reducing production waste, and ensuring the ethical sourcing of raw materials. Furthermore, companies are investing in innovative technologies to create sustainable alternatives that do not compromise on quality or design. Brands are also leveraging eco-conscious marketing strategies, including transparent communication about their sustainability initiatives, to appeal to this growing segment of environmentally aware consumers. The rise of second-hand and upcycled fashion accessories is another notable trend, as consumers increasingly seek products that align with their values.
Restraints Impact Analysis*
| Restraint | (~) % Impact on CAGR Forecast | Geographic Relevance | Impact Timeline |
|---|---|---|---|
| Proliferation of counterfeit products | -0.9% | North America, with highest impact in United States border regions | Short term (≤ 2 years) |
| Supply chain disruptions | -0.7% | North America, with particular vulnerability in Mexico-United States trade corridor | Medium term (2-4 years) |
| Fluctuating raw material prices | -0.5% | North America, with regional variations based on sourcing patterns | Short term (≤ 2 years) |
| Rising trade barriers and tariffs | -0.8% | United States primarily, with spillover effects to Canada and Mexico | Medium term (2-4 years) |
| Source: Mordor Intelligence | |||
Proliferation of Counterfeit Products
The proliferation of counterfeit products poses a significant restraint on the North American fashion accessories market. Counterfeit goods, often sold at lower prices, undermine the revenue of legitimate brands and erode consumer trust. These fake products not only impact brand reputation but also lead to financial losses for manufacturers and retailers. The availability of counterfeit fashion accessories, facilitated by online platforms and unregulated markets, has further exacerbated the issue. Additionally, consumers purchasing counterfeit items may face quality and safety concerns, which can tarnish the overall perception of the fashion accessories market. The increasing sophistication of counterfeiters, who replicate designs and branding with high accuracy, makes it challenging for companies to combat this issue effectively. As a result, brands are compelled to invest heavily in anti-counterfeiting measures, such as advanced labeling technologies and legal actions, which increase operational costs.
Rising Trade Barriers and Tariffs
Rising trade barriers and tariffs are major challenges for the North American fashion accessories market. Higher tariffs on imported goods, especially from countries like China, have made raw materials and finished products more expensive. This has disrupted supply chains and forced businesses to either bear the extra costs or increase prices for consumers. For example, the Office of the United States Trade Representative (USTR) reports that the United States currently has a trade-weighted average import tariff rate of 2.0% on industrial goods and could increase [3]Source: Office of the United States Trade Representative, "Industrial Tariffs", ustr.gov. The United States-Mexico-Canada Agreement (USMCA) has also introduced new trade rules. While these rules aim to boost regional trade, they have made compliance more complicated for businesses. Small and medium-sized businesses in the fashion accessories market are particularly affected, as they often lack the resources to handle these challenges. Additionally, Canada has imposed retaliatory tariffs on U.S. goods due to trade disputes, making cross-border trade even harder. These trade policies are reducing profits and slowing down growth in the market.
*Our forecasts treat driver/restraint impacts as directional, not additive. The impact forecasts reflect baseline growth, mix effects, and variable interactions.
Segment Analysis
By Product Type: Apparel Dominance Faces Watch Innovation
Apparel add-ons dominated the revenue landscape in 2025, accounting for a substantial 57.10%. This highlights their widespread adoption in daily wear, driven by their versatility across varying climates and cultural contexts. These add-ons, which include items such as scarves, belts, hats, and gloves, have become essential components of consumers' wardrobes. Their ability to seamlessly blend functionality with style has made them a preferred choice for individuals looking to enhance their outfits. Additionally, the growing influence of social media and fashion influencers has further propelled the demand for these accessories, as consumers increasingly seek to emulate trending styles and personalize their looks.
Watches, while representing a smaller segment within the market, are experiencing notable growth. With a projected CAGR of 5.05% through 2031, this category is gaining traction due to increasing consumer interest in both traditional and smart timepieces. Traditional watches continue to hold their appeal as timeless fashion statements, while smartwatches are driving innovation with features such as fitness tracking, health monitoring, and connectivity. The rising adoption of wearable technology, coupled with the growing preference for multifunctional accessories, is fueling this growth. Furthermore, the premium and luxury watch segment is also witnessing steady demand, supported by brand-conscious consumers and the perception of watches as status symbols. These factors collectively contribute to the expanding role of watches in the North American Fashion Accessories Market.


By Category: Premium Growth Outpaces Mass Market
Mass-market fashion accessories dominated the revenue landscape in 2025, accounting for a substantial 65.00%. This highlights their widespread adoption in daily wear, driven by affordability, accessibility, and versatility across varying climates and cultural contexts. Mass-market accessories, such as scarves, belts, hats, and costume jewelry, cater to a broad consumer base seeking stylish yet budget-friendly options. The rise of fast fashion and the growing influence of e-commerce platforms have further propelled the demand for these products, as consumers increasingly prioritize convenience and variety. Additionally, the introduction of sustainable and eco-friendly materials in mass-market accessories is gaining traction, aligning with the preferences of environmentally conscious buyers and enhancing the appeal of this segment.
Premium fashion accessories, while representing a smaller segment, are experiencing notable growth and are growing at a CAGR of 5.73% annually due to their association with quality, exclusivity, and brand value. Items such as luxury handbags, high-end watches, and fine jewelry are highly sought after by consumers who view them as status symbols and long-term investments. The premium segment is driven by affluent consumers and the rising trend of aspirational purchasing, where individuals seek to own luxury items as a mark of success. Furthermore, the increasing focus on craftsmanship, innovative designs, and the use of premium materials has elevated the appeal of these products. The growing presence of premium brands on digital platforms and their targeted marketing strategies have also contributed to the expanding role of premium accessories in the market.
By End User: Women Lead While Children Accelerate
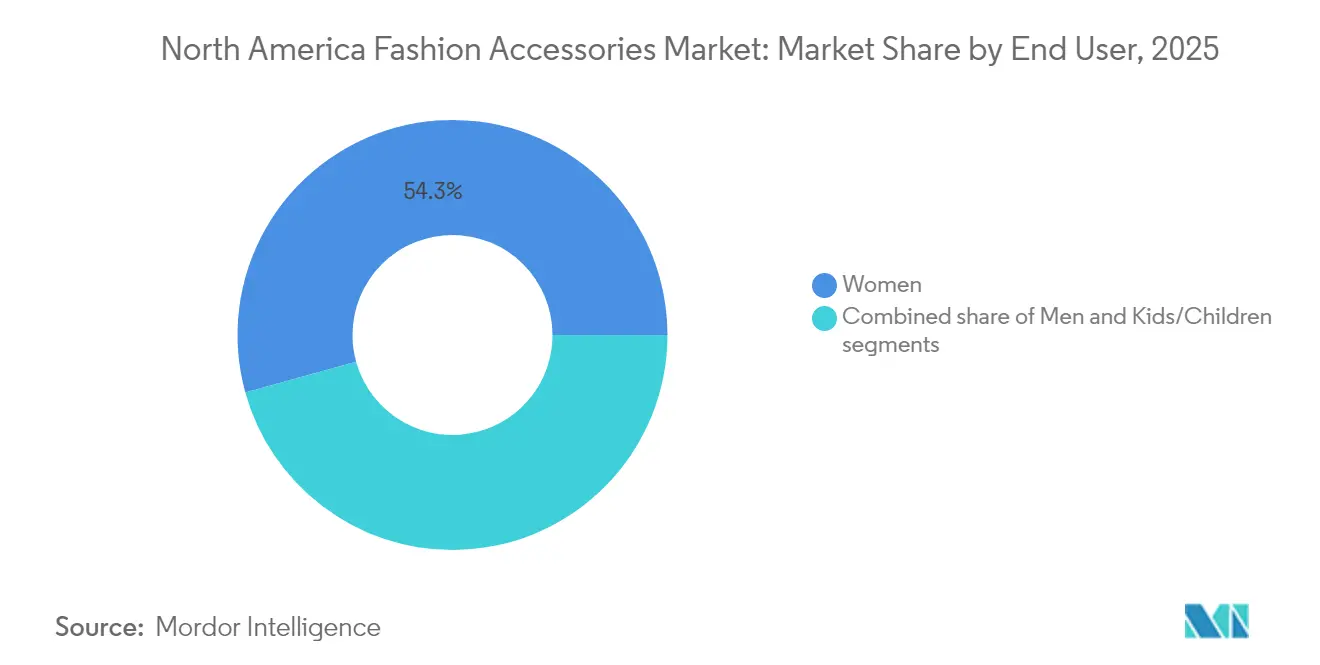
Women’s accessories dominated the revenue landscape in 2025, accounting for a substantial 54.30%. In North America, consumer demand for women's fashion accessories continues to expand, driven by increased disposable income levels, customization requirements, and individual expression preferences. The handbags and purses segment demonstrates the highest growth rate, while jewelry maintains revenue leadership, indicating sustained consumer investment in both premium and essential accessories. Digital retail channels and social media marketing, specifically through Instagram and TikTok platforms, accelerate market trends and increase demand for multi-functional products, including belt bags, statement jewelry, decorative headbands, and hair accessories. For instance, Pop & Suki's millennial-pink camera bag illustrates this market transformation, delivering customizable products that meet North American female consumer preferences.
The children's fashion accessories segment demonstrates a CAGR of 5.31%, attributed to increased consumer demand for products combining aesthetic appeal and practical utility. Items such as hats, gloves, backpacks, and hair accessories are witnessing steady demand, driven by the growing trend of mini-me fashion, where parents dress their children in styles that mirror adult fashion. The rising popularity of character-themed accessories, inspired by movies, cartoons, and popular franchises, is also fueling growth in this segment. Furthermore, the emphasis on safety and comfort in children’s products has led to the introduction of accessories made from hypoallergenic and durable materials.
By Distribution Channel: Digital Transformation Accelerates
Offline stores continue to dominate the market, accounting for a 68.10% share of the revenue in 2025. These stores remain a preferred shopping channel for consumers who value the tactile experience of trying on accessories such as handbags, watches, and jewelry before making a purchase. Brick-and-mortar stores, including department stores, specialty stores, and brand-exclusive outlets, benefit from their ability to offer personalized customer service and immediate product availability. Additionally, the strategic placement of offline stores in high-traffic areas, such as malls and shopping districts, enhances their accessibility and visibility. Seasonal promotions, in-store events, and exclusive collections further attract foot traffic, solidifying the role of offline stores in driving sales within the fashion accessories market.
Online stores, on the other hand, are witnessing rapid growth and are projected to grow at a CAGR of 6.02%. The convenience of shopping from home, coupled with the availability of a wide range of products, has made e-commerce platforms increasingly popular among consumers. Online stores offer competitive pricing, frequent discounts, and easy comparison of products, which appeal to price-sensitive buyers. The integration of advanced technologies, such as augmented reality (AR) for virtual try-ons and artificial intelligence (AI) for personalized recommendations, has further enhanced the online shopping experience. Additionally, the rise of social commerce, where consumers purchase directly through social media platforms, is driving the growth of online sales. With the increasing penetration of smartphones and improved internet connectivity, online stores are expected to play a pivotal role in shaping the future of the market.
Geography Analysis
In 2025, the United States commands a dominant 81.10% share of the North American fashion accessories market. This stronghold is bolstered by the nation's robust consumer spending power, its cultural sway over global fashion trends, and a sophisticated retail infrastructure that caters to a wide array of consumer preferences. For instance, the popularity of smartwatches and fitness trackers among tech-savvy consumers highlights the integration of technology into fashion accessories. Additionally, traditional luxury brands like Tiffany & Co. and Coach continue to thrive, appealing to high-net-worth individuals who regard these accessories as investment pieces rather than mere fashion items.
Canada stands out as a stable secondary market, marked by distinct seasonal purchasing patterns and a penchant for cross-border shopping. These behaviors introduce unique competitive dynamics. For example, Canadian consumers often shop for winter accessories such as scarves and gloves during colder months, while cross-border shopping with the United States influences purchasing decisions. Canadian shoppers increasingly favor sustainable and ethically sourced accessories. This trend presents a golden opportunity for brands that prioritize environmental responsibility and social impact, such as Matt & Nat, a Canadian brand known for its vegan and eco-friendly products. However, the market grapples with challenges related to counterfeit enforcement.
Mexico is on the rise, boasting the title of the fastest-growing market with a projected 6.32% CAGR through 2031. This growth is fueled by an expanding middle class, rising disposable incomes, and a heightened fashion consciousness among urban dwellers. For example, the increasing popularity of affordable yet stylish accessories from local brands and international players like Zara and H&M reflects the growing demand for fashion-forward products in urban areas. Additionally, the influence of social media and e-commerce platforms has significantly shaped consumer behavior in Mexico, with younger demographics driving demand for trendy and affordable accessories.
Regulatory Landscape
In North America, fashion accessories brands and sellers operate under consumer product safety and labeling regimes led by the US Consumer Product Safety Commission (CPSC) and the US Federal Trade Commission (FTC). The FTC enforces textile and apparel-related labeling requirements such as the Care Labeling Rule (16 CFR Part 423) and the Textile Fiber Products Identification Act (TFPIA), which influence how companies substantiate fiber content, country-of-origin, and care claims across mass and premium tiers.
Compliance expectations are tightening around documentation and sustainability-related disclosures. From July 8, 2026, importers must electronically file certificates of compliance for consumer products with the CPSC via the Automated Commercial Environment (ACE), raising the bar for testing records and supplier certifications across cross-border flows under USMCA. Parallel pressure comes from stricter scrutiny of domestic-origin advertising (FTC enforcement emphasis on Made in USA claims) and state-level environmental and materials rules, including PFAS restrictions in states such as California and New York and California SB 253 climate reporting requirements for large companies doing business in the state.
Value Chain Analysis
The North America fashion accessories value chain spans raw material inputs (leather, textiles, metals, plastics, glass), component processing and finishing, manufacturing and assembly, quality and testing, branding and merchandising, and multi-channel distribution through department stores, specialty retailers, brand stores, marketplaces, and DTC e-commerce. Compliance and traceability run across the chain, especially for jewelry and accessories where CPSC safety expectations apply even when the seller is not the manufacturer, pushing brand owners and importers to manage third-party testing, supplier certifications, and product documentation.
Upstream sourcing and midstream processing are increasingly influenced by verification frameworks and due diligence programs that shape supplier selection and cost-to-serve. Tapestry highlights multi-year supplier relationships and third-party verification linked to initiatives such as the Leather Working Group and Textile Exchange, reflecting a shift toward audited materials and process claims for leather and textiles. In watches and jewelry-linked accessories, minerals and metal sourcing due diligence remains a key value-chain control point. Fossil Group disclosures also show how origin-claim substantiation (for example, Made in USA) relies on verifiable manufacturing records rather than informal supplier assurances.
Competitive Landscape
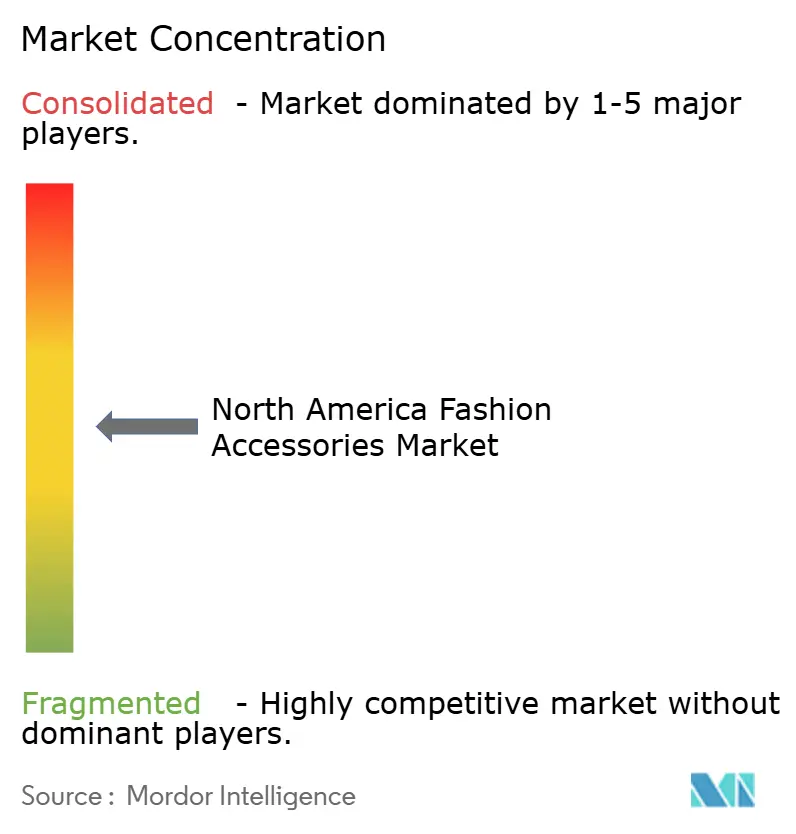
The North American fashion accessories market demonstrates moderate fragmentation among industry participants. This score highlights a competitive landscape where established luxury conglomerates, such as LVMH and Kering, coexist with emerging direct-to-consumer brands like Mejuri and MVMT, as well as regional specialists catering to localized preferences. Major players are increasingly turning to vertical integration, aiming to tighten their grip on supply chains and elevate customer experiences. For instance, luxury brands are acquiring raw material suppliers and investing in in-house manufacturing to ensure quality control and faster time-to-market.
Meanwhile, challenger brands are carving out their niche, capturing market share through targeted positioning and genuine brand stories that resonate deeply with select consumer segments. Brands like Allbirds and Rothy’s, for example, have gained traction by emphasizing sustainability and eco-friendly practices, appealing to environmentally conscious consumers. These companies leverage their unique value propositions to differentiate themselves in a crowded market, often using social media and influencer marketing to amplify their reach.
Technology is a pivotal differentiator in this arena, with companies channeling investments into innovative solutions to stay ahead. Artificial intelligence is being utilized for personalized recommendations, enabling brands to offer tailored product suggestions based on consumer preferences and behavior. Augmented reality tools, such as virtual try-ons offered by brands like Warby Parker, enhance the online shopping experience by allowing customers to visualize products before purchase. Additionally, blockchain technology is being adopted to improve supply chain transparency, addressing growing consumer demands for authenticity and sustainability.
North America Fashion Accessories Industry Leaders
-
Tapestry, Inc.
-
LVMH Moët Hennessy Louis Vuitton SE
-
Fossil Group, Inc
-
Kering S.A.
-
Nike Inc.
- *Disclaimer: Major Players sorted in no particular order

Market Opportunities and Future Outlook
Regulatory-driven circularity and traceability programs are creating whitespace for service providers and brands that can operationalize compliance across accessories SKUs. California SB 707 (Responsible Textile Recovery Act of 2024) requires producers above a sales threshold to participate in a Producer Responsibility Organization (PRO) by July 1, 2026, increasing demand for take-back, sorting, reuse, and recycling partnerships, and for data systems that can connect products to producer responsibility reporting. This supports differentiation through resale, repair, and recovery-aligned assortments, while improving control over reverse logistics and product authentication.
Digital tooling that compresses design-to-shelf cycles and improves audit readiness is also becoming a practical lever as online penetration rises and documentation burdens increase. Tapestry and LVMH have formalized multi-year roadmaps and targets tied to material circularity and carbon reduction (including LVMH LIFE 360), reinforcing investment momentum in traceable inputs and supplier engagement across leather, textiles, and metals. With heightened scrutiny of origin and marketing claims, and the CPSC move to eFile compliance certificates via ACE from July 2026, brands that embed product compliance data and supplier verification into omnichannel operations can reduce rework risk from labeling, safety testing, and substantiation gaps while iterating faster.
Recent Industry Developments
- June 2026: Fossil Group, Inc. announced its inclusion in the Russell 2000 Index, effective at market close on June 26, 2026. The inclusion supports index-related fund flows and increases visibility in core watch and leather goods segments. The move strengthens brand credibility and liquidity in these core categories.
- May 2026: Tapestry, Inc. was awarded a US patent for its AI platform Mira. The patent enables AI-enabled data integration for enterprise decision-making. It strengthens digital infrastructure and agility in product and portfolio decisions.
- April 2026: LVMH Moet Hennessy Louis Vuitton SE continued organic growth in Q1 2026 across its fashion and accessories portfolio (press release). The company level growth signal in luxury fashion accessories indicates resilience and demand in luxury accessories. This informs market dynamics for premium brands and supports ongoing premium pricing strategies.


Research Methodology Framework and Report Scope
Market Definition and Coverage
For this study, we size the North America fashion accessories market as the revenue generated from consumer purchases of items such as bags, wallets, watches, jewelry, sunglasses, and other accessory-type products sold across retail and digital channels in the region.
Scope exclusions: This sizing excludes second-hand resale value that is not booked as new product revenue and any informal person-to-person sales.
Segmentation Overview
-
By Product Type
- Footwear
- Apparel
- Wallets
- Handbags
- Watches
- Sunglasses
- Jewelery
-
By End User
- Men
- Women
- Kids/Children
-
By Category
- Mass
- Premium
-
By Distribution Channel
- Offline Stores
- Online Stores
-
By Geography
- United States
- Canada
- Mexico
- Rest of North America
Data Sources, Market Sizing, and Validation
Desk Research
Desk research starts by building a clean fact base for consumer spending, trade flows, and retail structure across the United States, Canada, and Mexico. We use public sources such as U.S. Census retail sales series, the U.S. Bureau of Labor Statistics CPI and consumer spending indicators, the U.S. International Trade Commission trade data, Statistics Canada tables, and UN Comtrade, which help us sanity-check demand direction and import dependence for accessory categories.
Next, we review company annual reports, investor presentations, and earnings transcripts to understand category mix, pricing posture, and channel shifts. To close remaining gaps, we also use paid subscriptions for company financials and news intelligence, plus shipment-level import and export data and patent databases when relevant to product or material changes. The desk sources listed here are not exhaustive, and other public and paid sources are used to collect, cross-check, and clarify inputs.
Primary Interviews and Surveys
Primary work is used to pressure-test the desk assumptions and keep the scope consistent across the region. We speak with manufacturers, brand owners, distributors, large retailers, and specialist online sellers, then we confirm the direction of pricing and volume shifts with category managers and sourcing teams who track those changes first.
Coverage spans the United States, Canada, and Mexico, so differences in channel mix, premiumization, and seasonality are reflected in the final model.
Distribution of primary research fieldwork respondents
| Company type | Respondent position | Region |
|---|---|---|
| Top tier: 26% | CXOs: 13% | |
| Mid tier: 60% | Functional/Unit leaders: 34% | |
| Smaller Players: 14% | Managers: 53% |
Market-Sizing & Forecasting
The market total is first reconstructed using a top-down approach where consumer spend indicators, retail sales structure, and category-level trade patterns are translated into an addressable demand pool for fashion accessories in North America. Those totals are then checked using selective bottom-up approximations, including sampled brand and retailer revenue splits, channel checks, and a simple ASP times volume logic for high-visibility categories, and the model is adjusted where mismatches persist.
A few inputs that matter in this market are the online share of accessory purchases, premium versus mass mix, seasonal peaks tied to gifting periods, import share by category (especially for handbags, jewelry, and sunglasses), and price movement signals (CPI and observed ticket-size changes). Where data is patchy for a product line or a smaller country, we apply proxy ratios from similar categories and confirm them through interviews before finalizing.
For forecasting, we rely on scenario analysis supported by a light multivariate regression view, using drivers such as discretionary income direction, inflation and price pass-through, and expected channel expansion. Expert feedback is used to keep driver paths realistic, especially for premiumization and online growth assumptions.
Data Validation & Update Cycle
Outputs are validated through multiple checks so the final numbers are stable and explainable. We compare results against independent signals such as retail sales direction, import trends, and company-reported category performance, and then we investigate outliers before the model is approved.
A second analyst review is completed to test formulas, conversions, and year-to-year movements, and re-contacts are triggered if a key assumption changes or a major variance is found. Reports are refreshed annually, with interim updates when material changes occur. Before delivery, we run a final update pass so clients receive the latest view available at that time.
Mordor Intelligence's North America Fashion Accessories Market Estimate Compared With Other Published Estimates
Published market sizes for fashion accessories in North America can differ substantially because the category boundary is not treated the same way by every publisher. Variations often come from what gets counted as an accessory versus adjacent apparel or footwear spend, plus how online sales and premium pricing are handled in the base year.
Retail sales direction, trade import signals for accessory-heavy categories, and company-reported category mix are the checks we use to keep Mordor Intelligence's estimate tied to a defined consumer purchase pool for the United States, Canada, and Mexico. The larger gaps in other figures often come from folding in broader apparel spend, assuming faster premium price growth, or applying a single penetration rate across countries without a channel-mix reality check.
Benchmark comparison
| Source | Market Size | Gaps in Research Methodology |
|---|---|---|
| Mordor Intelligence | USD 0.90 T (2025) | |
| Trade Journal A | USD 287.89 B (2024) | Uses a different base year and typically reflects a narrower set of accessory types, with less explicit treatment of premium versus mass mix and country-level channel splits, which can compress the total. |
| Regional Consultancy B | USD 323.37 B (2025) | Often limits scope closer to personal accessories and may not fully capture footwear and broader accessory-linked revenue, and it can apply a faster price and adoption curve that shifts the level versus a spend-anchored reconstruction. |
The spread across the table is mainly explained by scope boundaries and how pricing and channel mix are carried into the base year. By keeping the demand pool grounded in observable retail and trade signals and confirming key splits through interviews, the final number stays traceable to clear variables and repeatable steps for future updates.


Key Questions Answered in the Report
What is the current value of the North American fashion accessories market?
The marketplace generated USD 0.94 trillion in 2026 and is forecast to rise to USD 1.19 trillion by 2031.
Which product segment is expanding the fastest?
Watches are leading with a 5.05% CAGR, fueled by luxury collectors and smart-wearable features.
Why is Mexico viewed as a growth hotspot?
Urban middle-class expansion, digital-commerce penetration, and fashion-conscious youth underpin Mexico’s 6.32% CAGR through 2031.
Which distribution channel is gaining ground the quickest?
Online stores are growing at a 6.02% CAGR, outpacing physical retail as consumers embrace omnichannel shopping journeys.
Page last updated on:






