
Market Overview
| Study Period | 2020 - 2031 |
|---|---|
| Forecast Data Period | 2026 - 2031 |
| Base Year Market Size (2025) | USD 13.09 Billion |
| Market Size (2026) | USD 14.77 Billion |
| Market Size (2031) | USD 27.01 Billion |
| Growth Rate (2026 - 2031) | 12.84% CAGR |
| Market Concentration | High |
Major Players *Disclaimer: Major Players sorted in no particular order Image © Mordor Intelligence. Reuse requires attribution under CC BY 4.0. | |
North America Fantasy Sports Market Analysis by Mordor Intelligence
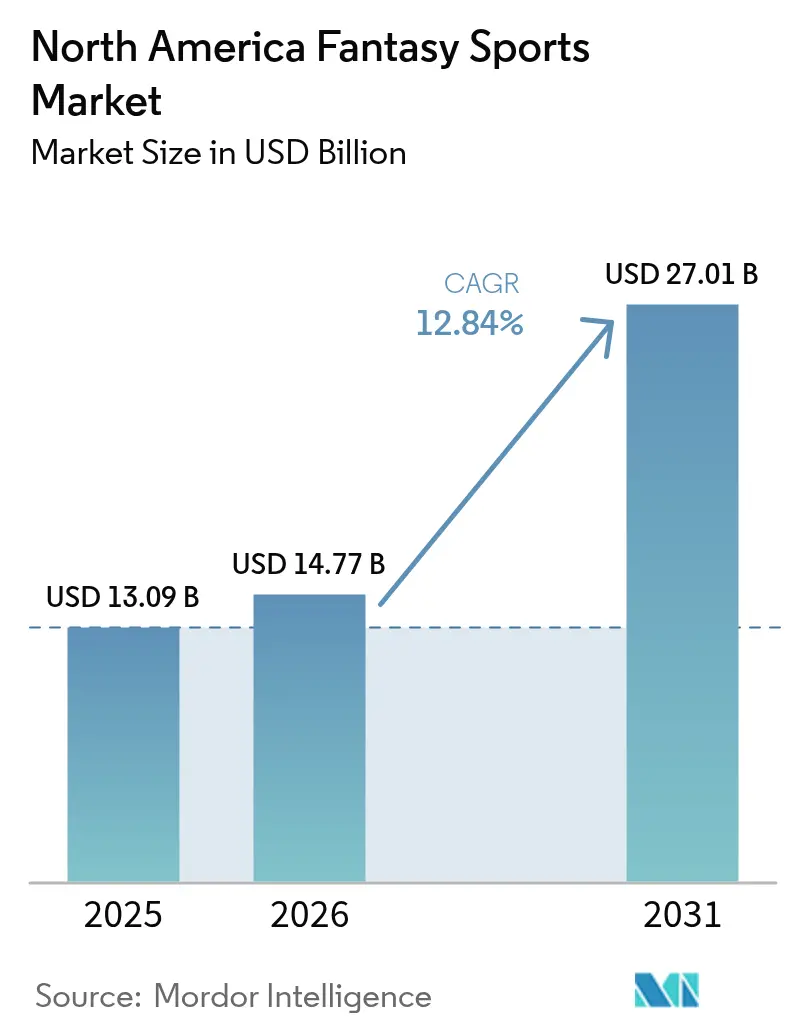
The North America fantasy sports market size was valued at USD 13.09 billion in 2025 and estimated to grow from USD 14.77 billion in 2026 to reach USD 27.01 billion by 2031, at a CAGR of 12.84% during the forecast period (2026-2031). The market’s momentum is rooted in regulatory liberalization that now covers more than 90% of the population, in 5G-enabled mobile usage that raises session length, and in product hybrids that merge skill-based contests with real-time wagering.[1]FanDuel Press Team, “FanDuel TV Launches New FAST Channel ‘FanDuel TV Extra,’” press.fanduel.com Emerging ancillary formats, intense duopoly marketing, and rising Gen Z participation continue to expand total addressable demand while compressing margins for smaller operators. Operators are investing in AI-driven personalization, blockchain payments, and cross-media partnerships to widen monetization pathways and reduce customer acquisition cost pressure. Regulatory clarity is also encouraging alliances with leagues and broadcasters, allowing unified data feeds that heighten in-game engagement.
Key Report Takeaways
- By fantasy sports type, Daily/Weekly Fantasy and Ancillaries held 60.55% of the 2025 revenue of the North America fantasy sports market, while the same category is projected to expand at a 13.82% CAGR through 2031.
- By sporting type, American Football commanded 58.25% of the 2025 value of the North America fantasy sports market; Ice Hockey is forecast to post the fastest ascent at a 14.38% CAGR to 2031.
- By platform, mobile applications accounted for 76.05% of user activity in 2025 of the North America fantasy sports market, and also led future growth with a 13.9% CAGR.
- By revenue model, entry-fee rake contests generated 60.95% of the 2025 turnover of the North America fantasy sports market, whereas Hybrid/Ancillary Micro-Betting is advancing at a 14.2% CAGR through 2031.
- By user demographic, the 25-34 age group held 58.10% share of the North America fantasy sports market in 2025, while the 18-24 cohort is expanding most rapidly at a 14.58% CAGR.
- By geography, the United States represented 84.10% of the 2025 market value of the North America fantasy sports market, whereas Canada is projected to grow at a 14.05% CAGR over the forecast horizon the led.
Note: Market size and forecast figures in this report are generated using Mordor Intelligence’s proprietary estimation framework, updated with the latest available data and insights as of 2026.
North America Fantasy Sports Market Trends and Insights
Drivers Impact Analysis*
| Driver | (~) % Impact on CAGR Forecast | Geographic Relevance | Impact Timeline |
|---|---|---|---|
| Regulatory expansion to >90% population | +3.2% | United States, Canada | Medium term (2-4 years) |
| Smart-phone and 5G penetration | +2.8% | Urban North America | Short term (≤ 2 years) |
| Major-league schedule growth | +2.1% | United States, Canada | Long term (≥ 4 years) |
| AI-driven personalization | +1.9% | North America early adoption | Medium term (2-4 years) |
| Micro-bet “pick-em” formats | +1.6% | Urban United States, Canada | Short term (≤ 2 years) |
| Streaming of Sunday-Ticket and NHL/MLB packages | +1.4% | United States, Canada | Medium term (2-4 years) |
| Source: Mordor Intelligence | |||
Regulatory Expansion to >90% of North American Population by 2027
State-level legalization is accelerating network effects that lower marginal compliance cost and unlock broader ad inventory on search and social channels. Newly enabled states increase lifetime value because operators can standardize product features across a larger contiguous user base. Unified compliance modules let leading platforms redirect spending from legal vetting to high-yield marketing and product R&D. The trend also encourages strategic partnerships with payment gateways, reducing friction in onboarding. Altogether, wider legality contributes a 3.2% additive lift to forecast CAGR as remaining holdout jurisdictions move toward enabling frameworks.[2]Lexology, “A Safe Bet: FanDuel and DraftKings Are Stifling Competition,” lexology.com
Smart-phone and 5G Penetration Lifts Mobile DFS Traffic
5G networks bring sub-20 millisecond latency, enabling push-based player-prop updates that were impractical on 4G. Real-time data improves lineup optimization and reinforces the daily engagement loop. Operators report a 40% gain in average session length once users migrate to 5G-capable devices. The technology also facilitates biometric login and instant withdrawals, lowering abandonment at key friction points. In parallel, device manufacturers preload sports-betting widgets, shortening the funnel between media consumption and fantasy entry. These shifts collectively add 2.8% to the expected CAGR across the North America fantasy sports market.[3]Qualcomm Technologies, “5G Gaming Insights,” qualcomm.com
Major-League Schedule Growth and Cross-Media Tie-ins
Expanded NBA and MLB game calendars inject more fantasy-eligible events, driving higher contest frequency. League-owned media arms are embedding contest prompts inside live streams, converting passive viewers into active contestants. FanDuel TV Extra, for example, offers over 12 hours of integrated programming that funnels viewers straight into contests through clickable overlays. These tie-ins improve acquisition efficiency by 20% relative to traditional advertising. They also extend user engagement into shoulder seasons, smoothing revenue volatility.
AI-Driven Personalization Raises Session Length and ARPU
Machine-learning models ingest user history to recommend contests, upsell premium data, and time push notifications at peak receptivity. Operators tracking 2024 pilots noted a 15-point improvement in retention after six months, alongside a 12% uplift in ARPU. Real-time personalization also reduces customer support tickets because suggested lineups lower new-user cognitive load. During live play, AI offers micro-bet prompts calibrated to individual risk tolerance, lifting in-game turnover. Over the forecast horizon, personalization accounts for a 1.9% additive CAGR impact, especially as Gen Z usage deepens.
Restraints Impact Analysis*
| Restraint | (~) % Impact on CAGR Forecast | Geographic Relevance | Impact Timeline |
|---|---|---|---|
| State-by-state regulatory fragmentation | -2.1% | United States, Canada | Long term (≥ 4 years) |
| Rising CAC amid duopoly-scale ad spend | -1.8% | Competitive North America | Short term (≤ 2 years) |
| KYC/AML compliance and payment surcharges | -1.3% | North America | Medium term (2-4 years) |
| User shift to straight sports-betting | -1.1% | United States, Canada | Medium term (2-4 years) |
| Source: Mordor Intelligence | |||
State-by-state Regulatory Fragmentation and Fee Burden
Each jurisdiction sets unique fee structures ranging from USD 50,000 up to USD 600,000 per license forcing operators to replicate compliance workflows. Maintaining discrete reporting systems elevates fixed costs, curbing smaller entrants’ ability to reach scale. Spot audits and sudden rule reinterpretations have already removed ten operators from Massachusetts in 2024, underscoring headline risk. Capital tied up in bonding requirements and legal contingencies delays feature rollouts, slowing innovation cadence and shaving 2.1% off long-run CAGR.
Rising CAC Amid Duopoly-scale Ad Spend
DraftKings and FanDuel collectively spent more than USD 1.2 billion on marketing in 2024. Their saturation of broadcast and social channels elevated average CAC to USD 300–350, up from USD 200–250 within 18 months. Smaller operators struggle to generate brand recall, driving consolidation as Colorado’s active licensees fell from 26 to 13. To maintain profitability, platforms must extend average customer lifespan by at least four months or introduce higher-margin subscription tiers. The cost headwind reduces forecast CAGR by 1.8%.
*Our forecasts treat driver/restraint impacts as directional, not additive. The impact forecasts reflect baseline growth, mix effects, and variable interactions.
Segment Analysis
By Fantasy Sports Type: Daily Formats Drive Market Evolution
Daily/Weekly Fantasy and Ancillaries captured 60.55% of 2025 revenue, underscoring the shift to instant-gratification experiences that sync with mobile alerts and social feeds. The format’s 13.82% CAGR outpaces season-long contests as operators embed micro-bet props inside lineups, further widening engagement. Transaction frequency aligns earnings with media moments, letting platforms monetize peaks in live viewership. High fill rates also enhance liquidity, supporting larger guaranteed prize pools that attract casual and high-volume users alike. These dynamics cement the daily segment as the cornerstone of the North America fantasy sports market.
Season-long formats still retain legacy users who prize community leagues and deeper research cycles. However, younger cohorts gravitate toward dynamic payout structures and lower commitment windows. Operators reply by automating draft assistance, adding weekly cash-based challenges, and cross-selling season subscribers into daily contests mid-year. The convergence widens average user value, though it increases classification scrutiny as regulatory bodies debate the line between skill and chance.


By Sporting Type: Football Dominance with Hockey Acceleration
American Football delivered 58.25% of 2025 revenue and benefits from a compact weekly cadence that drives concentrated user activity. Statistical depth and cultural ubiquity ensure top-of-mind positioning every fall weekend. Operators lock in user retention through cross-promotions that roll football players into basketball or baseball slates once the Super Bowl concludes. Baseball remains steady due to its near-daily schedule, offering volume traders multiple entries and consistent ARPU. Basketball enjoys both college and pro seasons, extending contest availability into spring.
Ice Hockey is the fastest-growing sub-segment at 14.38% CAGR as streaming reach improves and younger Canadian audiences adopt daily formats. Operators leverage real-time shift data and player tracking to develop premium stat feeds that mirror football’s depth. Growth in niche sports such as golf, soccer, and eSports diversifies revenue, protecting platforms from over-reliance on a single league cycle. Genius Sports’ BetVision expansion into global soccer underscores the wider opportunity set beyond the core four U.S. leagues.
By Platform: Mobile Supremacy with Desktop Persistence
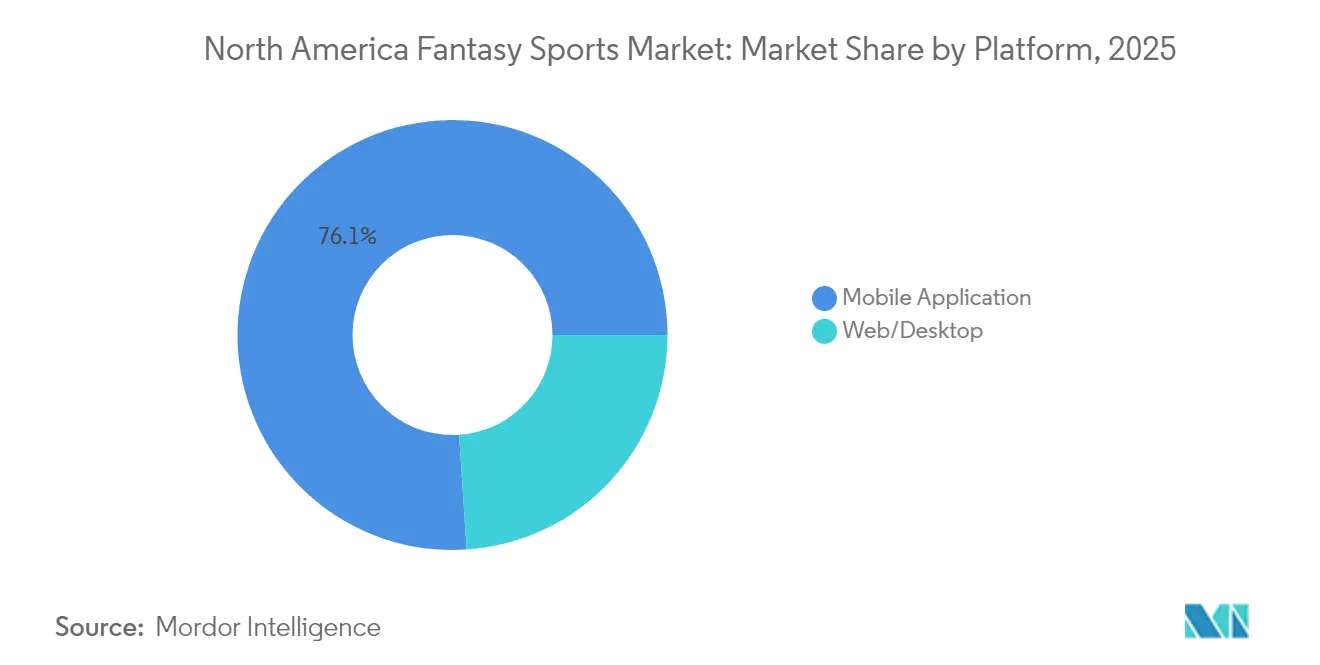
Mobile apps commanded a 76.05% share in 2025 and are projected to grow at a 13.9% CAGR through 2031. Push notifications, location-based offers, and biometric sign-in drive conversion, while 5G low latency supports synchronized in-stream wagering. APIs pull live video synchronized to contest dashboards, helping users manage lineups mid-play. Camera-enabled social sharing turns highlight reels into viral acquisition assets.
Desktop maintains a niche for research-intensive and multi-lineup users. Screen real estate suits advanced optimizer tools and third-party plug-ins. Cohorts alternating between devices generate higher total handle, prompting operators to maintain cross-platform parity. Responsive design and single sign-on ensure state-level compliance while preserving UX consistency.
By Revenue Model: Rake Dominance with Hybrid Innovation
Entry-fee rake contests produced 60.95% of 2025 turnover, giving operators predictable percentage earnings that scale with pool size. Subscription and premium analytics tiers deepen monetization among power users, offering advanced projections and ownership data. Free-to-play ad-supported pools drive funnel top-ups, later converting to paid entries via loyalty mechanics.
Hybrid/Ancillary Micro-Betting is advancing at 14.2% CAGR, layering live player props atop existing contest structures. In-game prompts raise the velocity of wagers, shifting revenue from pre-match peaks to sustained in-event streams. Blockchain payments shrink transaction fees beneath 2%, widening margin on micro wagers originally uneconomic on card rails. Operators see favorable elasticity; average ticket size falls, but volume gains lift gross gaming revenue.
By User Demographic: Millennial Core with Gen Z Expansion
Users aged 25-34 generated 58.10% of 2025 stakes and present the highest lifetime value due to disposable income and deep sports literacy. They gravitate toward higher-buy-in contests and premium data subscriptions. The 35-44 and 45+ bands prefer season-long leagues, showing higher retention yet lower contest frequency.
Gen Z (18-24) is the fastest-growing cohort at 14.58% CAGR. They favor pick-em props, social feeds, and instant withdrawals via digital wallets. Gamified loyalty ladders and referral bonuses resonate strongly, leveraging peer networks for organic growth. Operators localize content with meme-style graphics and short-form video to meet the expectations of this mobile-native audience.
Geography Analysis
The United States accounted for 84.10% of the 2025 value and remains the anchor of the North America fantasy sports market. State-by-state legalization lets operators leverage contiguous marketing, while NFL, NBA, and MLB partnerships secure proprietary data feeds that enhance scoring accuracy and in-app engagement. Tax rate disparities encourage corporate domiciling in favorable jurisdictions, but platform access remains nationwide via geofenced apps.
Canada is accelerating at a 14.05% CAGR as provinces adopt Ontario’s regulatory blueprint. Higher tax burdens prompt operators to emphasize premium tools and subscription bundles to protect margin. NHL coverage offers cultural resonance, while cross-border campaigns leverage brand equity built in the U.S. Localization includes French-language interfaces and debit-first payment options to capture Quebec and Atlantic users.
Mexico is in an early development phase. SEGOB licensing focuses on sportsbook frameworks, leaving fantasy classifications ambiguous. Operators studying entry must integrate OXXO cash deposits and Spanish-language UI, plus soccer-first contest menus. Growth potential is significant, yet dependent on clearer rules and localized marketing that educates consumers on skill-based formats.
Regulatory Landscape
Fantasy sports regulation in North America is primarily jurisdiction-led, with the United States governed through state statutes and administrative rules rather than a single federal regulator. This setup creates a licensing and controls regime administered by bodies such as the New York State Gaming Commission (Interactive Fantasy Sports rules) and the Mississippi Gaming Commission (Title 13, Part 15), while other states codify their frameworks through legislative chapters (for example, Iowa Code Chapter 99E and Delaware Code Title 29). Operators typically operate under state-specific registrations or licenses, internal-control requirements, independent technical reviews, and periodic third-party audits, which affects product design, reporting, and permissible contest mechanics.
In Canada, fantasy sports sits under the Criminal Code of Canada structure that prohibits gambling unless it is conducted and managed as an authorized provincial or territorial lottery scheme. That puts market access on provincial and territorial gaming frameworks and their approach to licensing or online operations, with compliance emphasis extending to KYC/AML, responsible gaming controls, and payment processing integrity. Across both countries, the practical takeaway is that contest formats, payments, and marketing are tailored to local definitions that separate skill-based fantasy contests from gambling-style wagering, and to meet regulator-led technical and audit expectations.
Value Chain Analysis
The value chain starts with sports content and data inputs (league schedules, official and third-party statistics, and real-time feeds), then moves to platform development and operations (app development, contest engines, risk and fraud tools, geolocation, payments, and KYC/AML workflows). Distribution and demand creation are largely mediated by media and streaming partners, affiliates, and owned channels that can place contest entry prompts next to live sports consumption, supported by cloud infrastructure and customer support functions needed to sustain high-frequency engagement on mobile.
Recent moves also point to increasing vertical integration and tighter media-to-play loops in the chain. FanDuel expanded downstream distribution through a long-term commercial partnership with Diamond Sports Group, including rebranding 16 regional sports networks to FanDuel Sports Network and integrating digital direct-to-consumer products (October 2024), strengthening the funnel from viewing to contest entry. On the operator side, consolidation and platform ownership are reshaping procurement and bargaining dynamics, including Allwyn International AG acquiring a 62.3% majority stake in PrizePicks (January 2026), the FantasySpin and FastDraft merger to unify daily fantasy and best ball offerings (May 2026), and DraftKings launching DKeX inside its flagship app to bring prediction-market style infrastructure in-house (June 2026).
Competitive Landscape
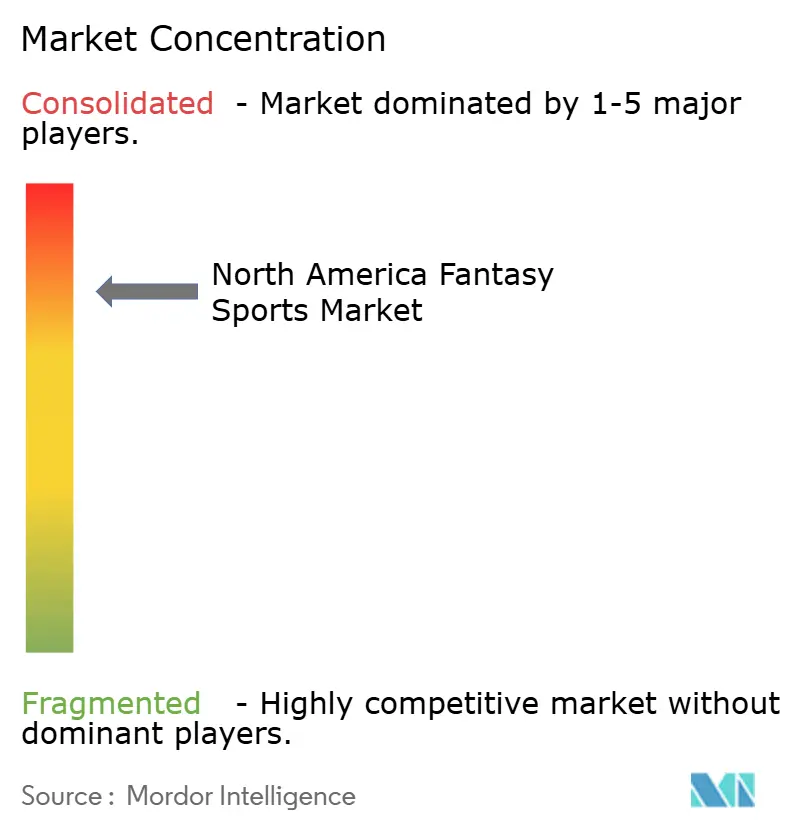
The North America fantasy sports market exhibits a duopoly where DraftKings and FanDuel jointly control a roughly 80% share. Both firms carry robust compliance infrastructure and first-mover brand equity, letting them outspend rivals in media and secure exclusive league data. DraftKings’ 2024 acquisition of Simplebet bolstered in-play micro-betting, while FanDuel’s integration of FanDuel TV Extra amplifies cross-media funneling. The companies also lobby collectively through trade associations, shaping favorable regulatory standards.[4]Mogin Law LLP, “A Safe Bet: FanDuel and DraftKings Are Stifling Competition,” moginlaw.com
Mid-tier challengers such as PrizePicks and Underdog Sports target Gen Z with simplified pick-em formats and influencer alliances. They differentiate via low-stakes contests and streamlined UX, though rising CAC pressures profitability. Niche operators focus on individual sports or single states, using local partnerships to build brand presence before expanding.
Technology suppliers like White Hat Studios and Genius Sports monetize data, video, and content tools that power both incumbents and disruptors. Their modular offerings lower build-time for new entrants but deepen dependence on shared infrastructure, reinforcing switching costs. As antitrust scrutiny grows, regulators may revisit data access terms, potentially opening room for alternative providers.
North America Fantasy Sports Industry Leaders
DraftKings Inc.
Flutter Entertainment plc (FanDuel)
Yahoo Inc. (Yahoo Fantasy)
Paramount Global (CBS Sports Digital)
ESPN Enterprises, Inc.
- *Disclaimer: Major Players sorted in no particular order

Market Opportunities and Future Outlook
White space is emerging where state and provincial rulemaking formalizes licensure, certification, and taxation in ways that allow operators to standardize controls and product features across larger addressable footprints. A concrete example is Illinois implementing a comprehensive fantasy sports framework effective July 1, 2026, including operator licensure, third-party certification, and a 15% tax on adjusted gross gaming revenue. This supports demand for compliance tooling (certification, audit, geolocation, identity, and payments) and pushes operators to refine unit economics through higher-margin premium tools and retention-led experiences.
Another opportunity area is product and channel expansion tied to large sports moments and cross-platform identity, where fantasy can be bundled with media and adjacent betting ecosystems rather than relying only on paid acquisition. Yahoo Sports partnership with FOX One to introduce soccer fantasy games aligned to the FIFA World Cup 2026 reflects demand for event-driven, sport-specific formats that broaden participation beyond core U.S. leagues, while DraftKings and ESPN account linking (announced March 2026) reinforces the move toward unified accounts and deeper personalization across fantasy rosters and sports engagement. At the same time, uneven enforcement and rule interpretations remain a constraint, so operators are also building optionality through alternative regulatory pathways (including prediction-market style models) and by investing in technology stacks that reduce compliance friction and payment costs when deploying new contest formats.
Recent Industry Developments
- July 2026: North Carolina signed a state budget on July 7 that recognizes the CFTC’s exclusive authority over federally regulated prediction markets and adds a 6% tax on their net trading revenue. This sharpens the distinction between state-regulated gaming products and federally overseen prediction-market structures, influencing how fantasy-adjacent "pick-em" and exchange-style offerings are routed and monetized.
- June 2026: Illinois approved a fiscal 2027 budget that establishes a licensing framework for fantasy sports operators and sets a 15% tax on adjusted gross gaming revenue. The move increases compliance and reporting requirements, and it favors operators and suppliers that already run scalable audit, certification, geolocation, and payments controls across multiple jurisdictions.
- August 2024: ESPN Fantasy Football added new features and content for the 2024 season, expanding in-app tools and engagement mechanics around America’s largest fantasy sport. These platform upgrades reinforce how incumbent media brands use product changes to retain users and defend share as paid DFS and hybrid formats compete for attention on mobile.


Research Methodology Framework and Report Scope
Market Definition and Coverage
This market covers paid and free-to-play fantasy sports in North America, where users create lineups, join contests, and generate revenue through entry fees, subscriptions, and advertising across mobile and web platforms.
Scope exclusions: We exclude offline private pools with no platform revenue capture and any real-money sports betting handle that is not tied to fantasy contest monetization.
Segmentation Overview
- By Fantasy Sports Type
- Traditional Season-long
- Daily/Weekly Fantasy and Ancillaries
- By Sporting Type
- American Football
- Baseball
- Basketball
- Ice Hockey
- Other Sports (Golf, Soccer, eSports)
- By Platform
- Mobile Application
- Web/Desktop
- By Revenue Model
- Entry-fee Rake Contests
- Subscription/Premium Tools
- Advertising-supported Free Play
- Hybrid/Ancillary Micro-Betting
- By User Demographic
- Age 18-24
- Age 25-34
- Age 35-44
- Age 45+
- By Country
- United States
- Canada
- Mexico
Data Sources, Market Sizing, and Validation
Desk Research
Desk work started with building a clean view of the addressable player base and the monetization paths that show up in public data. We relied on non-paywalled sources such as the Fantasy Sports and Gaming Association participation releases, US Census demographic baselines, national telecom and broadband statistics (such as FCC summaries), and legal or regulatory trackers at the state level that signal where paid contests can scale.
To connect demand to revenue, we also reviewed public company filings and investor presentations from listed platform owners, along with reputable press coverage on contest formats, media partnerships, and promotional intensity. Where available, a paid company financials and intelligence subscription and a paid news and financials subscription were used to standardize reported revenue lines and timing. These sources are not exhaustive, and many other public references were used to clarify definitions, validate assumptions, and close smaller data gaps.
Primary Interviews and Surveys
Primary work focused on how platforms convert participation into revenue, since entry-fee rake rates, payout structures, and premium tool pricing can shift the final market value. We spoke with operators, media and affiliate partners, payment or compliance advisors, and experienced fantasy players across the US, Canada, and Mexico to confirm typical ARPU ranges, promotional cycles, and how rule changes affect paid contest activity.
Distribution of primary research fieldwork respondents
| Company type | Respondent position | Region |
|---|---|---|
| Top tier: 34% | CXOs: 15% | |
| Mid tier: 51% | Functional/Unit leaders: 34% | |
| Smaller Players: 15% | Managers: 51% |
Market-Sizing & Forecasting
The core sizing uses a top-down demand pool build where participation levels are converted into revenue using monetization rates that match how fantasy sports are consumed in North America. In practice, the model links active users to paid-contest penetration, average entry fees, operator rake, and the share of revenue coming from subscriptions or advertising, which are then aligned to platform mix (mobile vs web) and sport seasonality.
We then corroborated totals with selective bottom-up checks, mainly through sampled ARPU x estimated active-user counts and a roll-up of publicly visible revenue signals from larger platforms, followed by adjustments where private company coverage is thin. Inputs that matter most include the active player base trend, the share of users playing daily formats versus traditional season-long play, typical entry-fee and contest frequency, rake rate ranges by contest type, and the pace of premium tool adoption. Forecasts were built using scenario analysis around regulation pace, marketing intensity, and engagement time, and assumptions were finalized after reconciling them with expert feedback from the primary interviews.
Data Validation & Update Cycle
Outputs are checked against independent signals, such as participation benchmarks, disclosed platform revenue mixes, and changes in legal availability by jurisdiction, and then any outliers are traced back to the specific driver that caused the jump. If variance is unusually high for a country or a revenue model, we re-check the input logic and re-contact sources to confirm whether the change is real or timing-related.
Each study goes through multiple analyst reviews before sign-off so that assumptions, conversions, and currency treatment are consistent across the full time series. Reports refresh annually, with interim updates triggered by material events such as major regulatory shifts, large product launches, or visible changes in promotional intensity. Before delivery, a final pass is completed so clients receive the most current view available.
Mordor Intelligence's North America Fantasy Sports Market Size Measured Against Other Published Estimates
Published market values for fantasy sports can vary because teams use different timing, pricing logic, and even what they count as fantasy revenue. Small differences in exchange-rate timing, whether entry-fee rake is grossed up, and how promotions are treated can move the total by a noticeable amount.
In our build, the biggest gap drivers are usually how ARPU is formed (entry-fee frequency and rake behavior across peak sports months), whether subscription tools and ad-supported play are counted consistently, and how country totals are blended across the US, Canada, and Mexico. The model is also sensitive to refresh cadence when a new season shifts contest volumes, and those update points can change the latest year more than the long-term CAGR.
Benchmark comparison
| Source | Market Size | Gaps in Research Methodology |
|---|---|---|
| Mordor Intelligence | USD 13.09 B (2025) | |
| Trade Journal A | USD 11.70 B (2023) | Uses an earlier base year and typically reports a tighter revenue scope, which can undercount premium tools and ad-supported formats when the focus stays on paid contest activity. |
| Industry Brief B | USD 21.46 B (2028) | Forward-year figure is more sensitive to optimistic ARPU progression and faster legalization assumptions, with less visibility on how currency timing and promotion-heavy periods are normalized. |
The spread is mainly explained by how often the inputs are refreshed and how entry-fee economics are translated into yearly revenue, which is why the cadence of assumption updates and currency timing checks are built into the workflow used by Mordor Intelligence. When the same scope rules and pricing steps are applied year by year, the estimate becomes easier to trace back to participation, contest activity, and monetization drivers that can be repeated.


Key Questions Answered in the Report
How large is the North America fantasy sports market in 2026?
The market stands at USD 14.77 billion in 2026 and is forecast to reach USD 27.01 billion by 2031.
Which fantasy sports type grows the fastest?
Daily/Weekly Fantasy and Ancillaries expand at 13.82% CAGR, outpacing season-long formats.
Why are customer acquisition costs rising?
A duopoly marketing spend surpassing USD 1.2 billion annually has pushed average CAC to USD 300–350 per user.
Which platform holds the majority of user activity?
Mobile applications account for 76.05% of 2025 usage and are projected to grow at 13.9% CAGR.
What geographic area presents the highest growth rate?
Canada is set to expand at 14.05% CAGR through 2031, driven by provincial regulatory openings.
How will micro-betting influence revenue models?
Hybrid micro-betting grows at 14.2% CAGR, adding live, low-value wagers that deepen ARPU without cannibalizing entry fees.
Page last updated on:






