
North America Facility Management Market Size and Share
Market Overview
| Study Period | 2020 - 2031 |
|---|---|
| Forecast Data Period | 2026 - 2031 |
| Base Year Market Size (2025) | USD 455.95 Billion |
| Market Size (2026) | USD 470.04 Billion |
| Market Size (2031) | USD 547.29 Billion |
| Growth Rate (2026 - 2031) | 3.09% CAGR |
| Market Concentration | Medium |
Major Players *Disclaimer: Major Players sorted in no particular order Image © Mordor Intelligence. Reuse requires attribution under CC BY 4.0. | |
North America Facility Management Market Analysis by Mordor Intelligence
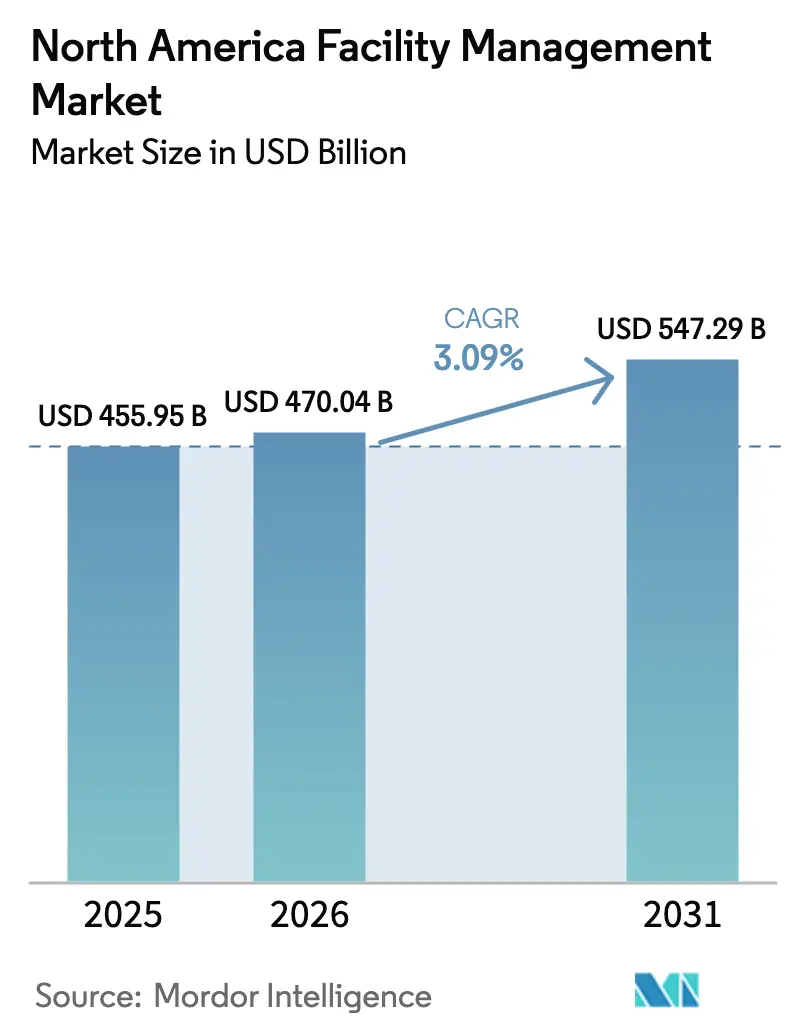
The North America facility management market size was valued at USD 455.95 billion in 2025 and estimated to grow from USD 470.04 billion in 2026 to reach USD 547.29 billion by 2031, at a CAGR of 3.09% during the forecast period (2026-2031). This expansion traces back to steady infrastructure modernization, stringent regulatory compliance, and rapid technology infusion that are reshaping service delivery across the region. Hard services remain the bedrock as mechanical, electrical, and plumbing (MEP) assets age, whereas soft services gain momentum thanks to heightened hygiene, sustainability, and security expectations. A decisive turn toward outsourcing is visible as enterprises protect core competencies while transferring non-core, capital-intensive tasks to specialized vendors. Coupled with hybrid-work policies and accelerating ESG mandates, these dynamics anchor a resilient, yet maturing North America facility management market.
Key Report Takeaways
- By service type, hard services commanded 58.72% market share of the North America facility management market in 2025, while soft services exhibit the fastest advance at a 4.08% CAGR through 2031.
- By offering type, outsourced models held 65.34% of the North America facility management market size in 2025 and are projected to expand at 4.96% CAGR to 2031.
- By end-user, the commercial segment captured 39.61% of the North America facility management market share in 2025; institutional and public infrastructure is poised for the steepest climb at 5.94% CAGR to 2031.
- By country, the United States retained 79.88% of the North America facility management market in 2025, whereas Mexico is forecast to register the highest 5.55% CAGR through 2031.
Note: Market size and forecast figures in this report are generated using Mordor Intelligence’s proprietary estimation framework, updated with the latest available data and insights as of 2026.
North America Facility Management Market Trends and Insights
Drivers Impact Analysis*
| Driver | (~) % Impact on CAGR Forecast | Geographic Relevance | Impact Timeline |
|---|---|---|---|
| Increasing Infrastructure Development | +0.8% | North America, with stronger impact in Mexico and Canada | Medium term (2-4 years) |
| Rising Outsourcing in Building Management | +0.6% | Global, with highest penetration in United States | Short term (≤ 2 years) |
| Heightened Safety and Security Needs | +0.5% | North America, driven by regulatory changes | Short term (≤ 2 years) |
| Technological Advancements in Facility Management | +0.4% | Global, with early adoption in United States | Medium term (2-4 years) |
| Sustainability & ESG Compliance Pressures on Building Operations | +0.3% | North America, with regulatory focus in Canada | Long term (≥ 4 years) |
| Hybrid-Work Models Driving Demand for Flexible FM Solutions | +0.2% | North America, concentrated in commercial sectors | Short term (≤ 2 years) |
| Source: Mordor Intelligence | |||
Increasing Infrastructure Development
Federal, state, and provincial mandates across the region elevate building performance thresholds, pushing asset owners to retrofit outdated HVAC, life-safety, and electrical systems. The U.S. General Services Administration’s 2024 P100 standards strengthen sustainability and resiliency criteria for federal properties, setting a template for private portfolios.[1]U.S. General Services Administration, “2024 P100, Facilities Standards,” gsa.gov Mexico’s push to accommodate nearshoring-driven industrial expansion offsets political budget constraints yet sustains demand for high-spec logistics and assembly space. In Canada, harmonized construction codes aimed at meeting climate targets are amplifying energy-efficiency retrofits. Hard-service contractors with deep MEP expertise are consequently seeing stable recurring revenue streams, while technology-enabled monitoring platforms reinforce compliance and extend asset life cycles within the North America facility management market.
Rising Outsourcing in Building Management
Corporate boards increasingly frame FM as a strategic lever rather than a commodity cost center. ABM Industries secured more than USD 1 billion in new contracts during 2024 as clients prioritized integrated offerings that limit vendor sprawl and guarantee single-point accountability. Bundled hard-plus-soft contracts improve economies of scale and often embed outcome-based KPIs tied to safety, uptime, and energy targets. For healthcare, vendor-neutral strategies such as Medxcel’s generated USD 104 million savings over three years by fine-tuning in-house resources and third-party spend. As a result, the outsourced slice of the North America facility management market is widening, with providers that can demonstrate transparent performance reporting and digital toolsets attracting multi-year, multi-site deals.
Heightened Safety and Security Needs
Regulatory shifts intensify cost-of-compliance pressures. OSHA’s forthcoming Heat Injury and Illness Prevention rule obliges employers to formalize mitigation plans, which cascade directly into new service scopes for FM providers in construction, manufacturing, and logistics.[2]OSHA, “Heat Injury and Illness Prevention in Outdoor and Indoor Work Settings,” osha.gov The revised Hazard Communication Standard additionally obliges refreshed chemical labeling and documentation, nudging cleaning and maintenance contracts toward higher technical rigor. Schools and universities are installing advanced surveillance, access control, and space-reconfiguration solutions to strengthen situational awareness while preserving learning environments. Vendors capable of integrating physical security with building automation and data analytics are, therefore, gaining a competitive edge in the North America facility management market.
Technological Advancements in Facility Management
AI, IoT, and edge-enabled platforms now underpin predictive maintenance, asset tracking, and energy optimization across varied property types. Case studies on HVAC systems show 73% downtime reduction and 4% energy gains after AI analytics deployment.[3]ESP International Journal of Advancements in Science & Technology, “AI-Driven Predictive Maintenance in HVAC Systems,” espjournals.org Smart-building nodes are projected to grow to 115 million installations by 2026, expanding the data universe for continuous commissioning and fault detection. Industrial leaders such as Eaton have leveraged Factory Insights-as-a-Service to boost overall equipment effectiveness by up to 15% across more than 200 plants. In the North America facility management market, service providers that bundle robust cybersecurity and scalable cloud architectures with their mobile workforce applications position themselves as indispensable partners for asset owners.
Restraints Impact Analysis*
| Restraint | (~) % Impact on CAGR Forecast | Geographic Relevance | Impact Timeline |
|---|---|---|---|
| Security concerns over device and network vulnerabilities | -0.4% | North America, with heightened focus in United States | Short term (≤ 2 years) |
| High costs of advanced tech and skilled labor | -0.3% | Global, with acute impact in Canada and United States | Medium term (2-4 years) |
| Fragmented State-Level Labor Regulations Increasing Compliance Burden | -0.2% | United States, with varying impact across states | Medium term (2-4 years) |
| Limited Digital Maturity among Small & Mid-Sized FM Providers | -0.2% | North America, concentrated in mid-market segments | Long term (≥ 4 years) |
| Source: Mordor Intelligence | |||
Security Concerns Over Device and Network Vulnerabilities
Cyberattacks on BMS and IoT endpoints expose life-safety, HVAC, and access-control layers to potential sabotage, with 27% of facility managers reporting incidents over the past year. Insurance premiums for cyber coverage in critical infrastructure have spiked, further delaying large-scale rollouts. Healthcare and government campuses, sitting on sensitive data and mission-critical systems, demand end-to-end encryption, zero-trust frameworks, and 24/7 threat monitoring, raising barriers for smaller FM providers and elongating sales cycles across the North America facility management market.
High Costs of Advanced Tech and Skilled Labor
Skilled-trade wage escalations continue, with construction pay rising 4.4% in 2024 and forecast to remain above historical averages. Simultaneously, refrigerant phase-outs under EPA guidelines inflate replacement costs, with R-410A volatility squeezing HVAC budgets. These dynamics pressure service margins and elevate bid prices, especially for mid-size FM firms with limited economies of scale. Although technology promises lifecycle savings, upfront capex still deters prospective adopters, moderating overall growth velocity in the North America facility management market.
*Our forecasts treat driver/restraint impacts as directional, not additive. The impact forecasts reflect baseline growth, mix effects, and variable interactions.
Segment Analysis
By Service Type: Hard Services Sustain the Market Core
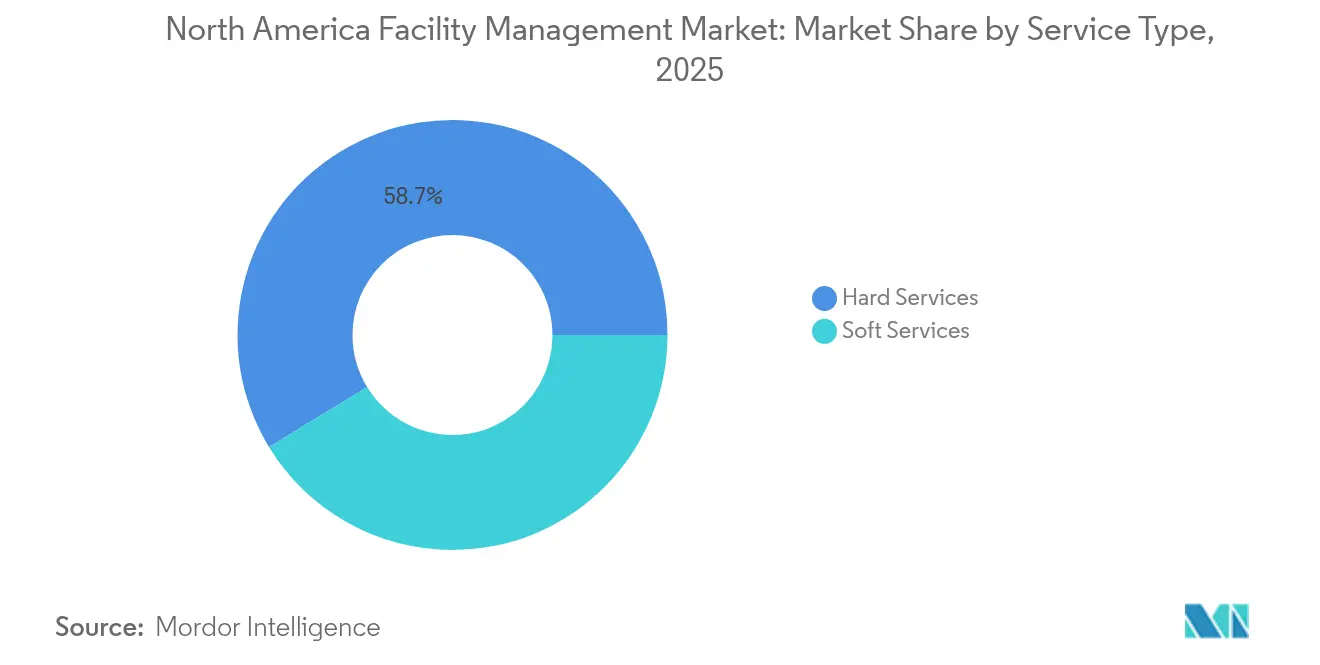
Hard services account for 58.72% of the North America facility management market in 2025 and progress in lock-step with overall expansion at a 3.09% CAGR to 2031. This branch anchors operational continuity through disciplined MEP upkeep, fire-safety compliance, and structural asset preservation. Widespread building-system obsolescence and code updates around energy and life-safety create predictable demand for retrofit programs, condition-based monitoring, and asset-lifecycle planning.
Soft services, although smaller, rise faster at a 4.08% CAGR driven by wellness, security, and concierge expectations. Elevated indoor-air-quality protocols and health-security certifications fuel premium cleaning packages. Office support and front-of-house roles increasingly integrate smart-locker and visitor-management technologies, broadening scope. This divergence positions integrated suppliers to cross-sell soft-service innovations while defending recurring hard-service annuities, thereby enhancing wallet share inside the North America facility management market.


By Offering Type: Outsourced Partnerships Outpace In-house Models
Outsourcing commands 65.34% of the North America facility management market size in 2025 and is slated for 4.96% CAGR growth through 2031. C-suite leaders view integrated FM partnerships as accelerators of operational resilience, tapping provider scale for 24/7 coverage, multi-trade expertise, and investment in cutting-edge platforms. Single-provider governance reduces audit complexity and embeds performance-based incentives, a popular feature across data-center, aviation, and pharma portfolios.
Conversely, in-house delivery retains 34.66% share. Healthcare systems and high-security government installations often preserve direct staff for immediate patient or mission mandates. Still, these operators increasingly pursue hybrid models, outsourcing specialized tasks—like vertical transportation or energy analytics—while retaining custodial or biomedical engineering roles. Cost parity analyses repeatedly tip the balance toward external expertise where asset mix is diverse, underpinning the steady drift toward outsourcing in the North America facility management market.
By End-user Industry: Commercial Dominance Meets Institutional Upswing
Commercial estates—encompassing corporate offices, retail chains, and omnichannel warehouses—held 39.61% of North America facility management market share in 2025. Adaptive-reuse projects and coworking conversions sustain FM volume as landlords right-size footprints yet heighten amenity packages. Smart-locker support, tenant-experience apps, and demand-controlled ventilation are now standard contract inclusions.
Institutional and public-infrastructure properties, while smaller, register a brisk 5.94% CAGR on the back of multi-billion-dollar school and transit modernization programs. Deferred-maintenance backlogs create robust pipelines for roofing, envelope, and mechanical replacements. Healthcare campuses sustain steady activity as regulatory bodies tighten infection-control and emergency-preparedness requirements. Industrial/manufacturing plants cushion cyclical risk, integrating predictive-maintenance suites and energy-optimization audits to maintain uptime. Collectively, these varied demand nodes strengthen diversification, limiting downside risk for the North America facility management market.
Geography Analysis
The United States dominates with 79.88% share of the North America facility management market and benefits from extensive real-estate stock, entrenched outsourcing culture, and a deep vendor ecosystem. Federal incentives such as the Section 179D tax deduction inject fresh capex into energy-efficient retrofits, while the GSA’s new P100 standards raise the bar for performance outcomes. Major providers like EMCOR Group, forecasting up to USD 16.9 billion revenue in 2025, leverage nationwide branch networks to serve multi-site clients. Early AI-driven FM adoption and a large base of mission-critical campuses ensure sustained technology investment.
Canada contributes a moderate slice yet sees policy-driven tailwinds. Harmonized energy codes and carbon-reporting schemes force deep-retrofit projects, opening avenues for providers versed in ESG analytics. Labor-code amendments banning replacement workers from June 2025 heighten contingency-planning demand, and provincial facility-temperature rules add operational complexity. Market participants thus favor partners offering workforce-management agility and bilingual service desks, bolstering the North America facility management market.
Mexico presents the fastest 5.55% CAGR owing to nearshoring as manufacturers localize supply chains closer to U.S. consumption zones. New industrial parks in Bajío and northern corridors require construction quality oversight, commissioning, and ongoing technical FM. While federal budget constraints temper public-sector outlays, private equity pours capital into logistics warehouses and assembly plants, creating greenfield opportunities. FM suppliers that can deploy bilingual technicians and align with international EHS standards stand to capture share and diversify risk across the broader North America facility management market.
Regulatory Landscape
Facility management in North America operates in a layered compliance environment spanning worker safety, building energy performance, and connected-building security. In the United States, OSHA initiatives such as the forthcoming Heat Injury and Illness Prevention rule and updates to the Hazard Communication Standard increase documentation, training, and monitoring requirements, which flow into FM scopes for industrial, logistics, and institutional sites. On the building-performance side, ASHRAE 90.1-2022 (and equivalents) has been adopted in multiple states, pushing energy-code driven retrofit activity toward grid-interactive controls and measurable load management. New York City Local Law 97 also establishes a penalty framework for carbon exceedances, which elevates demand for emissions data, operational tuning, and retrofit execution support.
Technology compliance is tightening as building systems digitize, adding expectations that FM providers address through procurement, commissioning, and ongoing operations. In July 2026, smart-HVAC related requirements highlighted by UL 6300-2026 and CPSC actions referencing DOE efficiency standards and NIST cybersecurity baselines reinforced the need for energy monitoring and secure device deployment, raising the bar for integrators and maintenance teams managing connected HVAC and controls. At the same time, the lack of a single US federal privacy law for building or occupancy data sustains a fragmented state and municipal policy landscape, increasing contracting and governance complexity for IoT-enabled workplace and security solutions across multi-state portfolios.
Value Chain Analysis
The North America facility management value chain begins with asset owners and occupiers defining service scope, including hard services such as MEP/HVAC and fire systems, and soft services such as cleaning and security. Delivery is then sourced through in-house teams or outsourced providers, and executed through on-site technicians, subcontractors, and centralized operations centers. Large integrated facility management providers such as CBRE and JLL increasingly sit at the orchestration layer, bundling workplace management with portfolio services like lease administration and transaction management, and standardizing performance reporting across multi-site contracts. Procurement and service delivery are also shaped by energy-code and sustainability requirements, with ASHRAE 90.1-2022 style load-management language appearing in upgrade specifications for HVAC and controls.
Upstream, the delivery stack depends on OEMs and controls ecosystems (for example Honeywell, Siemens, Johnson Controls, Schneider Electric, and Cisco) and the interoperability between building automation systems and enterprise software. The digital layer includes IWMS/CMMS and workflow platforms used to manage work orders, assets, and compliance documentation (commonly including ServiceNow, IBM, FM: Systems, and Archibus by Eptura). Digital-twin and predictive maintenance programs then combine BIM datasets (often Autodesk-origin) with live IoT sensor feeds to shift maintenance planning from time-based schedules toward condition-based interventions. Downstream, value capture concentrates in providers that can integrate multi-vendor device data, run secure remote monitoring, and translate analytics into field execution across hard and soft service lines.
Competitive Landscape
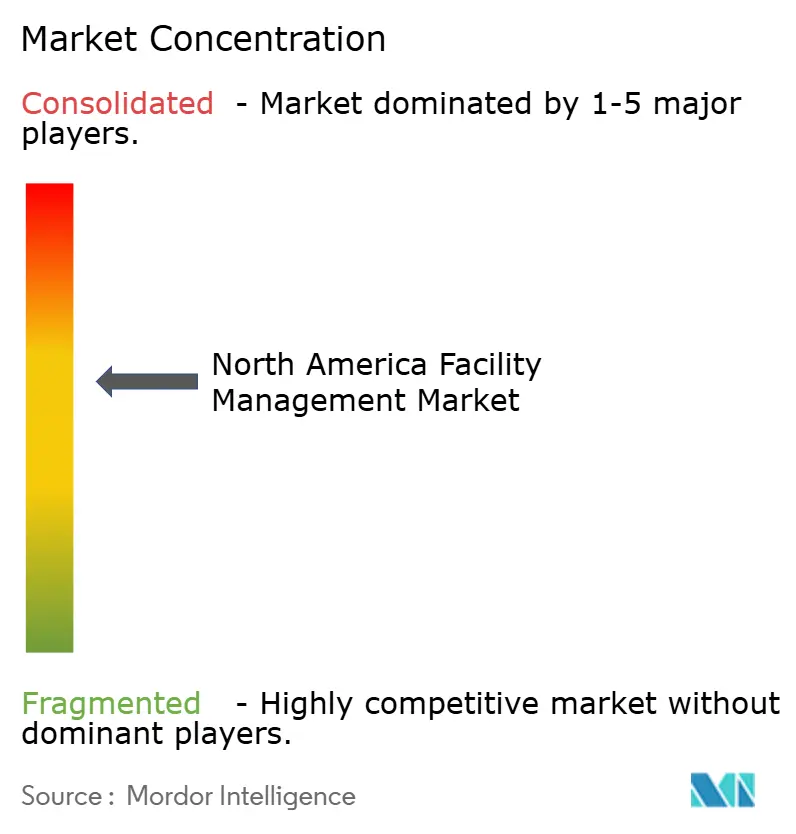
The North America facility management market is moderately consolidated: the five largest vendors hold an estimated 45-50% combined revenue, providing scale economies yet leaving room for regional specialists. EMCOR Group tops the table with USD 14.57 billion revenue in 2024 and backlog growth of 14.2%, underscoring a balanced mix of construction and services. ABM Industries, meanwhile, expanded its data-center footprint via the USD 119 million acquisition of Quality Uptime Services to deepen mission-critical domain knowledge. International conglomerates such as ISS and Compass Group continue to evolve through digital investments, targeting AI enabled help-desks and robotic floor-care to enhance labor productivity.
Technology innovation constitutes the primary differentiator. Providers rapidly embed IoT sensors, real-time CMMS, and analytics dashboards to deliver condition-based maintenance and greenhouse-gas reporting. Patent filings in demand-responsive heat pumps and autonomous inspection drones signal an arms race to capture high-margin smart-service niches. Elsewhere, partnerships between vendors and prop-tech start-ups accelerate rollouts of workplace-experience applications that integrate access control, environmental monitoring, and mobile concierge features.
M&A remains a central growth lever. Construction Briefing anticipates a surge in contractor consolidation during 2025 as founders seek succession exits and private-equity dry powder converts to platform plays. Such roll-ups aim to expand geographic scope, add specialty trades, and unlock cross-selling of bundled FM packages. For buyers, immediate synergies stem from shared procurement, centralized scheduling, and unified data platforms-all pillars that can amplify competitiveness in the North America facility management market.
North America Facility Management Industry Leaders
CBRE Group, Inc.
Emeric Facility Services Llc
JLL (Jones Lang LaSalle IP, Inc.)
Cushman and Wakefield PLC
SMI Facility Services
- *Disclaimer: Major Players sorted in no particular order

Market Opportunities and Future Outlook
A primary opportunity area is tech-led integrated FM that converts fragmented, multi-vendor portfolios into standardized service delivery with measurable outcomes. Enterprise clients are consolidating vendors to reduce governance overhead and enforce portfolio-wide SLAs, which creates room for providers to combine hard and soft services with interoperable data platforms and cybersecurity-aligned connected-building operations. Evidence of this shift includes major IFM players expanding digital and analytics capabilities, including JLL deploying platforms such as Asset Beacon and Azara for AI-enabled asset decision support. Client-facing emphasis on occupancy and utilization measurement in technical spaces (labs, data centers, and manufacturing) also supports procurement decisions tied to uptime and energy performance.
Regulatory and code-linked building performance requirements also open a sustained retrofit and operational-optimization pipeline that FM providers can productize into recurring contracts. Adoption of ASHRAE 90.1-2022 style provisions in multiple US states, alongside carbon-penalty regimes such as NYC Local Law 97, supports demand for continuous commissioning, submetering/monitoring, and verified reporting tied to energy and emissions outcomes. At the same time, mid-market FM firms with limited digital maturity create partnership and acquisition targets for scaled providers looking to extend coverage and add specialized capabilities, including secure IoT management, outcome-based KPIs, and multi-site performance dashboards, without relying only on greenfield contract wins.
Recent Industry Developments
- July 2026: Expanded a multi-year global contract with Rolls-Royce to include Lease Administration and Transaction Management, leveraging IoT sensors and AI-powered analytics. The expansion strengthens JLL's role in strategic FM across mission-critical assets and demonstrates AI/IoT-enabled lease and transaction management integration, with potential profitability impact on flagship client operations.
- June 2026: Launched Experience by Industrious, a hospitality-focused facility management service targeting corporate headquarters and office operations. The move directly enhances CBRE's FM offerings in office and hybrid-work environments and expands occupancy experience and asset utilization through cross-selling with data analytics platforms.
- May 2026: Released the Global Occupancy Planning Benchmark Report 2026 highlighting utilization tracking for technical spaces in North American portfolios. The report provides market intelligence on occupancy planning and space utilization and anchors JLL's thought leadership in data-driven occupancy management, supporting client negotiations for optimized space and service mix.


Research Methodology Framework and Report Scope
Market Definition and Coverage
This market covers spending on outsourced and in-house facility management services used to operate, maintain, and support buildings and sites across the United States, Canada, and Mexico, including hard and soft service delivery tied to occupied assets.
Scope exclusions: We exclude pure construction and fit-out project revenue that is not part of ongoing or contracted facility operations and maintenance.
Segmentation Overview
- By Service Type
- Hard Services
- Asset Management
- MEP and HVAC Services
- Fire Systems and Safety
- Other Hard FM Services
- Soft Services
- Office Support and Security
- Cleaning Services
- Catering Services
- Other Soft FM Services
- Hard Services
- By Offering Type
- In-house
- Outsourced
- Single FM
- Bundled FM
- Integrated FM
- By End-user Industry
- Commercial (IT and Telecom, Retail and Warehouses)
- Hospitality (Hotels, Eateries, Large-scale Restaurants)
- Institutional and Public Infrastructure (Govt, Education, Transportation)
- Healthcare (Public and Private Facilities)
- Industrial and Process (Manufacturing, Energy, Mining)
- Other End-user Industries (Multi-housing, Entertainment, Sports and Leisure)
- By Country
- United States
- Canada
- Mexico
Data Sources, Market Sizing, and Validation
Desk Research
Desk research was used to set the demand backdrop and to anchor the model to observable activity in North America. We reviewed public and official sources such as the U.S. Bureau of Labor Statistics (employment and wages for cleaning, security, and building maintenance roles), the U.S. Energy Information Administration (commercial building energy use and electricity price trends), the U.S. Census Bureau (construction spending and building permits as context for the addressable stock), Statistics Canada (labor and business activity releases), Mexico INEGI (economic activity indicators), and U.S. General Services Administration guidance for federal buildings.
On the supply side, we cross-checked service mix and pricing direction using company annual reports, SEC filings, investor presentations, and reputable association pages and press coverage that discuss cleaning protocols, security needs, and MEP upkeep cycles. Select paid subscriptions were used for company financials and news screening, plus patent and tender monitoring when they clarified technology adoption and contract flow. The sources listed here are not exhaustive, and we also used other public documents and datasets for data collection, validation, and clarification.
Primary Interviews and Surveys
Primary work centered on interviews and short surveys with facility managers, outsourced service providers, and procurement and operations leaders across the United States, Canada, and Mexico. The respondent input helped confirm how hard and soft services are bundled, how outsourcing share changes by end-user setting, and which price escalators and staffing constraints are showing up on contracts.
Distribution of primary research fieldwork respondents
| Company type | Respondent position | Region |
|---|---|---|
| Top tier: 33% | CXOs: 19% | |
| Mid tier: 46% | Functional/Unit leaders: 24% | |
| Smaller Players: 21% | Managers: 57% |
Market-Sizing & Forecasting
Sizing starts with a top-down build where a building operations demand pool is reconstructed from occupied space and activity in key end-user settings, and then translated into serviceable spend using typical service frequency and labor intensity. We then corroborate totals with selective bottom-up approximations, including sampled contract values by service line, observed outsourcing ratios, and a check on implied revenue per worker against publicly available wage and productivity signals.
Key inputs used in the model include the level and change in commercial and institutional occupancy, outsourcing penetration by end-user environment, hard services intensity driven by asset age and MEP maintenance cycles, soft services frequency shaped by hygiene and security protocols, and wage inflation for frontline roles that moves contract pricing. For forecasting, we ran scenario analysis around occupancy and outsourcing trends, followed by smoothing of service price escalators to keep year-to-year shifts realistic. Where direct bottom-up coverage is thin for smaller providers, we applied calibrated uplift factors based on primary feedback and regional service fragmentation, and then re-checked these against the top-level demand indicators.
Data Validation & Update Cycle
Outputs are validated through triangulation across independent signals, including implied spend per square foot, implied revenue per facilities worker, and service mix splits that should remain consistent with hard and soft activity patterns. Variance checks are run to flag unusual jumps by country, end-user setting, or offering type, and those flags are reviewed in a second analyst pass before sign-off.
Reports are refreshed annually, with interim updates when material events shift key assumptions, such as regulation affecting building performance, a sharp wage shock, or a visible change in outsourcing behavior. Before delivery, we run a final review pass so clients receive the most current view available at that time.
Mordor Intelligence's North America Facility Management Market Size Compared With Other Published Estimates
Published market values for North America facility management can differ even when the topic label looks the same, because publishers count different service bundles, apply different price escalation paths, and do not always align on what qualifies as facility management revenue.
Key gaps usually come from whether one estimate blends in adjacent project-led activity, how in-house delivery is treated versus outsourced contracts, and how labor cost inflation is converted into pricing over time. The spread also widens when currency timing and the refresh cadence differ, since wage cycles and occupancy recovery do not move evenly across the United States, Canada, and Mexico.
Benchmark comparison
| Source | Market Size | Gaps in Research Methodology |
|---|---|---|
| Mordor Intelligence | USD 455.95 B (2025) | |
| Global Consultancy A | USD 510.00 B (2025) | This figure appears to include more project-style building upgrades and one-time retrofit work alongside recurring FM, which lifts totals in hard services heavy portfolios. |
| Industry Association B | USD 420.00 B (2025) | This estimate likely emphasizes outsourced contracts and understates in-house delivery value, and it also applies a slower service price escalator that reduces the overall spend level. |
One-time retrofit and fit-out revenue sits outside Mordor Intelligence's scope, which is a practical reason some published totals come in higher even when the geography matches. When the same year is held constant and the service basket is kept to recurring operations and maintenance, the remaining differences mostly reflect outsourcing coverage and how wage-driven price changes are carried into the model.


Key Questions Answered in the Report
What is the current size of the North America facility management market?
The North America facility management market size is USD 470.04 billion in 2026, with a forecast to reach USD 547.29 billion by 2031.
Which service type leads the market?
Hard services dominate with 58.72% share in 2025, though soft services are expanding faster at a 4.08% CAGR to 2031.
How significant is outsourcing in the region?
Outsourced delivery represents 65.34% of the market and is projected to grow at 4.96% CAGR, reflecting a strong shift away from in-house models.
Which country shows the fastest growth?
Mexico is the quickest-growing geography, expected to register a 5.55% CAGR through 2031 due to nearshoring and industrial expansion.
What technological trend is most transformative for facilities management?
AI-enabled predictive maintenance and IoT analytics are reducing unplanned downtime by as much as 73% and improving energy performance, making them decisive differentiators for service providers.
How do ESG regulations influence market demand?
Enhanced tax incentives and carbon-reporting rules drive deep retrofits and data-centric reporting, prompting owners to partner with FM firms that can deliver measurable emission reductions and compliance documentation.
Page last updated on:






