
Market Overview
| Study Period | 2020 - 2031 |
|---|---|
| Forecast Data Period | 2026 - 2031 |
| Base Year Market Size (2025) | USD 11.82 Trillion |
| Market Size (2026) | USD 12.92 Trillion |
| Market Size (2031) | USD 20.13 Trillion |
| Growth Rate (2026 - 2031) | 9.28 % |
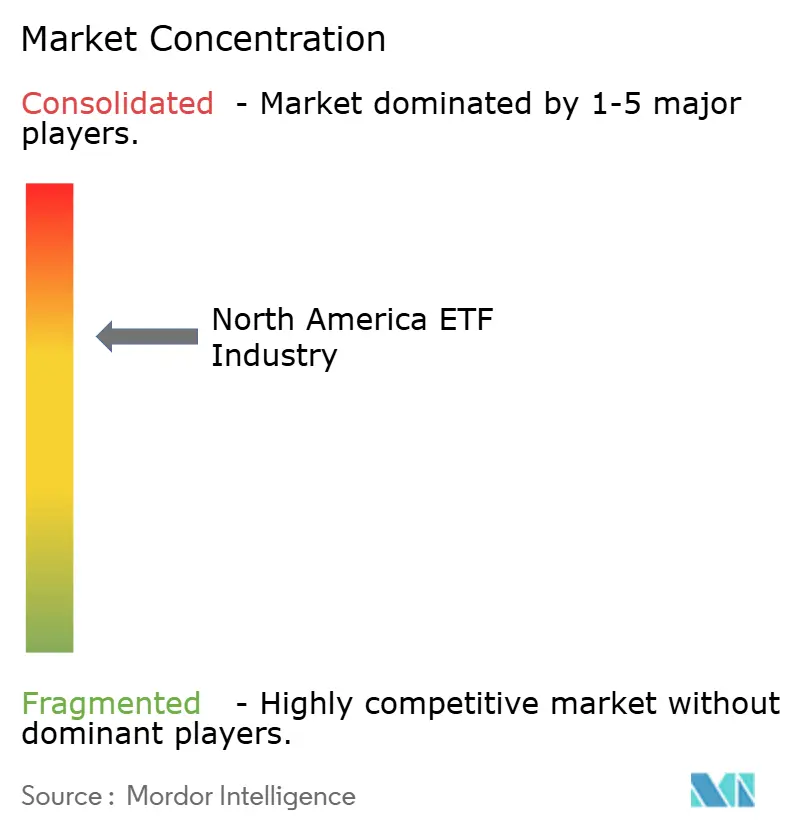
| Market Concentration | Medium |
Major Players *Disclaimer: Major Players sorted in no particular order Image © Mordor Intelligence. Reuse requires attribution under CC BY 4.0. | |
North America ETF Market Analysis by Mordor Intelligence
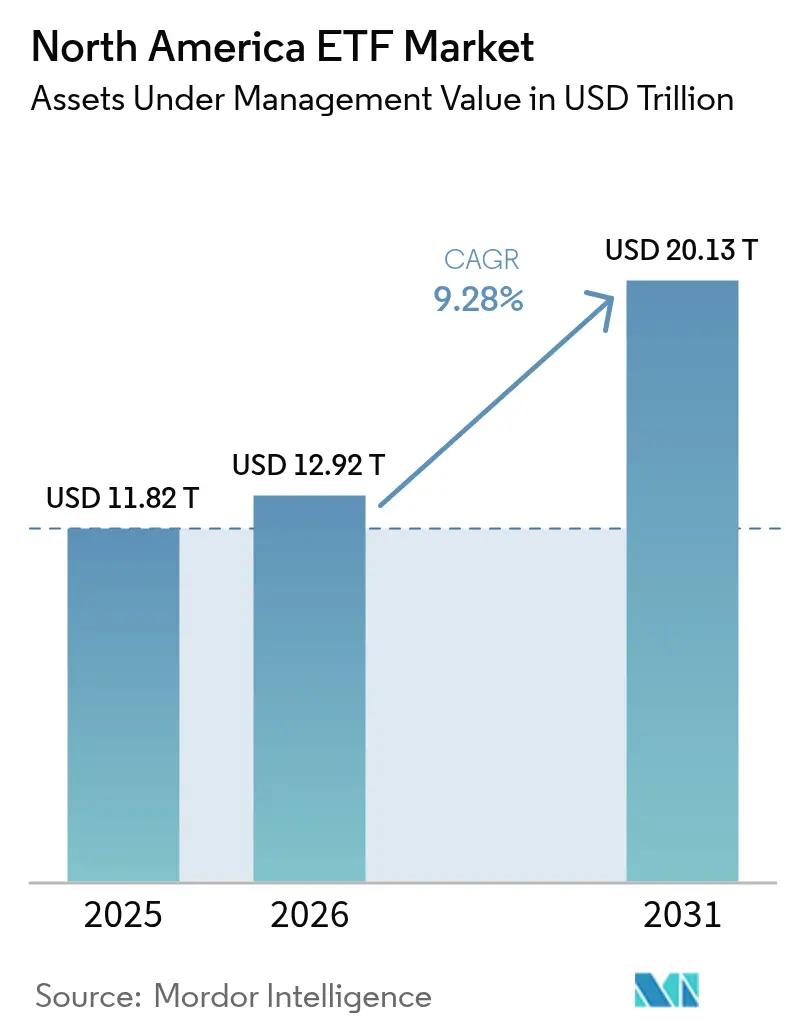
The North America ETF market size was valued at USD 11.82 trillion in 2025 and estimated to grow from USD 12.92 trillion in 2026 to reach USD 20.13 trillion by 2031, at a CAGR of 9.28% during the forecast period (2026-2031). The uptrend mirrors a decisive migration from mutual funds toward lower-cost ETFs, sustained record inflows at the largest providers, and a proliferation of both passive and active strategies. Retail investors, now controlling a 54.4% slice of assets, continue to accelerate adoption through commission-free trading apps that blur the lines between professional and self-directed investing. Active ETFs, though still a fraction of total assets, are growing almost twice as fast as the overall North America ETF market, encouraged by the 2019 SEC ETF Rule 6c-11 and the arrival of non-transparent wrappers. Fixed-income ETFs are the breakout asset class as institutions favor them for liquidity management during volatile conditions. Meanwhile, Mexico’s rapid 12.9% CAGR underscores the nearshoring boom, while competitive fee compression is forcing issuers to lean on innovation rather than cost alone to protect margins.
Key Report Takeaways
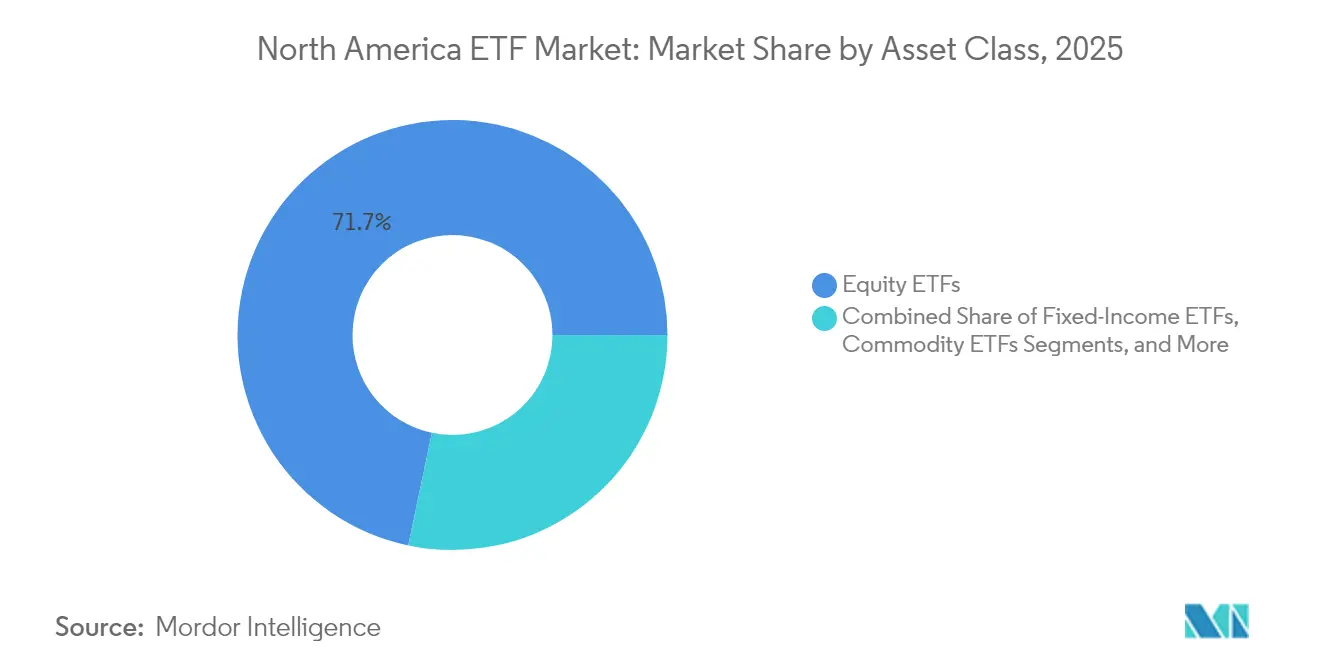
- By asset class, equity retained 71.70% of the 2025 North America ETF market share, while fixed-income products are projected to capture the fastest growth with an 11.34% CAGR through 2031.
- By investment strategy, passive offerings led with 93.20% revenue share of the North America ETF market in 2025, while active ETFs posted the highest 17.77% CAGR through 2031.
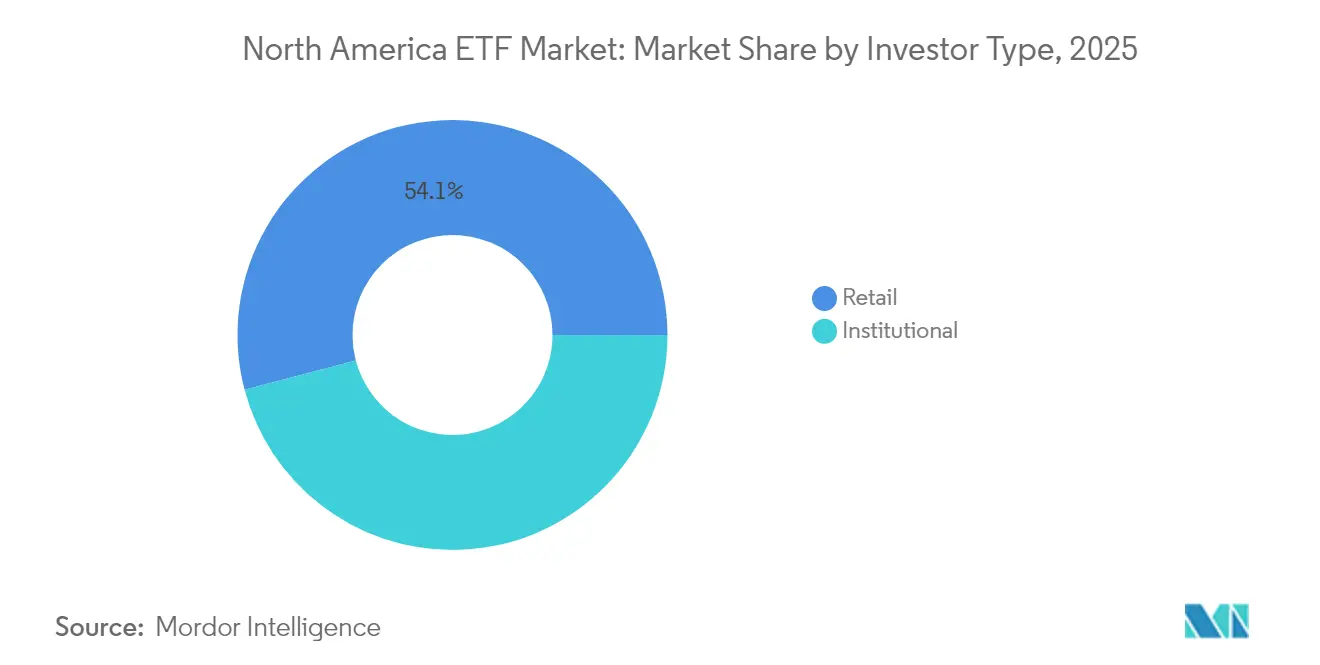
- By investor type, retail investors commanded 54.10% share of the North America ETF market size in 2025 and are expected to outpacing institutions at a 10.52% CAGR.
- By distribution channel, institutional channels held 35.70% of 2025 assets of the North America ETF market, while direct and digital retail platforms are projected to advance at 13.28% CAGR.
- By geography, the United States dominated with 91.70% North America ETF market share in 2025; Mexico is expected to record the strongest 12.53% CAGR.
Note: Market size and forecast figures in this report are generated using Mordor Intelligence’s proprietary estimation framework, updated with the latest available data and insights as of 2026.
Market Trends and Insights
Drivers Impact Analysis of North America ETF Market*
| Driver | (~) % Impact on CAGR Forecast | Geographic Relevance | Impact Timeline |
|---|---|---|---|
| Growth of passive investing among retail investors | +2.3% | United States, Canada, Mexico | Long term (≥ 4 years) |
| Expansion of commission-free trading platforms | +1.8% | United States, Canada | Medium term (2-4 years) |
| Regulatory approval of innovative ETF structures | +1.2% | United States, spillover to Canada | Medium term (2-4 years) |
| Institutional portfolio rebalancing toward fixed-income ETFs | +0.9% | United States, Canada | Short term (≤ 2 years) |
| Rising demand for thematic and ESG ETFs | +1.1% | United States, Canada | Medium term (2-4 years) |
| Accelerated migration from mutual funds to ETFs | +1.7% | United States, Canada, Mexico | Long term (≥ 4 years) |
| Source: Mordor Intelligence | |||
Expansion of Commission-Free Trading Platforms
Zero-commission brokerage models lowered entry barriers, igniting a surge of small-ticket ETF purchases that collectively influence flows. Charles Schwab’s digital platform holds a large trove of ETF assets and now offers advanced portfolio optimizers once reserved for fee-based advisers. A 2025 Amundi poll found 77% of global retail investors—and 68% of those aged over 50—use digital interfaces to transact, demonstrating cross-generation adoption[1]Amundi, “2025 Amundi Retail Investor Survey,” amundi.com. Scale economics from these platforms reinforce fee competition and enhance liquidity, fueling the North America ETF market’s velocity.
Regulatory Approval of Innovative ETF Structures
The SEC’s 6c-11 rule unified the approval pathway, enabling faster product launches and catalytic growth in active ETFs. Non-transparent wrappers let portfolio managers hide daily holdings while preserving in-kind creation and redemption, protecting intellectual property, and sharpening tax efficiency. Since 2020, active ETFs have captured a disproportionate share of net inflows, attracting managers such as Fidelity and T. Rowe Price into the North America ETF market[2]U.S. Securities and Exchange Commission, “Rule 6c-11 Fact Sheet,” sec.gov. The smoother pipeline has shifted legacy mutual fund specialists toward converting entire sleeves into ETFs, broadening competitive depth.
Institutional Portfolio Rebalancing Toward Fixed-Income ETFs
Institutions now use fixed-income ETFs as tactical liquidity sleeves, citing smoother execution during the 2020 volatility episode. Cerulli Associates research indicates that a majority of pension and endowment professionals plan to raise ETF allocations for cash and risk management purposes. These flows have underpinned the growth of bond ETFs, reinforcing their systemic importance in the North America ETF market and improving price discovery within the broader credit ecosystem.
Accelerated Migration from Mutual Funds to Low-Cost ETFs
BlackRock documents reveal ETFs captured a major share of fixed-income flows during 2024, while U.S. mutual funds endured sustained outflows. Vanguard’s 2025 fee cut across 53 ETF classes intensified cost pressure, compelling rivals to follow. J.P. Morgan forecasts significant active ETF AUM growth this decade. This migration underscores the North America ETF market’s structural tailwind, though it also compresses issuer margins and elevates the need for scale.
Restraints Impact Analysis of North America ETF Market*
| Restraint | (~) % Impact on CAGR Forecast | Geographic Relevance | Impact Timeline |
|---|---|---|---|
| Liquidity risks in niche ETFs during market stress events | -0.7% | United States, Canada | Medium term (2-4 years) |
| Potential regulatory tightening on leveraged and inverse ETFs | -0.5% | United States, Canada | Short term (≤ 2 years) |
| Competitive fee wars eroding profitability for ETF issuers | -0.8% | United States, Canada, Mexico | Long term (≥ 4 years) |
| Concentration risk due to the dominance of top sponsors limiting market entry | -0.6% | United States, Canada | Long term (≥ 4 years) |
| Source: Mordor Intelligence | |||
Liquidity Risks in Niche ETFs During Market Stress Events
Specialty ETFs focused on thinly traded assets may trade at steep discounts when volatility spikes. 2020 offered a stress test in high-yield and emerging-market debt segments, where some funds deviated notably from NAV, according to BIS transaction studies[3]Bank for International Settlements, “ETF Liquidity under Stress,” bis.org. Regulators acknowledge ETFs’ role in secondary-market price discovery yet warn of potential fire-sale dynamics in narrow exposures. As the North America ETF market diversifies into concentrated themes, diligence around underlying depth and creation-unit mechanics remains vital, tempering adoption speed for exotic products.
Competitive Fee Wars Eroding Profitability
Fee compression pushed average revenue yields from 9.9 basis points in 2019 to 8.2 basis points in 2023, squeezing smaller sponsors. Vanguard’s February 2025 broad-based cuts sparked another wave of response pricing, illustrating scale advantages. Issuers now seek differentiation through technology, model portfolios, or portfolio construction tools. Persistently low fees can limit reinvestment in research and marketing, potentially slowing product development despite robust demand within the North America ETF market.
*Our forecasts treat driver/restraint impacts as directional, not additive. The impact forecasts reflect baseline growth, mix effects, and variable interactions.
North America ETF Market Segment Analysis
By Asset Class:
Fixed-Income ETFs Outpace While Equity Retains ScaleEquity retained a 71.70% North America ETF market share in 2025, aided by the technology-heavy S&P 500’s resilience. Investors continue to favor broad market, sector, and factor tilts to harness concentrated U.S. mega-cap leadership. Commodity ETFs resurfaced as inflation hedges, real-estate ETFs lagged under higher rates, and alternative strategies—buffer or option-written funds—added defensive features. Collectively, these developments diversify the toolkit's breadth and deepen the North America ETF market’s resilience. Fixed-income products are projected to expand at an 11.34% CAGR between 2026 and 2031, the swiftest among major categories. Bond yields near decade highs and institutional liquidity needs fueled USD flows, propelling the segment to a larger slice of the North America ETF market. Treasury and investment-grade corporate exposures benefit as investors value transparent, all-day liquidity.
Equity inflows remained concentrated in market-cap-weighted vehicles, yet tactical rotations toward semiconductors and clean energy themes added incremental flow. Commodity ETFs saw renewed gold and energy interest during inflation upticks, underscoring multi-asset appetite within the North America ETF market. Real-estate exposures faced valuation pressure but attracted value-oriented investors. Alternative ETFs, such as PGIM’s January 2025 Buffer suite, offer defined outcomes that resonate with investors bracing for volatility shocks. The broader asset-class mosaic keeps the North America ETF market size on a dynamic growth track.


By Investment Strategy:
Active ETFs Challenge the Passive StrongholdPassive vehicles retained a dominant 93.20% North America ETF market share in 2025, propelled by their cost advantage and automatic inclusion in model portfolios. Yet active ETFs are advancing at an 17.77% CAGR, capturing mindshare among advisers seeking alpha and risk management. The North America ETF market size tied to active vehicles is slated to climb meaningfully as converted mutual fund assets migrate into wrapper-efficient formats. Managers highlight bond segments where active security selection can exploit pricing anomalies, creating fertile ground for performance dispersion.
Passive issuers battle on expense ratios and liquidity depth, leading to a commoditization trend in flagship broad-market offerings. Factor-based and smart-beta hybrids blur traditional labels, as do semi-transparent active designs integrating systematic tilts. Success in the North America ETF market increasingly hinges on content, analytics, and adviser partnerships rather than a strict active versus passive dichotomy.
By Investor Type:
Retail Ascendancy Steepens Digital Adoption CurveRetail assets formed 54.10% of the North America ETF market size in 2025 and are compounding at 10.52% through 2031. A large wealth transfer toward Gen-X and millennials amplifies ETF preference due to cost sensitivity and platform familiarity. Amundi research confirms older cohorts are also embracing online access, reflecting cross-demographic traction. Model portfolios, fractional shares, and AI-driven robo-allocations make ETFs the de facto wrapper for diversified exposure.
Institutions continue to deploy ETFs for tactical re-weightings, cash equitization, and overlay strategies. Cerulli Associates finds most pension managers intend to boost ETF usage over the next two years, citing operational efficiency. Convergence is visible as institutions adopt retail-style thematic ideas, while households apply factor filters once unique to quant desks. This blending further enlarges the addressable North America ETF market.
By Distribution Channel:
Digital Platforms Rewrite the Sales PlaybookInstitutional channels held 35.70% of the North America ETF market size in 2025, supported by consultant model endorsements and portfolio overlay mandates. Adviser and wealth-manager segments integrate ETFs within fee-based advice frameworks, driving balanced inflows. Banks and full-service brokers roll out white-label platforms such as Citi Velocity ETFs, slated for a 2025 launch, to retain client assets in-house. Multi-channel strategies ensure broad distribution coverage across the North America ETF market, mitigating any single-channel risk.
Direct-to-consumer portals and online brokerages are projected to grow at a 13.28% CAGR, translating user-experience improvements into tangible flows. Commission-free access, alongside embedded planning tools, entrenches ETFs within daily financial apps. Charles Schwab, Robinhood, and new banking entrants integrate curated ETF lineups, enhancing shelf visibility and reinforcing North America ETF market growth.
Geography Analysis
United States ETF Market
The United States commanded 91.70% North America ETF market share in 2025 and remains the global innovation hub. Record net inflows, boosted by the continued rotation from mutual funds, vaulted U.S. assets to fresh highs. Active fixed-income launches, cryptocurrency futures ETFs, and AI-centric thematic funds showcase the pace of evolution. Policy stability and deep secondary liquidity sustain a vibrant ecosystem that anchors the broader North America ETF market.
Canada ETF Market
Canada’s ETF AUM experienced significant growth over the years, showcasing a notable increase in market size and investor interest. The market distinguishes itself through heavier active ETF penetration, which absorbed 42% of 2024 inflows. Early regulatory clarity allowed Canada to list the world’s first spot Bitcoin ETFs, putting the country at the forefront of crypto experimentation. The favourable framework attracts cross-border listings, expanding the North America ETF market size beyond U.S. borders.
Mexico ETF Market
Mexico, though a fraction of total assets, is the fastest-growing node. A 12.53% CAGR through 2031 reflects nearshoring-driven economic momentum and monetary easing that encouraged domestic equity participation. February 2025 tariff relief and a 50-basis-point rate cut propelled local ETFs like iShares MSCI Mexico (EWW) to notable gains. Limited fund variety today signals white-space opportunity, suggesting a broader spectrum ahead as the North America ETF market targets under-served South American investors.
Regulatory Landscape
In the United States, ETF product innovation continues to be shaped by SEC Rule 6c-11 (the 2019 ETF Rule) and a growing set of exemptive actions that expand allowable structures. In March 2026, the SEC granted conditional exemptive relief under Section 36 of the Exchange Act to permit Multi-Class ETF structures, and NYSE received approval for Rule 5.2(j)(9) to enable generic listing and trading of Class ETF shares tied to that relief. In June 2026, the SEC also sought public comment on ETFs pursuing novel asset classes or novel strategies (File No. S7-2026-24). The comment request suggests tighter attention to the perimeter of permissible ETF exposures while keeping consultation as a route to accommodate innovation.
In Canada, provincial regulators acting through the Canadian Securities Administrators (CSA) advanced a framework refresh focused on ETF-specific mechanics, including secondary market trading and the arbitrage process. The CSA published Consultation Paper 81-409 in June 2025 and extended the comment period to October 31, 2025, emphasizing regulatory calibration around how ETF trading, liquidity, and disclosure interact. Across North America, the direction supports faster product iteration via generic listing pathways and structured exemptions, while increasing scrutiny of complex or novel ETF designs that can amplify liquidity and investor-protection risks.
Value Chain Analysis
The North America ETF value chain starts with index providers and data and analytics inputs, then moves to ETF sponsors and portfolio managers who design exposures and file required disclosures. Fund administration, custody, accounting, and transfer agency services support daily operations, while primary-market liquidity is enabled by Authorized Participants (APs) through written agreements that govern creation and redemption activity. Market makers and national securities exchanges (such as Nasdaq and NYSE Arca) provide continuous secondary-market liquidity and price discovery, and central clearing and settlement infrastructure completes the trade lifecycle.
Regulatory and market-infrastructure changes have reduced time-to-market for certain structures while increasing the importance of operational readiness across participants. In September 2025, the SEC approved generic listing standards for commodity-based trust shares, and in November 2025 it granted accelerated approval for Nasdaq Rule 5703 to permit generic listing and trading of Class ETF Shares, lowering friction for launches that meet standardized criteria. Another operational inflection is the SEC's September 2025 decision to permit in-kind creations and redemptions for crypto asset ETPs, aligning mechanics more closely with traditional ETP workflows. Key bottlenecks remain concentrated in clearing and settlement capacity, especially where fixed-income instruments and T+1 settlement increase reliance on core clearing bank infrastructure and well-capitalized AP networks.
Competitive Landscape
BlackRock (iShares), Vanguard, State Street (SPDR), Invesco, and Charles Schwab collectively dominate the market, showcasing a highly concentrated structure. Vanguard’s low-cost ethos steadily narrows the gap with BlackRock, aided by sustained royalties from passive flagship products. State Street leverages institutional bridges, yet has ceded relative share to new entrants. Recent mutual-fund-to-ETF conversions by Dimensional Fund Advisors and JPMorgan illustrate how legacy asset managers now challenge incumbents within the North America ETF market.
Strategic positioning has diversified. BlackRock invests heavily in its Aladdin risk platform and crypto ETF lineup. Vanguard leans on member-owned governance to reinvest in price leadership. State Street focuses on liquidity advantages in large-cap equity and sector baskets. Schwab expands advisory tech under the Schwab Intelligent Portfolios banner. Invesco and WisdomTree court thematic niches, while PGIM experiments with buffered outcomes. This breadth reflects an urgent race to escape pure-price competition as fee wars intensify.
Issuers increasingly form alliances with fintech start-ups and robo-advisers to widen distribution. White-label manufacturing from firms such as Exchange Traded Concepts lowers barriers for boutique sponsors, while Citi Velocity ETFs aims to accelerate active launches in 2025. Innovation in active fixed-income, ESG reporting tools, and portfolio analytics will shape the next phase of the North America ETF market, as scale alone no longer guarantees differentiation.
North America ETF Industry Leaders
BlackRock, Inc. (iShares)
Vanguard Group, Inc.
State Street Global Advisors (SPDR)
Invesco Ltd.
Charles Schwab Investment Management, Inc.
- *Disclaimer: Major Players sorted in no particular order
North America ETF Market Companies Covered in this Report
- BlackRock, Inc. (iShares)
- Vanguard Group, Inc.
- State Street Global Advisors (SPDR)
- Invesco Ltd.
- Charles Schwab Investment Management, Inc.
- First Trust Advisors L.P.
- WisdomTree Investments, Inc.
- JPMorgan Asset Management
- Goldman Sachs Asset Management
- Franklin Templeton Investments
- BMO Global Asset Management
- PIMCO
- Dimensional Fund Advisors
- ARK Investment Management LLC
- Global X ETFs
- ProShares Advisors LLC
- Direxion Funds
- VanEck Associates Corporation
- Horizons ETFs Management (Canada) Inc.
- TD Asset Management Inc.

Market Opportunities and Future Outlook
Product-structure expansion is creating incremental launch and conversion pathways for managers that historically competed via mutual funds. The SEC's 2026 actions and ongoing review activity around Multi-Class ETF structures, along with industry activity where many mutual fund companies have pursued ETF share-class structures, point to a concrete route for sponsors to translate existing investment processes into ETF wrappers. Using exchange liquidity and in-kind mechanisms, sponsors can standardize more of the conversion work, which opens whitespace for platform providers and service firms to package ETF share-class implementation, AP coverage, and exchange listing readiness into repeatable operating models.
On the demand side, 2026 flow and asset milestones point to a larger implementation role for ETFs in advisor and institutional workflows, with opportunities spanning active fixed-income, systematic active, and outcome-oriented designs rather than only broad beta. U.S. ETF industry assets reached a record level by end-June 2026, and active ETFs represented a sizable portion of first-half 2026 inflows, reinforcing the case for differentiated active lineups and distribution partnerships. Canada also remains a material arena for product and distribution build-out, backed by strong ETF inflows in 2025 and a regulatory consultation track focused on ETF-specific trading and arbitrage features. Mexico remains underpenetrated in variety relative to the demand drivers cited in the report (nearshoring-linked growth and expanding retail participation), leaving room for new listings and locally relevant exposures as issuers broaden their regional shelf.
Recent Industry Developments in North America ETF Market
- July 2026: The Trump Accounts program under the U.S. Treasury selected ETF options from State Street, BlackRock, and Vanguard, with the lineup taking effect July 4. The selection embeds large ETF sponsors into a government-linked savings channel, reinforcing the role of low-cost, liquid ETFs as default building blocks for mass-market investment allocations.
- June 2026: Vanguard launched the Vanguard U.S. High-Yield Corporate Bond Index ETF (VCHY), expanding its lineup in credit-sensitive income exposures. The launch adds another scaled competitor to the high-yield ETF shelf, increasing choice for advisors and self-directed investors using ETFs for yield and portfolio income construction.
- February 2025: Vanguard cut fees across 53 ETF share classes, extending the fee-compression cycle among large sponsors. Lower headline expense ratios increased the pressure on smaller issuers to differentiate through strategy design, liquidity support, and distribution rather than price alone.


North America ETF Market Report Scope and Research Methodology
Market Definition and Coverage
For this study, the North America ETF market is defined as the total assets under management (AUM) held in publicly listed exchange traded funds domiciled in the United States, Canada, and Mexico, reported in USD and tracked across all ETF asset classes.
Scope exclusions: exchange traded notes, closed end funds, and private pooled vehicles are excluded from the market size.
Segments Covered in This Report
- By Asset Class
- Equity ETFs
- Fixed-Income ETFs
- Commodity ETFs
- Currency ETFs
- Real-Estate ETFs
- Alternative ETFs
- By Investment Strategy
- Active
- Passive
- By Investor Type
- Retail
- Institutional
- By Distribution Channel
- Direct and Digital Retail Platforms
- Financial Advisors and Wealth Managers
- Institutional Channels
- Traditional Banks and Full-Service Brokers
- By Country
- United States
- Canada
- Mexico
Data Sources, Market Sizing, and Validation
Desk Research
Desk research was used to build the starting dataset for AUM, flows, product counts, and ETF policy context, then to check whether the model's direction aligned with what the market was signaling over the same periods. We relied on public and official sources such as central bank releases and financial stability notes (for rates and liquidity conditions), securities regulator publications in the US, Canada, and Mexico (for fund rules and disclosures), and national statistics agencies for macro series that influence household savings and risk appetite.
To connect market sizing with issuer and exchange reporting, we reviewed ETF fact sheets and prospectuses, issuer financial filings, exchange websites, and reputable financial press coverage of launches and closures. A paid subscription for company financials and news helped keep issuer-level context current. Separately, a patent database was used only as a light indicator for product innovation themes. The desk sources listed here are not exhaustive, and other public references were used for data collection, validation, and clarification.
Primary Interviews and Surveys
Primary work was used to pressure test the desk assumptions and to fill gaps where public disclosure is not consistent, such as how AUM shifts between active and passive ETFs and how fee levels are changing for new launches. We spoke with a mix of ETF issuers, index and product specialists, exchange participants, and distribution-side stakeholders across the US and Canada, with Mexico included where cross-listing and local adoption topics were relevant.
Distribution of primary research fieldwork respondents
| Company type | Respondent position |
|---|---|
| Top tier: 28% | CXOs: 13% |
| Mid tier: 57% | Functional/Unit leaders: 41% |
| Smaller Players: 15% | Managers: 46% |
Market-Sizing & Forecasting
Market size was modeled mainly through a top-down build that reconstructs total ETF AUM by domicile, using reported end-period AUM and net flow signals for the United States, Canada, and Mexico, then normalized to USD for a consistent view. To keep totals realistic, we backed this with selective bottom-up checks, such as sampling large fund families, multiplying typical AUM by product counts in key categories, and validating the implied growth against channel-level commentary from interviews.
A few market fingerprints were treated as core inputs because they move AUM in visible ways over time. These included net inflows versus market performance contribution, changes in interest rates and bond duration demand (which affects fixed income ETF uptake), the pace of active ETF launches and adoption, fee compression patterns for broad beta products, and country-level savings and retirement allocation trends that shape ETF demand pools. Where issuer disclosures were not comparable, gaps were handled using consistent category definitions and conservative carry-forward logic, then checked through primary feedback.
For forecasting, scenario analysis was used because ETF AUM is sensitive to both flows and market returns, and those can shift quickly between years. The scenarios were anchored on agreed ranges from interview feedback for flows, product launch momentum, and fee trends. The final forecast path was selected when the implied AUM levels stayed consistent with historical scaling patterns.
Data Validation & Update Cycle
Validation was done through triangulation across independent signals so that a single noisy data point did not drive the final result. We compared the modeled AUM totals with country-level ETF statistics, issuer reported AUM ranges, and broad capital market indicators, then investigated variances before locking the numbers.
Anomaly checks were run for sharp jumps in AUM, sudden shifts in flows, and currency translation effects, followed by a second analyst review of assumptions and calculations. Reports are refreshed annually, with interim updates triggered when material events occur, including major rule changes, outsized market drawdowns, or structural shifts in ETF adoption. Before delivery, a final pass is completed so clients receive the latest updated view.
Mordor Intelligence's North America Etf Market Estimate Compared With Other Published Estimates
Published estimates for the North America ETF market can look far apart because groups do not always measure the same thing, even when they use similar market labels. The biggest drivers are usually whether the number represents ETF AUM or industry revenue, whether it is counted by domicile or by listing venue, and the timing of the snapshot used for currency and end-of-period levels.
In this study, the main gap comes from keeping the value strictly tied to ETF AUM for funds domiciled in the US, Canada, and Mexico, while some public figures cite a larger North America domicile total or mix in ETP formats that are not ETFs. This is why the spread shows up, and it reflects a modeling choice applied by Mordor Intelligence.
Benchmark comparison
| Source | Market Size | Gaps in Research Methodology |
|---|---|---|
| Mordor Intelligence | USD 11.82 T (2025) | |
| Industry Data Provider A | USD 14.05 T (2025) | Uses a broader North America domicile AUM total and can include ETP classifications beyond ETFs, which lifts the headline figure versus an ETF-only definition. |
| Trade Association B | USD 10.35 T (2024) | Reports a US-only year-end AUM snapshot for 2024, which is not comparable to a North America total and is also sensitive to the chosen cut-off date and market level. |
The comparison shows that most differences are explainable once the counted geography and the counted instrument set are aligned, and then timing effects become the next largest factor. By keeping the model traceable to domicile based AUM, flows, and repeatable currency timing, we deliver a practical number that can be recreated and checked year over year.


Key Questions Answered in the Report
What is the current size of the North America ETF market?
The North America ETF market size stands at USD 12.92 trillion in 2026 and is projected to reach USD 20.13 trillion by 2031.
Which asset class is growing fastest within ETFs?
Fixed-income ETFs are expanding at an 11.34% CAGR as institutions deploy them for liquidity and rate-sensitive income.
How dominant are retail investors in North American ETFs?
Retail investors hold 54.10% of assets and are growing at a 10.52% CAGR, driven by commission-free digital platforms.
Why are active ETFs gaining ground?
Regulatory streamlining and semi-transparent structures enable managers to protect proprietary strategies while offering ETF cost and tax efficiencies, spurring an 17.77% CAGR for active products.
What is the major risk facing ETF issuers today?
Intensifying fee wars are compressing average revenue yields, pressuring profitability and prompting issuers to focus on product innovation and technology.
Page last updated on:


 Your data is secure and never sold or shared.


