
Market Overview
| Study Period | 2020 - 2031 |
|---|---|
| Forecast Data Period | 2026 - 2031 |
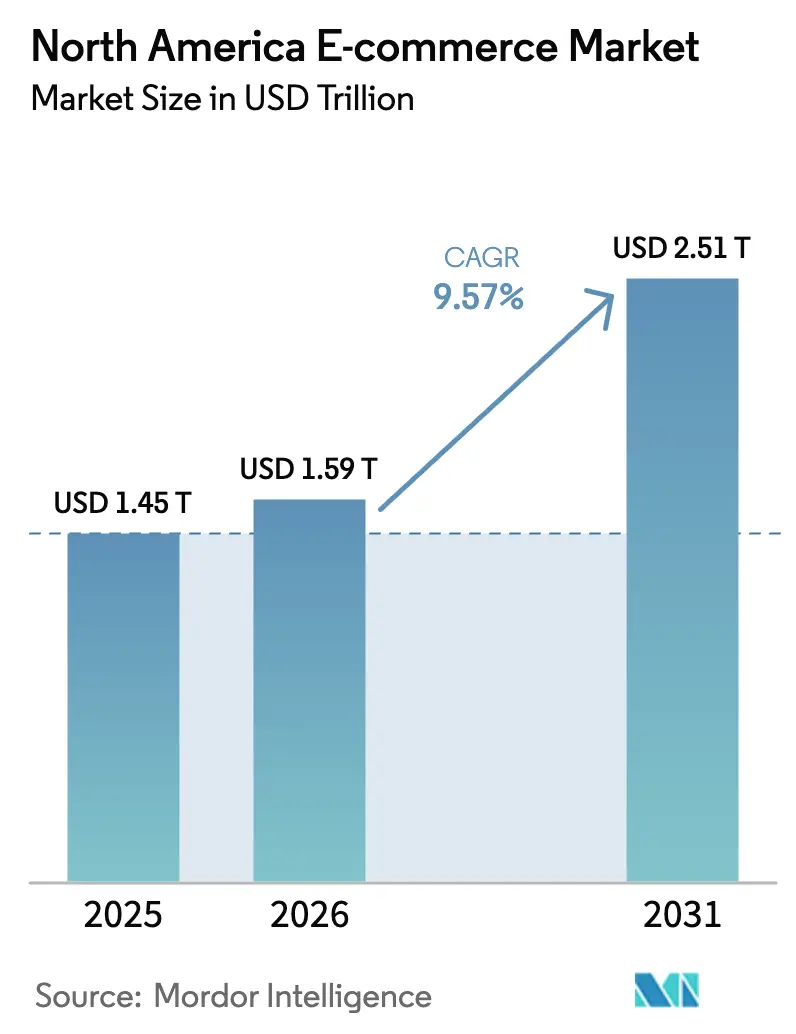
| Base Year Market Size (2025) | USD 1.45 Trillion |
| Market Size (2026) | USD 1.59 Trillion |
| Market Size (2031) | USD 2.51 Trillion |
| Growth Rate (2026 - 2031) | 9.57% CAGR |
| Market Concentration | Medium |
Major Players *Disclaimer: Major Players sorted in no particular order Image © Mordor Intelligence. Reuse requires attribution under CC BY 4.0. | |
North America E-commerce Market Analysis by Mordor Intelligence
The North America E-commerce Market size was valued at USD 1.45 trillion in 2025 and estimated to grow from USD 1.59 trillion in 2026 to reach USD 2.51 trillion by 2031, at a CAGR of 9.57% during the forecast period (2026-2031).
Consumers are shifting large portions of their retail budgets online because the region’s digital infrastructure supports friction-free purchase journeys, rapid fulfillment, and sophisticated data-driven personalization. Competitive pressure has intensified as retailers synchronize in-store inventory with online catalogs, turning omnichannel convenience into the baseline expectation. Investments in last-mile automation, micro-fulfillment nodes, and embedded finance are lowering operational bottlenecks that previously constrained growth. Meanwhile, regulatory change and data-privacy mandates are forcing companies to rebuild consent frameworks so that personalization remains effective without violating emerging rules.
Key Report Takeaways
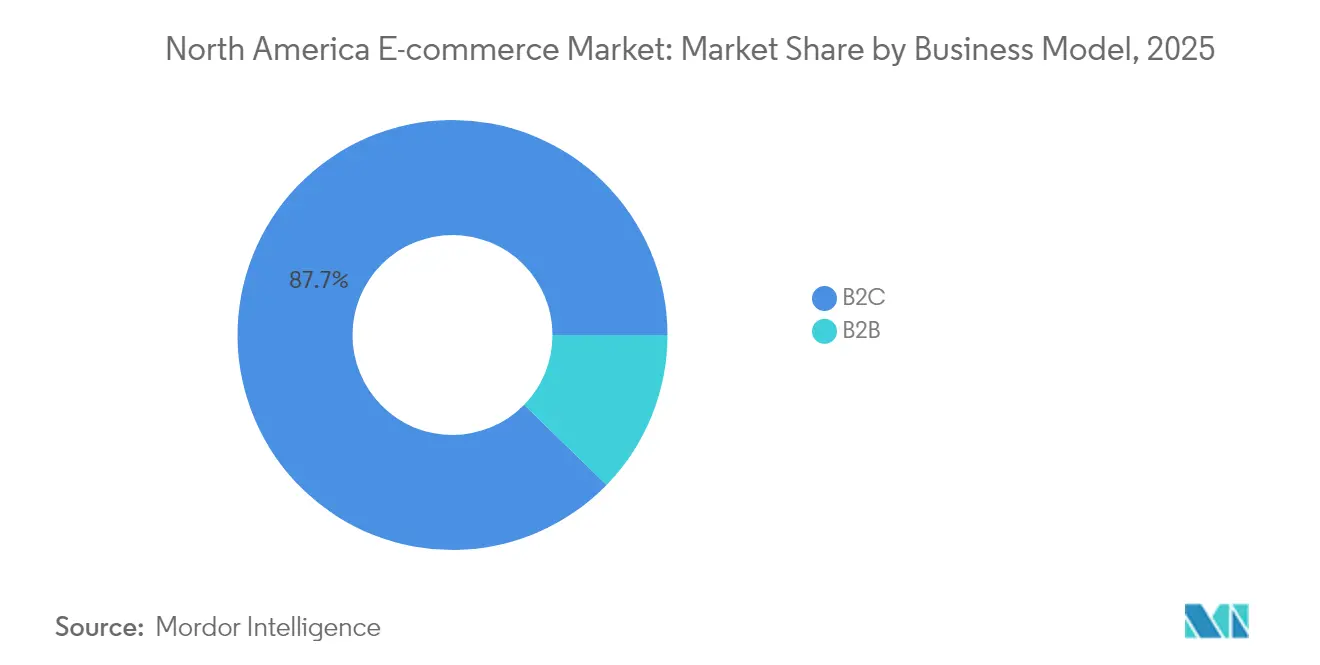
- By business model, the B2C segment held 87.72% of the North America e-commerce market share in 2025, while B2B is projected to register the highest CAGR at 11.84% through 2031.
- By device type, mobile commerce accounted for 71.65% of transactions in 2025 and is advancing at a 10.12% CAGR to 2031.
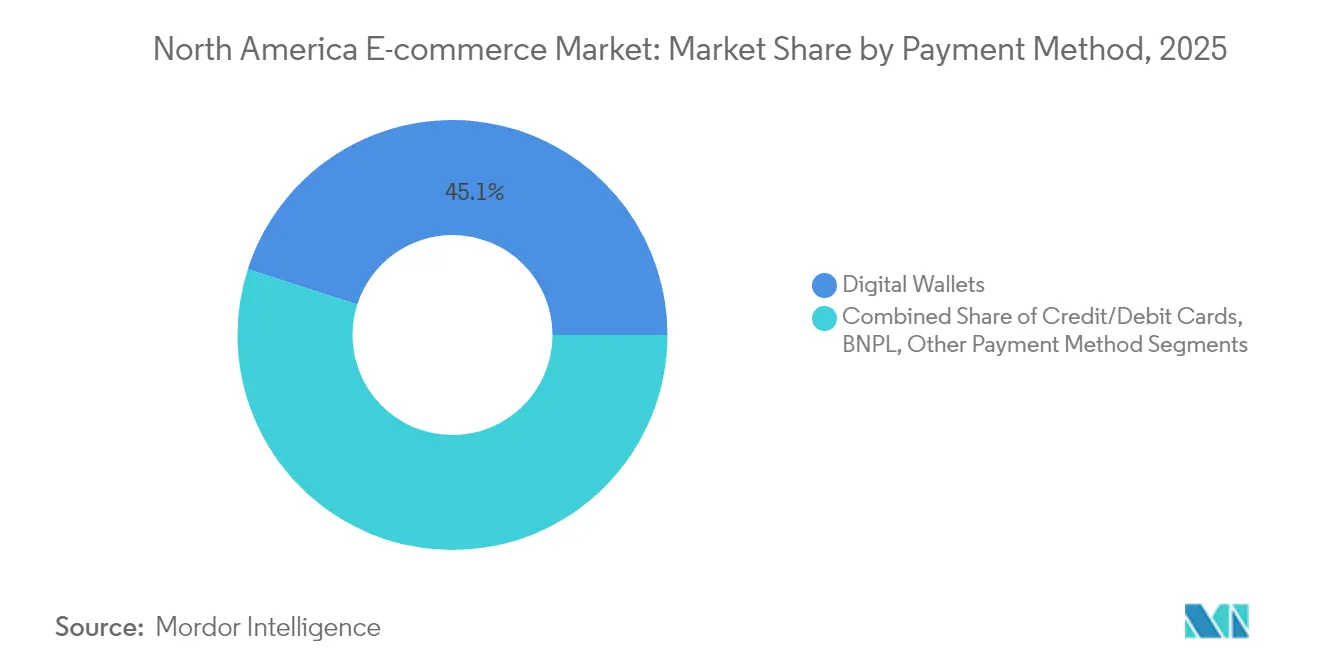
- By payment method, digital wallets captured 45.05% share of the North America e-commerce market size in 2025; Buy Now, Pay Later is set to grow at 15.88% CAGR through 2031.
- By B2C product category, consumer electronics led with 33.62% revenue share in 2025; food and beverages is forecast to expand at a 15.86% CAGR to 2031.
- By geography, the United States dominated with 86.74% share of the North America e-commerce market size in 2025, while Mexico is the fastest-growing territory at a 13.09% CAGR between 2026-2031.
Note: Market size and forecast figures in this report are generated using Mordor Intelligence’s proprietary estimation framework, updated with the latest available data and insights as of 2026.
North America E-commerce Market Trends and Insights
Drivers Impact Analysis*
| Driver | (~) % Impact on CAGR Forecast | Geographic Relevance | Impact Timeline |
|---|---|---|---|
| Mobile-commerce apps with same-day fulfillment | +2.5% | United States major metros; Canadian spillover | Short term (≤ 2 years) |
| Gen-Z BNPL surge | +2.1% | Canada primary; United States secondary | Medium term (2-4 years) |
| USMCA-enabled customs simplification | +1.8% | United States, Canada, Mexico | Medium term (2-4 years) |
| Retail-media networks lifting D2C conversion | +1.7% | United States primary; Canada secondary | Short term (≤ 2 years) |
| Source: Mordor Intelligence | |||
Mobile-commerce apps with same-day fulfillment in U.S. urban centers
Mobile transactions already generate 60% of online sales, and retailers that connect smartphone checkouts to dense micro-fulfillment hubs now deliver thousands of SKUs within hours.[1]Pine Labs Research Team, “Mobile Commerce Share Of E-Commerce Sales In North America,” Pine Labs, pinelabs.com Same-day service neutralizes the immediacy advantage of physical stores, trims last-mile expenses by up to 30%, and locks in loyalty among convenience-driven shoppers. The North America e-commerce market is therefore seeing a rush of investment into city-center warehouses, routing algorithms, and gig-driver pools. Brands that fail to replicate these service levels risk losing urban millennials who exhibit low brand stickiness when delivery speed disappoints. Over the next two years, the resulting uplift could add 2.5 percentage points to the overall growth rate of the North America e-commerce market.
Surge of Buy Now, Pay Later adoption among Gen-Z in Canada
BNPL volume is forecast to hit USD 175 billion in North America during 2025, with Canadian Gen-Z consumers accounting for a disproportionate share. Orders financed through BNPL checkouts record 33% higher average ticket sizes and 40% lower cart abandonment than card-only flows. Canadian merchants are weaving BNPL offers into influencer campaigns and loyalty programs, turning payment choice into an acquisition lever rather than a back-office function. Heightened regulatory oversight and rising account-takeover fraud add complexity, yet sustained youth engagement keeps the medium-term impact positive for the North America e-commerce market.[2]Alan Kaplinsky, “Buy Now, Pay Later Services: Regulatory Landscape And Consumer Protection Concerns,” Ballard Spahr, ballardspahr.com
Expansion of cross-border e-commerce via USMCA-enabled customs simplification
Higher de minimis thresholds and harmonized forms under USMCA have encouraged SMEs to ship directly across borders, slashing brokerage fees and transit times. Mexican shoppers now access niche U.S. brands without third-party reshippers, while Canadian artisans tap U.S. demand without building inventory south of the border. Cross-border package volumes are rising fastest on lightweight categories such as beauty and specialty foods, creating a 1.8 percentage-point lift to the regional CAGR. Long-term success hinges on merchants’ ability to manage still-divergent data-privacy and product-labeling standards.
Retail-media networks boosting D2C conversion on large marketplaces
Three-quarters of North American marketers expect retail-media networks to take a larger slice of their budgets, and initial test campaigns show conversion rates running 3-5 times above conventional display ads.[3]Rebecca Stewart, “North American Marketers Survey: Retail Media Networks Integration In Omnichannel Strategies,” The Drum, thedrum.com These networks marry first-party traffic data with closed-loop attribution, allowing brand owners to bid aggressively because sales outcomes are measurable in hours. Expansion into in-store digital displays and off-site programmatic inventory is blurring boundaries between physical and digital promotion, elevating the importance of unified reporting dashboards. Elevated conversion efficiency is expected to sustain a 1.7 percentage-point addition to the North America e-commerce market CAGR in the near term.
Restraints Impact Analysis*
| Restraint | (~) % Impact on CAGR Forecast | Geographic Relevance | Impact Timeline |
|---|---|---|---|
| Rising Last-Mile Delivery Costs from Labour Shortages | -1.2% | United States (primary), Canada (secondary) | Medium term (2-4 years) |
| State-Level Data-Privacy Laws (e.g., CPRA) Elevating Compliance Costs | -1.0% | United States (state-specific) | Medium term (2-4 years) |
| High Return Rates & Reverse-Logistics Complexity in Apparel | -0.9% | North America (region-wide) | Long term (≥ 4 years) |
| Cyber-Fraud Targeting BNPL Checkout Flows | -0.8% | North America (region-wide) | Short term (≤ 2 years) |
| Source: Mordor Intelligence | |||
Rising last-mile delivery costs from labor shortages
Transportation payrolls expanded 47% from 2013-2023, yet demand still exceeds driver availability, pushing wages 30% higher since 2020 and eroding retailer margins. Aging couriers and high turnover magnify the challenge. Retailers in the North America e-commerce market are piloting route-optimization software, parcel lockers, and autonomous vehicles, but broad deployment remains years away. Until then, companies must absorb costs or raise delivery fees, a trade-off that could dampen volume growth among price-sensitive shoppers.
State-level data-privacy laws elevating compliance costs
Twenty-one U.S. states now enforce unique privacy statutes, forcing merchants that serve nationwide audiences to re-engineer consent strings, cookie banners, and data-sharing contracts. Compliance spending consumes 2-4% of annual revenue for many mid-size players. Fragmentation undermines the economies of scale that underpin data-driven personalization, limiting the ability of the North America e-commerce market to fully exploit AI-powered recommendation engines. If harmonization stalls, smaller firms may slow expansion into additional states to contain legal exposure.
*Our forecasts treat driver/restraint impacts as directional, not additive. The impact forecasts reflect baseline growth, mix effects, and variable interactions.
Segment Analysis
By Business Model: B2B platforms outpace the consumer segment
The segment generated 11.84% CAGR prospects between 2026-2031, outstripping consumer growth even though B2C commands 87.72% of current revenue within the North America e-commerce market. Digitized procurement replicates consumer-grade ease, replacing fax orders with AI-guided catalogs that suggest replenishment and dynamic pricing. Enterprise buyers value real-time inventory visibility and integration with ERP systems, attributes that widen barriers to entry for late adopters. Vertical marketplaces serving healthcare, construction, and industrial supplies embed compliance certificates and financing tools, lifting switching costs.
B2B platforms are importing consumer playbooks such as one-click re-order and mobile-native interfaces, reducing friction for field technicians who now place orders from job sites. The North America e-commerce market size for B2B is also expanding as export-oriented SMEs leverage cross-border APIs that quote duties and fees immediately. Collaboration between suppliers and fintech firms accelerates embedded credit, enabling instant approval and automated net-90 payment schedules. As a result, the segment is forecast to reach USD 0.23 trillion in U.S. value alone by 2027.


By Device Type: Smartphone commerce dictates experience design
Mobile wallets, voice search, and biometric log-ins collectively pushed smartphones to 71.65% transaction share in 2025, and that figure will climb through a 10.12% CAGR by 2031. Desktop retains a role for high-consideration items, yet shoppers frequently start discovery on handheld screens before closing deals elsewhere. Retailers that optimize image weight, 3D product views, and thumb-friendly navigation win higher dwell time, lifting the North America e-commerce market size attached to mobile checkouts.
Emergent channels such as smart TVs and in-car dashboards add new shopper touchpoints. Voice commerce already logs purchases from 27% of consumers. Interoperable session IDs now allow a cart to travel from phone to laptop to kiosk without re-authentication, reinforcing omnichannel continuity. As 5G coverage strengthens rural areas, latency-free rich media will reach previously underserved shoppers, cementing mobile devices as the growth core of the North America e-commerce market.
By Payment Method: Digital wallets widen their lead while BNPL matures
Digital wallets owned 45.05% of payments in 2025 and will account for more than half of transaction value by 2027. BNPL’s 15.88% CAGR shows sustained momentum, yet provider consolidation is underway as compliance costs rise. Merchants deploy payment-orchestration layers that automatically route transactions to the lowest-cost, highest-conversion rail, an approach that lowers fraud while protecting interchange economics.
Account-to-account rails such as FedNow open fresh paths that bypass legacy card schemes, offering instant settlement and lower fees for high-value goods. Crypto remains a niche option due to volatility, but stablecoins are finding niches in cross-border business purchases. Data from these varied rails fuel personalized offers post-purchase, turning the payment layer into a marketing channel that elevates lifetime value across the North America e-commerce market.
By B2C Product Category: Online grocery spearheads future gains
Consumer electronics held 33.62% revenue share in 2025 thanks to standardized SKUs and high ticket values, yet food and beverages is the breakout performer with 15.86% CAGR through 2031. Dark-store micro-fulfillment centers now locate groceries within five miles of densest customer clusters, bringing picking accuracy above 98% and cutting delivery windows to under an hour. These hubs are expected to fulfill 8% of total U.S. online grocery orders by 2025. As they scale, the North America e-commerce market size allocated to perishables grows quickly.
Fashion grapples with return costs yet mitigates risk via virtual try-on and size analytics, lifting conversion while trimming reverse-logistics waste. Beauty and personal care brands embrace social commerce and subscription replenishment, capturing routine spend from digital natives. Furniture vendors deploy augmented reality allowing shoppers to place 3D couches in living rooms before purchase, reducing return ratios. Each of these shifts expands the long-tail product mix that collectively invigorates the North America e-commerce market.
Geography Analysis
The United States commands 86.74% of current revenue within the North America e-commerce market and remains the testing ground for innovations such as retail-media networks that merge on-site and in-store data. State privacy laws complicate nationwide campaigns, but large players adapt with modular consent tools that preserve personalization. Same-day delivery expectations in dense metro areas keep capital flowing into robotics, EV delivery fleets, and AI inventory placement.
Canada contributes robust growth anchored in progressive payment habits. Digital wallet penetration nears mainstream levels, and Gen-Z preference for BNPL forces merchants to support multi-rail checkout orchestration. Cross-border shopping is routine; Canadians often tap U.S. catalogs to access broader assortments. Rural fulfillment remains costly, yet investments in regional parcel hubs and expanded pick-up lockers promise to compress delivery times.
Mexico is the fastest-growing component of the North America e-commerce market, rising at a 13.09% CAGR. Smartphone-first access dominates because handsets represent the main internet device for many households. Platforms such as Mercado Libre and Amazon localize seller onboarding, logistics, and language support, facilitating cross-border flow under simplified USMCA rules. Logistics investment in intermodal corridors and last-mile parcel shops reduces historical barriers linked to post-purchase reliability.
Regulatory Landscape
E-commerce operators in North America are working through a tightening patchwork of rules spanning privacy, marketing practices, platform conduct, and pricing transparency. In the United States, the Federal Trade Commission finalized the Trade Regulation Rule on the Use of Consumer Reviews and Testimonials in 2024 (covering fake reviews, review suppression, and undisclosed endorsements), and the Rule on Unfair or Deceptive Fees (16 C.F.R. Part 464) took effect in January 2025 for ticketing and lodging fee disclosures, raising the compliance bar for merchandising and checkout design. Legislative activity accelerated in 2026 as federal privacy proposals such as S. 4211 (Consumer Data Privacy and Security Act of 2026) and H.R. 8014 (Online Privacy Act of 2026) were introduced, alongside H.R. 9057 (May 2026), which proposed mandatory country-of-origin and seller-location disclosure for new products sold online.
Canada has also moved toward more formal digital oversight. The Government of Canada tabled Bill C-36 in June 2026 to modernize private-sector privacy rules and establish the Digital Safety and Data Protection Commission of Canada, while Bill C-34 (Safe Social Media Act) was introduced. Enforcement priorities are tightening as well, with the Competition Bureau Canada 2025-2026 Annual Plan focusing on the digital economy, online marketing, and algorithmic pricing, which adds compliance pressure to retail media, personalization, and dynamic pricing strategies across the region.
Value Chain Analysis
The North America e-commerce value chain begins with brands and marketplace sellers (including cross-border merchants) that use product data, content, and pricing to drive discovery on marketplaces and D2C storefronts. Demand capture and conversion run through commerce platforms, search and retail-media networks, and payments (digital wallets and BNPL), followed by order management, fraud screening, and customer service. Fulfillment relies on retailer-owned networks (store-as-node, regional DCs, micro-fulfillment) as well as 3PLs and parcel carriers, with returns and refurbishment increasingly specialized for categories such as apparel.
Two operational bottlenecks often shape day-to-day execution, customs and landed-cost variability, and transportation capacity. Together, these factors influence inventory placement and delivery promises. Policy shifts, including the May 2025 suspension of the US de minimis exemption for shipments from China and Hong Kong, increased the importance of product classification, brokerage, and alternative routing, while port and inland disruptions (including reported congestion and longer anchor times at gateways such as Vancouver, Charleston, and Norfolk in 2024-2025) encouraged multi-gateway strategies and safety stock. At the same time, partnerships are pushing more data-driven execution across the chain, including Kinaxis and Databricks (April 2025) for AI-enabled supply chain orchestration, PROS and Commerce (BigCommerce) (July 2025) for B2B pricing and CPQ integration, and FedEx Dataworks with ServiceNow (October 2025) to connect network visibility with procurement and logistics workflows.
Competitive Landscape
Market structure resembles a barbell. Amazon anchors one end with a 37.6% U.S. share and continues to widen its moat through Prime perks, proprietary logistics assets, and voice-activated storefronts. Walmart represents the largest omnichannel challenger, leveraging 4,600 stores as forward fulfillment nodes and turning USD 53.4 billion in online revenue into flywheel data for its rapidly growing retail-media network.
Between those giants and a long tail of niche specialists lies a cohort of digitally native vertical brands that exploit category depth to sidestep price wars. These operators focus on controlled assortments, proprietary IP, and community-driven engagement to defend margins. Competitive intensity now centers on data science capabilities: leading retailers build in-house AI teams to refine search relevance, pricing elasticity, and supply-chain forecasting. This technology push aligns with broader investment trends as the region’s big-data and analytics spending heads toward USD 169.91 billion by 2028.
Strategic activity remains brisk. Logistics providers such as DHL scale returns solutions while software vendors blend composable commerce stacks with immersive 3D front-ends, closing experiential gaps between physical and digital shopping. Private-equity investors chase roll-ups of Shopify storefronts, wagering that operational synergies in marketing and fulfillment can unlock profit in the fragmented mid-tier of the North America e-commerce market.
North America E-commerce Industry Leaders
Walmart Inc.
Amazon.com, Inc.
SHEIN Group Ltd.
Coppel, S.A. de C.V.
Costco Wholesale Corporation
- *Disclaimer: Major Players sorted in no particular order


Market Opportunities and Future Outlook
Automation-led fulfillment buildouts are creating whitespace for faster delivery economics and tighter inventory accuracy, especially for omnichannel and cross-border flows across the region. June 2026 examples, such as Lululemon bringing a 1-million-square-foot automated distribution center in Brampton, Ontario, into full operation (AutoStore with 525 robots), and Maersk announcing a USD 100 million fulfillment hub in Hopedale, Massachusetts (617,000 square feet, peak capacity cited at 330,000 units per day, opening in late August 2026), point to continued demand for high-throughput nodes near dense consumer corridors. These investments support the report's focus on micro-fulfillment and same-day expectations in major metros, while also strengthening cross-border catalog access between Canada and the United States.
Payments and trust infrastructure are another opportunity lane, reinforced by both consumer behavior and the regulatory agenda. Digital wallets already hold 45.05% of payment share in 2025, and BNPL adoption continues to rise. In May 2026, a White House executive order directed federal financial regulators to review regulations and guidance within 90 days to reduce barriers for fintech innovation. In June 2026, the US Treasury proposed rules tied to the GENIUS Act that would treat permitted payment stablecoin issuers as financial institutions under the Bank Secrecy Act, formalizing AML/CFT obligations. As a result, merchants will need payment orchestration, KYC/AML controls, and fraud tooling that can support multi-rail checkout and cross-border e-commerce without weakening conversion.
Recent Industry Developments
- July 2026: Walmart Canada announced a new Walmart Supercentre planned for Bramalea City Centre in Brampton, Ontario, as part of its multi-year investment plan in Canada. The move expands the store base that can act as local fulfillment and pickup capacity, reinforcing the store-as-node model central to faster last-mile delivery.
- June 2026: Grupo Coppel partnered with First Insight to use AI-driven predictive consumer intelligence for private-label apparel and footwear decisions, including assortment and pricing. This strengthens data-led merchandising capabilities that can reduce markdown risk and improve conversion in high-return categories.
- May 2025: Stord acquired Ware2Go, adding 21 fulfillment centers and 1.3 million square feet of space to its network. The expanded footprint supports scalable fulfillment and distribution options for both direct-to-consumer and B2B e-commerce customers across North America.


Research Methodology Framework and Report Scope
Market Definition and Coverage
For this study, the North America e-commerce market is defined as the value of goods and services ordered through digital channels, where the transaction is initiated online and paid through an online or digitally enabled payment flow across the region.
Scope exclusions: We exclude offline-only retail, along with non-transactional online activity such as browsing, advertising impressions, and unpaid social engagement.
Segmentation Overview
- By Business Model
- B2C
- B2B
- C2C
- By Device Type
- Smartphone / Mobile
- Desktop and Laptop
- Other Device Types
- By Payment Method
- Credit / Debit Cards
- Digital Wallets
- BNPL
- Other Payment Method
- By B2C Product Category
- Beauty and Personal Care
- Consumer Electronics
- Fashion and Apparel
- Food and Beverages
- Furniture and Home
- Toys, DIY and Media
- Other Product Categories
- By Country
- United States
- Canada
- Mexico
Data Sources, Market Sizing, and Validation
Desk Research
Desk work started by building a consistent demand picture for online buying across the United States, Canada, and Mexico, then matching it with supply-side signals like platform and retailer disclosures. We leaned on public time series and definitions from sources such as the US Census Bureau e-commerce releases, Statistics Canada retail trade tables, and Mexico data from INEGI, which helped anchor what is counted as online sales.
To keep assumptions realistic, we also used sources such as central bank and IMF macro indicators for inflation and exchange rates, cross-border trade signals from USITC and customs statistics, and logistics capacity indicators from official transportation agencies where available. Company filings, investor presentations, and reputable press coverage were used to confirm channel mix shifts, fulfillment capacity expansions, and category-level adoption trends. For cross-checking company financials, news, and patent activity (where relevant), we referred to paid database subscriptions used internally. These examples are illustrative, and other sources were also referenced for data collection, validation, and clarification.
Primary Interviews and Surveys
Primary interviews and surveys were used to test what desk sources could not show clearly, especially how B2C and B2B online ordering is being counted across countries and how payment and device shifts are moving checkout value. We spoke with a mix of retailers, marketplaces, logistics providers, payments ecosystem participants, and industry advisors. We then re-checked key assumptions by geography to avoid over-reliance on any single country trend.
Distribution of primary research fieldwork respondents
| Company type | Respondent position | Region |
|---|---|---|
| Top tier: 35% | CXOs: 12% | |
| Mid tier: 47% | Functional/Unit leaders: 36% | |
| Smaller Players: 18% | Managers: 52% |
Market-Sizing & Forecasting
Sizing was built using a combined top-down and bottom-up logic, where regional online transaction value was reconstructed from retail trade e-commerce series, digital payment adoption signals, and category-level online penetration ranges that were validated in primary calls, then tested against selective roll-ups. Those roll-ups used sampled GMV disclosures, revenue share proxies from large merchants and marketplaces, and a basic ASP x order volume sense-check for high-frequency categories, which helped adjust totals when one data stream appeared stretched.
Key inputs in this market included: e-commerce share of total retail sales, smartphone and broadband penetration, digital wallet and card usage in online checkout, cross-border online purchase intensity (including delivery lead times and duties friction), and fulfillment capacity indicators such as last-mile coverage and warehouse expansion pace. Where bottom-up evidence was incomplete, gaps were handled by using ranges from interviews and applying conservative adoption curves, which were later re-tested during validation.
For forecasting, we used scenario analysis tied to a small set of drivers that stakeholders consistently referenced, including consumer spending growth, inflation and currency effects, online penetration progression by category, and logistics performance improvements. We only locked the final growth path after comparing scenarios with expert expectations for pricing and order frequency changes across the three countries.
Data Validation & Update Cycle
Validation was done by triangulating the model outputs against independent signals such as official retail trade releases, payment penetration direction, and major retailer disclosures on online mix. Outliers were flagged and reviewed in steps, first by checking units and currency timing, then by testing whether the same result appears under a different set of inputs.
Before sign-off, a second analyst reviews the key assumptions and the sensitivity of the output to high-impact variables like penetration and FX conversion. If a large variance shows up, we re-contact selected participants to confirm whether the change is structural or temporary. The report is refreshed annually, with interim updates considered when material events occur, and a final pre-delivery review is completed so clients receive the latest updated view.
Mordor Intelligence's North America Ecommerce Market Size Compared Against Other Published Estimates
Published market values for North America e-commerce can look far apart because groups often mix different transaction types and do not always align on what "online" includes across countries. Differences also come from whether the number is closer to retail-only e-commerce receipts, broader digital commerce activities, or a blend of B2C and B2B value.
The main gap comes from whether payment-adjacent activities and service transactions are added on top of online ordering value. Mordor Intelligence counts e-commerce as online business transactions across North America, while keeping the model tied to transaction value signals that can be validated through retail trade releases and company disclosures.
Benchmark comparison
| Source | Market Size | Gaps in Research Methodology |
|---|---|---|
| Mordor Intelligence | USD 1.45 T (2025) | |
| Trade Journal A | USD 1.23 T (2025) | Often closer to retail e-commerce receipts definitions, which can exclude parts of travel, ticketing, and other online services, and it may not fully align B2B ordering value with B2C commerce totals. |
| Industry Association B | USD 1.62 T (2025) | May include a wider digital commerce basket (for example, broader online service transactions or cross-border additions) and can apply more aggressive assumptions on take rates and price growth without consistent cross-country checks. |
Looking at the spread, the lower figure is usually driven by a narrower retail-only scope, while the higher figure is typically explained by adding adjacent digital transaction types or faster value growth assumptions. Our approach stays repeatable by linking the total to clear demand signals, validating key shares with interviews, and then reconciling the result with public time series before finalizing the market value.


Key Questions Answered in the Report
What is the projected value of the North America e-commerce market by 2031?
The market is forecast to reach USD 2.51 trillion by 2031, growing at a 9.57% CAGR during 2026-2031.
Which country will grow the fastest in the region?
Mexico is expected to post a 13.09% CAGR, making it the fastest-growing geography within the North America e-commerce market.
How large is mobile commerce today?
Smartphones facilitated 71.65% of North American online transactions in 2025, and that share is expanding at a 10.12% CAGR.
Why is BNPL important for merchants?
Buy Now, Pay Later lifts average order value by 33% and cuts cart abandonment by up to 40%, especially with Gen-Z shoppers.
Which product category will add the most incremental revenue through 2031?
Food and beverages will grow at 15.86% CAGR thanks to dark-store micro-fulfillment, outpacing all other categories.
How are privacy laws influencing e-commerce strategy?
Fragmented state-level regulations drive compliance spending equal to 2-4% of revenue, prompting companies to adopt modular data-governance frameworks before entering new states.
Page last updated on:






