North America Dairy Market Size and Share
Market Overview
| Study Period | 2017 - 2030 |
|---|---|
| Base Year For Estimation | 2024 |
| Forecast Data Period | 2025 - 2030 |
| Market Size (2025) | USD 144.6 Billion |
| Market Size (2030) | USD 174.5 Billion |
| Growth Rate (2025 - 2030) | 3.84% CAGR |
| Market Concentration | Low |
Major Players*Disclaimer: Major Players sorted in no particular order Image © Mordor Intelligence. Reuse requires attribution under CC BY 4.0. |
|

North America Dairy Market Analysis by Mordor Intelligence
The North America Dairy Market size is estimated at 144.6 billion USD in 2025, and is expected to reach 174.5 billion USD by 2030, growing at a CAGR of 3.84% during the forecast period (2025-2030).
The North American dairy industry is experiencing significant transformation driven by evolving distribution channels and retail infrastructure. Supermarkets and hypermarkets have emerged as the dominant distribution channel, commanding 51.32% of the overall market share due to their extensive storage capabilities and diverse product offerings. The retail landscape has witnessed substantial expansion, with 150,174 convenience stores operating in the United States as of January 2023, marking a 1.5% increase from the previous year. This robust retail network, particularly strong in states like Texas with 16,018 stores and California with 12,000 stores, has significantly enhanced product accessibility and consumer reach.
Consumer behavior in the North American dairy market continues to evolve, with a notable shift toward out-of-home consumption patterns. In 2022, approximately 23.1 million individuals reported consuming food outside their homes at least once weekly, demonstrating a strong preference for on-the-go dairy products. This trend has been particularly evident in the foodservice sector, where the integration of dairy foods into restaurant menus and quick-service establishments has become increasingly prevalent, driving innovation in portion sizes and packaging formats.
The market is witnessing a pronounced shift toward health-conscious consumption patterns, with consumers increasingly seeking products that offer superior nutritional profiles. Modern dairy products are being formulated to deliver enhanced nutritional value, with standard milk offerings providing 3.4 grams of protein, 5 grams of carbohydrates, and 0.6 grams of saturated fat per cup. This focus on health and wellness has prompted manufacturers to develop clean-label products free from artificial ingredients, colors, and preservatives, meeting the growing consumer demand for natural and minimally processed dairy options.
The pricing dynamics within the North American dairy market have become increasingly sophisticated, with retailers adopting multi-tiered pricing strategies to cater to different consumer segments. Major retail chains including Walmart, Amazon, Kroger, and Target have implemented varied pricing structures, with products ranging from entry-level to premium offerings. For instance, packaged milk prices start from USD 1.72 and can reach up to USD 50.5, while sour milk products range from USD 2.68 to USD 50, demonstrating the market's ability to serve diverse consumer preferences and purchasing power levels. This strategic pricing approach has been particularly effective in expanding market penetration across different consumer segments while maintaining product accessibility.
North America Dairy Market Trends and Insights
Growing demand for dairy-infused baked products and butter-based snacks in North America boosting the market
- The per capita consumption of the North American dairy industry observed growth of 1.33% in 2022 compared to 2021. While milk has a fat content of around 3.95%, skim solids are recorded to contain 8.94%. These average percentages of both milk fat and skim solids in farm milk (cows' milk from dairy farms) have increased over the last decade. Consequently, consumers are becoming more aware of the benefits derived from dairy products, such as improved strength, consumption of natural ingredients, and other advantages, leading to a rising demand for dairy products in the North American region.
- Consumers in the North American region also gravitated toward butter-based snack products such as cookies and crunchies. Consequently, there was an increase in the import volume of butter. In 2022, butter prices in the United States rose due to additional imports, aligning them with international price levels. The strong demand for premium butter, coupled with the lifting of import tariffs in early 2021, contributed to this trend. Notably, butter imports increased by 0.4 billion pounds in 2021, and estimates based on a milk-fat basis project imports to reach 6.9 billion pounds by 2023.
- With the growing demand for baked foods, including pizza, Baked Macaroni with Mortadella, and other cheese-based products, the demand for cheese is also increasing in the region. Domestic cheese consumption showed continued growth of 2.7% in 2021. To meet the demand for cheese-based foods, cheese imports increased every month (except for February and December) compared to the same months in 2020, reaching a total of 0.3 billion pounds in 2021, marking a 13.2% increase. Cheese production also saw a 2.8% increase, reaching 13.6 billion pounds in 2021.

OTHER KEY INDUSTRY TRENDS COVERED IN THE REPORT
- Rising milk cow numbers and increasing butter prices drive production in the region
- Influence of exporting demand and milk price growth on production in North America
- Growing demand for processed cheese products drives the market in North America
Segment Analysis: Category
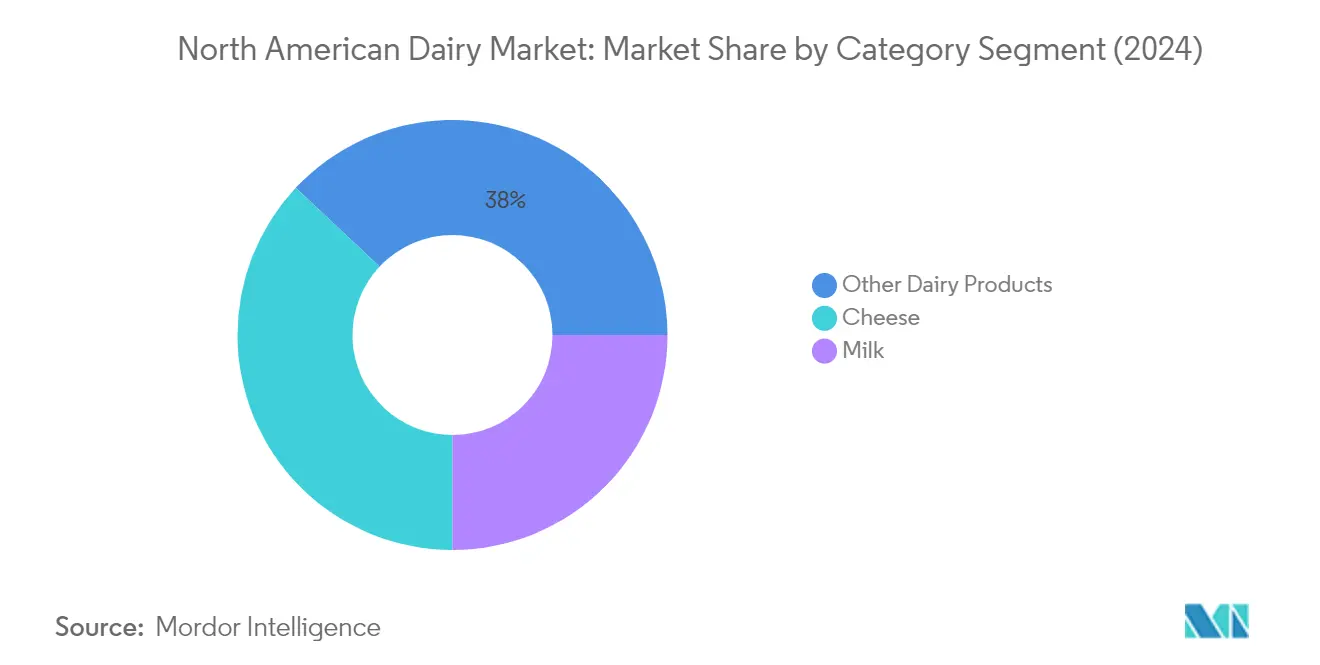
Cheese Segment in North American Dairy Market
The cheese segment maintains its dominant position in the North American dairy market, commanding approximately 37% of the total market share in 2024. This substantial market presence is primarily driven by the widespread popularity and consumption of cheese-based dairy foods, particularly pizza and sandwiches, across the region. The segment's growth is further supported by the increasing adoption of natural and premium cheese varieties, as consumers show a stronger preference for high-quality, artisanal cheese products. Major dairy companies in North America continue to expand their cheese processing capacities through significant investments in new facilities and technology upgrades, ensuring a steady supply to meet the growing demand.
Milk Segment in North American Dairy Market
The milk segment is projected to experience the fastest growth in the North American dairy market, with an anticipated growth rate of approximately 4.4% during 2024-2029. This accelerated growth is primarily attributed to increasing public-private funding and investments in dairy farming, coupled with technological advancements in the industry. The segment's expansion is further driven by rising consumer preference for value-added milk products, particularly flavored and fortified varieties. The growth is also supported by the increasing adoption of innovative processing technologies and packaging solutions, enabling longer shelf life and better product quality. Additionally, the rising demand for organic and premium milk products, coupled with expanding distribution networks, is expected to fuel the segment's growth trajectory. The fresh milk market is particularly benefiting from these trends, as consumers seek healthier and more natural options.
Remaining Segments in Category
The North American dairy market encompasses several other significant segments including butter, cream, dairy desserts, sour milk drinks, and yogurt, each contributing uniquely to the market's diversity. The butter segment maintains steady growth driven by increasing usage in bakery applications and the rising popularity of premium and organic variants. The cream segment benefits from the growing trend of home baking and cooking, while dairy desserts continue to innovate with new flavors and healthier formulations. Sour milk drinks are gaining traction due to their probiotic benefits and increasing health consciousness among consumers. The yogurt segment continues to evolve with new product innovations, particularly in the Greek and probiotic yogurt categories, catering to changing consumer preferences for healthier dairy products.
Segment Analysis: Distribution Channel
Off-trade Segment in North American Dairy Market
The off-trade distribution channel dominates the North American dairy market, commanding approximately 76% market share in 2024. This channel encompasses various retail formats including supermarkets, hypermarkets, convenience stores, specialist retailers, and online platforms. Supermarkets and hypermarkets lead the off-trade segment, benefiting from their extensive network and ability to offer significant discounts and bulk purchasing options. The channel's dominance is further strengthened by the presence of major retail chains like Walmart, which operates over 4,700 stores throughout the United States, and the growing number of supermarkets, with over 63,000 establishments in the United States alone. The off-trade channel's success is also attributed to technological innovations like self-checkout kiosks and walk-out technology, which enhance the shopping experience and convenience for consumers.
On-trade Segment in North American Dairy Market
The on-trade distribution channel, comprising fast-food chains, full-service restaurants, cafeterias, and other food service establishments, is projected to be the fastest-growing segment in the North American dairy market from 2024 to 2029. This growth is primarily driven by increasing consumer preference for dining outside, with approximately 15% of the total population in the United States preferring to consume meals outside their homes at least three times a week. The segment's expansion is further supported by the rising number of food service outlets, with over 72,000 coffee and snack shop businesses expected in the United States by 2025. The growth is particularly notable in the cheese-based products segment, with significant consumption through pizza chains and quick-service restaurants, contributing to the channel's robust growth trajectory. The pet milk market is also seeing increased interest in on-trade channels, as innovative dairy-based beverages gain popularity.
North America Dairy Market Geography Segment Analysis
Dairy Market in the United States
The United States dairy market dominates the North America dairy market, commanding approximately 79% of the total market value in 2024. The country's dairy industry benefits from advanced production technologies, extensive distribution networks, and strong consumer demand across various product categories. The widespread popularity of cheese-based foods, particularly pizza and other convenience foods, has been a significant driver of market growth. The country's robust retail infrastructure, featuring major chains like Walmart, Kroger, and Costco, provides extensive accessibility to dairy products. The market is characterized by continuous product innovation, particularly in segments like organic dairy, lactose-free options, and premium products, catering to evolving consumer preferences. The industry is further supported by stringent quality standards and food safety regulations, ensuring high-quality products for consumers. Additionally, the increasing adoption of value-added dairy products and the growing trend toward healthy snacking have contributed to market expansion.
Dairy Market in Canada
Canada's dairy market demonstrates remarkable growth potential, with projections indicating a robust CAGR of approximately 5% from 2024 to 2029. The country's dairy sector is characterized by its strong focus on quality and innovation, particularly in organic and premium dairy products. The industry operates under a sophisticated supply management system that ensures stable production and pricing. Canadian consumers show increasing preference for locally produced dairy products, driving demand for artisanal and specialty items. The market has witnessed significant developments in value-added dairy products, particularly in cheese and yogurt segments. The country's strict regulatory framework and emphasis on sustainable farming practices have helped maintain high product standards. The industry's commitment to innovation is evident in the development of new product varieties and formats, catering to changing consumer preferences. Furthermore, the growing trend toward health-conscious consumption has led to increased demand for functional dairy products enriched with proteins and probiotics.
Dairy Market in Mexico
Mexico's dairy market exhibits strong growth dynamics driven by increasing urbanization and changing dietary patterns. The country's dairy industry comprises approximately 250,000 dairies, with operations ranging from small-scale to industrial-sized facilities. The top milk-producing states, including Jalisco, Chihuahua, Coahuila, and Durango, form the backbone of the country's dairy production. The market is characterized by a growing preference for value-added dairy products, particularly cheese and yogurt. Consumer awareness about health benefits associated with dairy products has led to increased consumption across various demographic segments. The retail landscape for dairy products is diverse, with both modern trade and traditional channels playing crucial roles in distribution. The industry has also witnessed significant technological advancements in processing and packaging, improving product quality and shelf life. Additionally, the market shows strong potential in premium and fortified dairy products, catering to health-conscious consumers.
Dairy Market in Other Countries
The dairy market in other North American countries, including Jamaica, Costa Rica, Panama, and Guatemala, demonstrates unique characteristics and growth patterns. These markets are characterized by a mix of local production and imports, with varying degrees of market maturity. The dairy industry in these regions focuses on meeting domestic demand while gradually expanding production capabilities. Consumer preferences in these markets show an increasing inclination toward processed dairy products, particularly cheese and yogurt. The retail landscape is evolving with the expansion of modern trade formats, though traditional channels remain significant. These markets benefit from regional trade agreements and cross-border commerce, facilitating dairy product movement. The industry in these countries is gradually adopting modern processing technologies and quality standards to enhance competitiveness. Local producers are increasingly focusing on product innovation and quality improvements to meet evolving consumer demands.
Competitive Landscape
Top Companies in North American Dairy Market
The North American Dairy Market is characterized by companies focusing heavily on product innovation and development to maintain their competitive edge. Major players are actively expanding their product portfolios through the introduction of new flavors, organic variants, and health-focused offerings, particularly in segments like cheese, yogurt, and ice cream. Companies are demonstrating operational agility by modernizing their manufacturing facilities and implementing advanced technologies to improve production efficiency. Strategic partnerships and collaborations with technology providers, research institutions, and retail chains have become increasingly common to enhance market presence. Geographic expansion strategies are being pursued through both organic growth and acquisitions, with companies particularly focusing on strengthening their distribution networks and establishing new production facilities across different regions of North America.
Fragmented Market with Strong Regional Players
The North American dairy market exhibits a mix of global conglomerates and regional specialists, creating a relatively fragmented competitive landscape. Global players like Kraft Heinz, Nestlé, and Danone maintain significant market presence through their established brands and extensive distribution networks, while regional players like Prairie Farms Dairy and Organic Valley have carved out strong niches through their focus on local sourcing and organic products. The market structure is characterized by a combination of large-scale industrial producers and smaller cooperative-based organizations, with the latter maintaining strong connections to local farming communities and regional markets.
The industry has witnessed considerable merger and acquisition activity, primarily driven by larger companies seeking to expand their product portfolios and geographic reach. Companies are increasingly acquiring smaller, specialized producers to gain access to niche markets and innovative product lines, particularly in segments like organic dairy and specialty cheese. This consolidation trend is reshaping the competitive landscape, with larger players strengthening their market positions while maintaining the distinct identities of acquired brands to preserve customer loyalty and market differentiation.
Innovation and Sustainability Drive Future Success
Success in the North American dairy market increasingly depends on companies' ability to align with evolving consumer preferences and sustainability requirements. Market leaders are investing in research and development to create innovative products that cater to health-conscious consumers, while also implementing sustainable practices throughout their supply chains. Companies are focusing on developing clean-label products, expanding organic offerings, and introducing plant-based alternatives to traditional dairy products to maintain market relevance and capture new consumer segments.
Future market success will require companies to effectively balance operational efficiency with environmental responsibility while maintaining product quality and safety standards. Regulatory compliance, particularly regarding food safety and environmental standards, continues to shape competitive strategies. Companies must also address the growing influence of retail chains and e-commerce platforms, which are becoming increasingly important in determining market success. The ability to maintain strong relationships with farming communities, invest in sustainable practices, and adapt to changing distribution channels will be crucial for both established players and new entrants in the market.
North America Dairy Industry Leaders
-
Danone SA
-
Froneri International Limited
-
Groupe Lactalis
-
The Kraft Heinz Company
-
Unilever PLC
- *Disclaimer: Major Players sorted in no particular order

Recent Industry Developments
- December 2022: Lactalis Canada acquired Kraft Heinz's Grated Cheese business in Canada, marking its entry into the ambient category.
- November 2022: The Kraft Heinz Company launched the cheesecake kit Philly Handbag.
- October 2022: Unilever partnered with ASAP for the distribution of its ice cream goods. As per the partnership, ASAP will also deliver ice cream and treats from Unilever's virtual storefront, The Ice Cream Shop.
North America Dairy Market Report Scope
Butter, Cheese, Cream, Dairy Desserts, Milk, Sour Milk Drinks, Yogurt are covered as segments by Category. Off-Trade, On-Trade are covered as segments by Distribution Channel. Canada, Mexico, United States are covered as segments by Country.| Butter | By Product Type | Cultured Butter |
| Uncultured Butter | ||
| Cheese | By Product Type | Natural Cheese |
| Processed Cheese | ||
| Cream | By Product Type | Double Cream |
| Single Cream | ||
| Whipping Cream | ||
| Others | ||
| Dairy Desserts | By Product Type | Cheesecakes |
| Frozen Desserts | ||
| Ice Cream | ||
| Mousses | ||
| Others | ||
| Milk | By Product Type | Condensed milk |
| Flavored Milk | ||
| Fresh Milk | ||
| Powdered Milk | ||
| UHT Milk | ||
| Sour Milk Drinks | ||
| Yogurt | By Product Type | Flavored Yogurt |
| Unflavored Yogurt |
| Off-Trade | Convenience Stores |
| Online Retail | |
| Specialist Retailers | |
| Supermarkets and Hypermarkets | |
| Others (Warehouse clubs, gas stations, etc.) | |
| On-Trade |
| Canada |
| Mexico |
| United States |
| Rest of North America |
| Category | Butter | By Product Type | Cultured Butter |
| Uncultured Butter | |||
| Cheese | By Product Type | Natural Cheese | |
| Processed Cheese | |||
| Cream | By Product Type | Double Cream | |
| Single Cream | |||
| Whipping Cream | |||
| Others | |||
| Dairy Desserts | By Product Type | Cheesecakes | |
| Frozen Desserts | |||
| Ice Cream | |||
| Mousses | |||
| Others | |||
| Milk | By Product Type | Condensed milk | |
| Flavored Milk | |||
| Fresh Milk | |||
| Powdered Milk | |||
| UHT Milk | |||
| Sour Milk Drinks | |||
| Yogurt | By Product Type | Flavored Yogurt | |
| Unflavored Yogurt | |||
| Distribution Channel | Off-Trade | Convenience Stores | |
| Online Retail | |||
| Specialist Retailers | |||
| Supermarkets and Hypermarkets | |||
| Others (Warehouse clubs, gas stations, etc.) | |||
| On-Trade | |||
| Country | Canada | ||
| Mexico | |||
| United States | |||
| Rest of North America | |||
Market Definition
- Butter - Butter is a yellow-to-white solid emulsion of fat globules, water, and inorganic salts produced by churning the cream from cows’ milk
- Dairy - Dairy product include milk and any of the foods made from milk, including butter, cheese, ice cream, yogurt, and condensed and dried milk.
- Frozen Desserts - Frozen dairy dessert means and includes products containing milk or cream and other ingredients which are frozen or semi-frozen prior to consumption, such as ice milk or sherbet, including frozen dairy desserts for special dietary purposes, and sorbet
- Sour Milk Drinks - Sour milk is thick, curdled milk, with a sour taste, obtained from the fermentation of milk. Sour milk drinks such as kefir, laban, buttermilk have been considered in the study
| Keyword | Definition |
|---|---|
| Cultured Butter | Cultured butter is prepared by having the raw butter go through chemical processing and has been added with certain emulsifiers and foreign ingredients. |
| Uncultured Butter | This type of butter is one which has not been processed in any way |
| Natural Cheese | The type of cheese in its most natural form. It is made from natural and simple products and ingredients, including fresh and natural salts, natural colors, enzymes, and high-quality milk. |
| Processed Cheese | Processed cheese undergoes the same processes as natural cheese; however, it requires more steps and many different forms of ingredients. Making processed cheese involves melting natural cheese, emulsifying it, and adding preservatives and other artificial ingredients or colorings. |
| Single Cream | Single cream contains around 18% fat. It’s a single layer of cream that appears over boiled milk. |
| Double Cream | Double cream contains 48% fat, more than double the amount of fat of single cream. It’s heavier and thicker than single cream |
| Whipping Cream | This has a much higher fat percentage than single cream (36%). Used to top cakes, pies, and puddings and as a thickener for sauces, soups, and fillings. |
| Frozen Desserts | Desserts that are meant to be eaten in frozen condition. E.g., sherbets, sorbets, frozen yogurts |
| UHT Milk (Ultra-high temperature milk) | Milk heated at a very high temperature. Ultra-high-temperature processing (UHT) of milk involves heating for 1–8 sec at 135–154°C. which kills the spore-forming pathogenic microorganism, resulting in a product with a shelf-life of several months. |
| Non-dairy butter/Plant-based butter | Butter made from plant-derived oil such as coconut, palm, etc. |
| Non-dairy Yogurt | Yogurt made from typically made from nuts, like almonds, cashews, coconuts, and even other foods like soybeans, plantains, oats, and peas |
| On-trade | It refers to restaurants, QSRs, and bars. |
| Off-trade | It refers to supermarkets, hypermarkets, on-line channels, etc. |
| Neufchatel cheese | One of the oldest kinds of cheese in France. It is a soft, slightly crumbly, mold-ripened, bloomy-rind cheese made in the Neufchâtel-en-Bray region of Normandy. |
| Flexitarian | It refers to a consumer preferring a semi-vegetarian diet, that is centered on plant foods with limited or occasional inclusion of meat. |
| Lactose Intolerance | Lactose intolerance is a reaction in digestive system to lactose, the sugar in milk. It causes uncomfortable symptoms in response to the consumption of dairy products. |
| Cream Cheese | Cream cheese is a soft and creamy fresh cheese with a tangy taste made from milk and cream. |
| Sorbets | Sorbet is a frozen dessert made using ice combined with fruit juice, fruit purée, or other ingredients, such as wine, liqueur, or honey. |
| Sherbet | Sherbet is a sweetened frozen dessert made with fruit and some sort of dairy product such as milk or cream. |
| Shelf stable | Foods that can be safely stored at room temperature, or "on the shelf," for at least one year and do not have to be cooked or refrigerated to eat safely. |
| DSD | Direct Store Delivery is the process in supply chain management wherein the product is delivered from manufacturing plant directly to the retailer. |
| OU Kosher | Orthodox Union Kosher is a kosher certification agency based in New York City. |
| Gelato | Gelato is a frozen creamy dessert made with milk, heavy cream and sugar. |
| Grass-fed Cows | Grass-fed cows are allowed to graze in pastures, where they eat a variety of grasses and clover. |
Research Methodology
Mordor Intelligence follows a four-step methodology in all our reports.
- Step-1: Identify Key Variables: In order to build a robust forecasting methodology, the variables and factors identified in Step 1 are tested against available historical market numbers. Through an iterative process, the variables required for market forecast are set, and the model is built on the basis of these variables.
- Step-2: Build a Market Model: Market-size estimations for the forecast years are in nominal terms. Inflation is not a part of the pricing, and the average selling price (ASP) is kept constant throughout the forecast period for each country.
- Step-3: Validate and Finalize: In this important step, all market numbers, variables, and analyst calls are validated through an extensive network of primary research experts from the market studied. The respondents are selected across levels and functions to generate a holistic picture of the market studied.
- Step-4: Research Outputs: Syndicated Reports, Custom Consulting Assignments, Databases & Subscription Platforms


