
Market Overview
| Study Period | 2020 - 2031 |
|---|---|
| Forecast Data Period | 2026 - 2031 |
| Base Year Market Size (2025) | USD 8.96 Billion |
| Market Size (2026) | USD 10.38 Billion |
| Market Size (2031) | USD 21.56 Billion |
| Growth Rate (2026 - 2031) | 15.80 % |
| Market Concentration | Medium |
Major Players *Disclaimer: Major Players sorted in no particular order Image © Mordor Intelligence. Reuse requires attribution under CC BY 4.0. | |
North America Continuous Glucose Monitoring Market Analysis by Mordor Intelligence
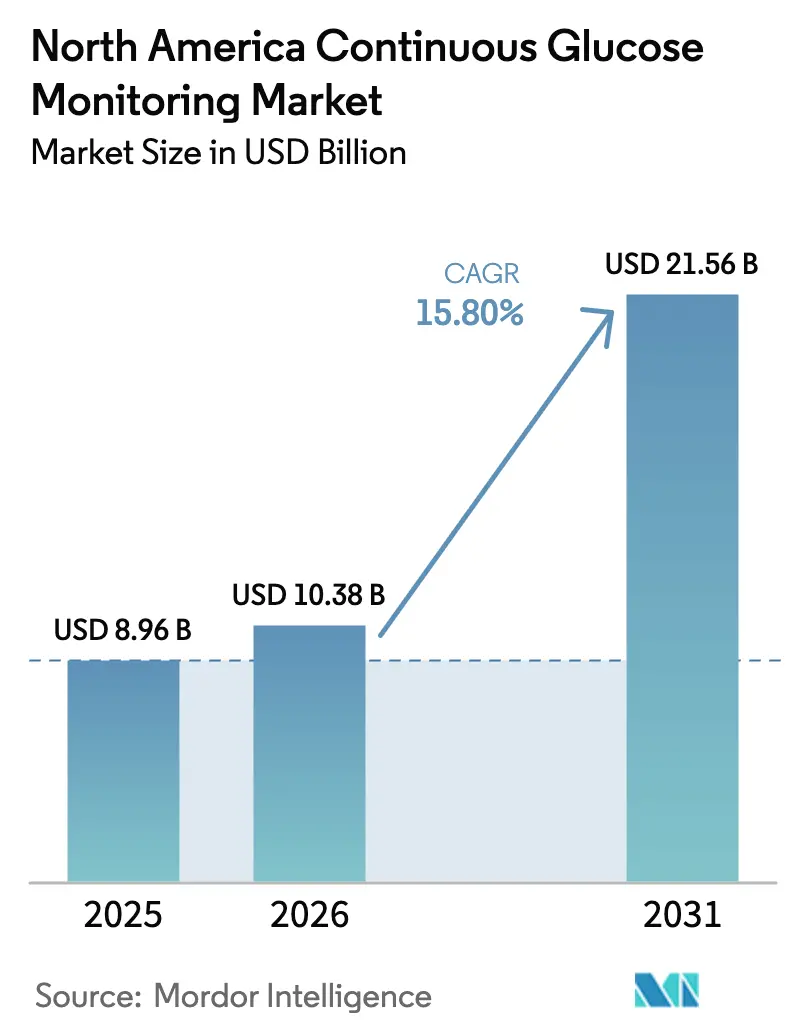
The North America continuous glucose monitoring market size is expected to grow from USD 8.96 billion in 2025 to USD 10.38 billion in 2026 and is forecast to reach USD 21.56 billion by 2031 at 15.80% CAGR over 2026-2031. This acceleration reflects a structural shift from episodic finger-stick testing to continuous, real-time data that feeds automated insulin delivery, remote care, and population-scale disease-management programs. Regulatory approvals that drop the minimum age for use to 2 years, payer policies that waive prior authorization for non-insulin-using adults, and the rapid integration of CGM into closed-loop systems jointly sustain expansion. Sensor miniaturization now delivers ≤8% mean absolute relative difference (MARD), approaching laboratory precision. Parallel growth in remote-monitoring CPT codes allows clinicians to bill USD 64 per patient each month for asynchronous CGM review, cementing reimbursement momentum.
Key Report Takeaways
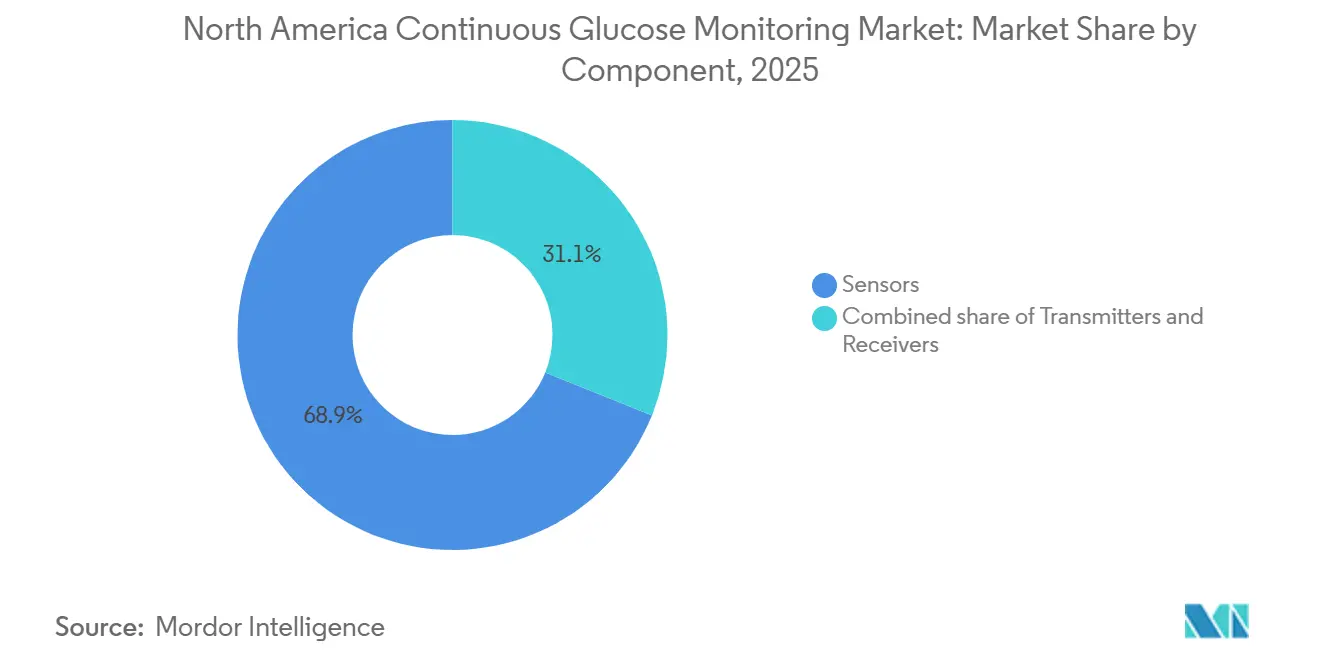
- By component, sensors captured 68.9% of the North America continuous glucose monitoring market share in 2025, while their 16.87% CAGR is the highest among components.
- By demography, adults held 71.2% revenue share in 2025; the pediatric segment is projected to grow at 18.92% CAGR through 2031.
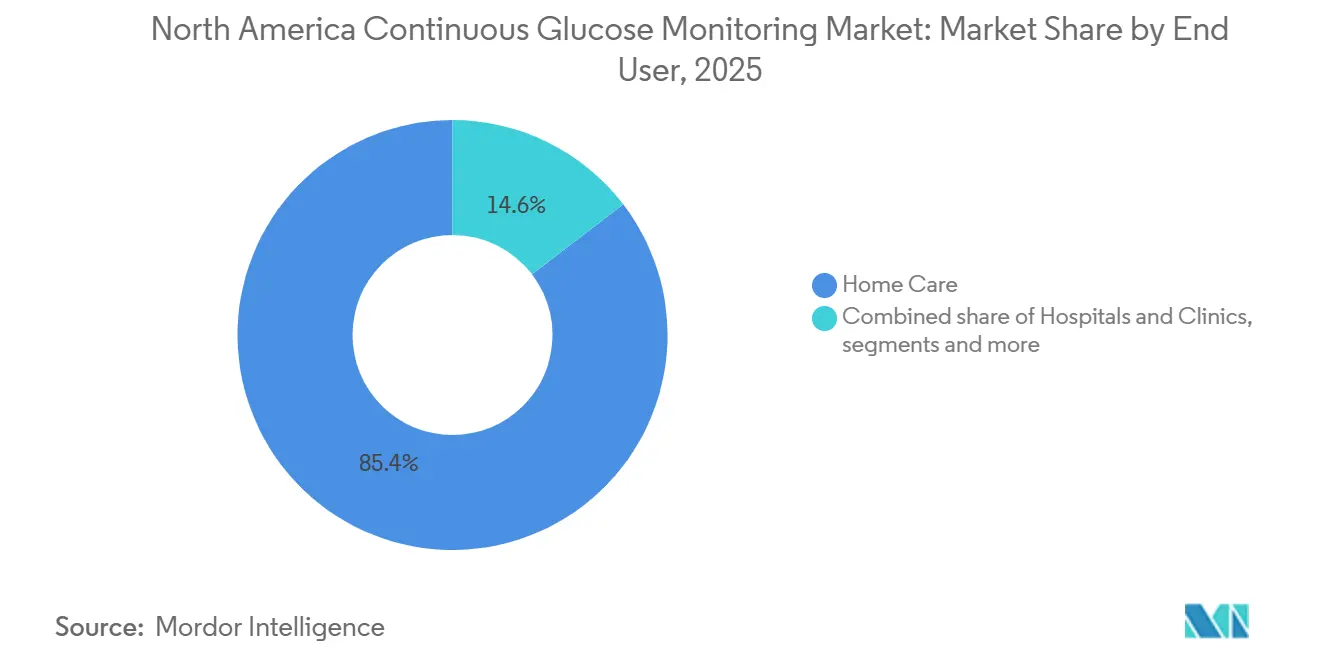
- By end user, home care accounted for 85.4% revenue in 2025 and is set to advance at a 17.87% CAGR to 2031.
- By country, the United States commanded an 88.5% share in 2025, whereas Canada leads growth at a 16.43% CAGR to 2031.
Note: Market size and forecast figures in this report are generated using Mordor Intelligence’s proprietary estimation framework, updated with the latest available data and insights as of January 2026.
Market Trends and Insights
Drivers Impact Analysis of North America Continuous Glucose Monitoring Market*
| Driver | (~) % Impact on CAGR Forecast | Geographic Relevance | Impact Timeline |
|---|---|---|---|
| Rising Prevalence of Diabetes & Earlier Diagnosis | +2.8% | United States, Canada, Mexico | Long term (≥ 4 years) |
| Rapid Uptake of Remote Monitoring & Tele-Health Integration | +3.2% | United States, Canada | Medium term (2-4 years) |
| Sensor Miniaturization & Accuracy Breakthroughs | +2.5% | United States, Canada | Medium term (2-4 years) |
| Employer-Sponsored Wellness Plans Subsidising CGM | +1.4% | United States | Short term (≤ 2 years) |
| Pharmacy-Chain Subscription Programs Accelerating First-Time Users | +1.6% | United States | Short term (≤ 2 years) |
| Integration with Automated Insulin Delivery Systems | +2.9% | United States, Canada | Medium term (2-4 years) |
| Source: Mordor Intelligence | |||
Rising Prevalence Of Diabetes & Earlier Diagnosis
Diabetes prevalence reached 38.4 million in the United States in 2024, 3.7 million in Canada in 2025, and 12.4 million in Mexico in 2025. Screening guidelines now recommend testing all adults aged 35+ and overweight adults with a risk factor, expanding the addressable base by roughly 15 million individuals[1]. Newly diagnosed adults receive CGM within 90 days because randomized evidence shows a 0.9% additional A1c reduction versus finger-stick monitoring. Commercial insurers mirrored the science by adding first-line CGM coverage for non-insulin users in 2025[2]. The result is a durable, long-tail driver across the North American continuous glucose monitoring market.
Rapid Uptake of Remote Monitoring & Telehealth Integration
CPT codes 99453, 99454, and 99457 reimburse remote physiologic data review, creating a recurring USD 64 monthly revenue stream per CGM patient. The Veterans Health Administration cut in-person endocrinology visits 38% after systemwide CGM-telehealth rollout in 2025 while sustaining glycemic outcomes. Kaiser Permanente’s virtual clinic documented a 1.2% mean A1c drop among 4,800 enrollees by pairing CGM with asynchronous coaching. FDA guidance clarified that cloud-connected CGM platforms qualify for RPM billing, ending payer ambiguity [3]. These forces intertwine reimbursement and telehealth growth, lifting the North American continuous glucose monitoring market.
Sensor Miniaturization & Accuracy Breakthroughs
Abbott’s FreeStyle Libre 3 shrank sensor volume 70% and achieved 7.9% MARD. Dexcom’s G7 cut warm-up to 30 minutes and landed at 8.2% MARD. Senseonics’ Eversense 365 delivers 365-day wear and removes adhesive dermatitis risk for the estimated 10% of users with skin reactions. FDA draft guidance suggests CGM with <10% MARD may support insulin dosing without confirmatory finger sticks, unlocking an 8.4 million-strong type 1 population. Accuracy gains, therefore, amplify both clinical utility and payer acceptance.
Integration With Automated Insulin Delivery Systems
Tandem’s Control-IQ held a significant U.S. automated-delivery share in 2025, operating exclusively on Dexcom CGM inputs. Insulet shipped 1.2 million Omnipod 5 pods in 2024, a 68% increase driven by Dexcom sensor pairing. Beta Bionics’ iLet bionic pancreas, approved May 2024, doses insulin using only patient weight plus CGM data. ADA 2025 guidelines recommend automated delivery for all type 1 patients who can safely use the technology. Medicare now requires ≥80% CGM usage to qualify for pump reimbursement, effectively hard-linking sensor adoption to insulin-pump funding.
Restraints Impact Analysis of North America Continuous Glucose Monitoring Market*
| Restraint | (~) % Impact on CAGR Forecast | Geographic Relevance | Impact Timeline |
|---|---|---|---|
| High Device & Consumable Costs to Payers & Patients | -1.9% | United States, Mexico | Medium term (2-4 years) |
| GLP-1 Weight-Loss Drugs Reducing Testing Frequency | -1.3% | United States, Canada | Short term (≤ 2 years) |
| Rising Reports of Sensor-Adhesive Skin Dermatitis | -0.9% | United States, Canada | Medium term (2-4 years) |
| Regulatory Uncertainty Around Multi-Analyte Sensors | -0.7% | United States, Canada | Long term (≥ 4 years) |
| Source: Mordor Intelligence | |||
High Device & Consumable Costs to Payers & Patients
A 10-day sensor wholesales for USD 75-95, producing yearly consumable costs up to USD 3,467 before insurance. Medicare Part B’s 20% coinsurance still leaves users with USD 547-693 out-of-pocket annually. Medicaid coverage is fragmentary: 38 states reimburse CGM for type 1, only 22 for non-insulin type 2, excluding 14 million beneficiaries. Mexico’s social-security formulary omits CGM entirely, forcing retail prices equal to 12-16% of the monthly minimum wage, restricting adoption to affluent urban consumers. Elevated cost, therefore, moderates penetration and dampens the North America continuous glucose monitoring market CAGR.
GLP-1 Weight-Loss Drugs Reducing Testing Frequency
Ozempic and Mounjaro posted combined U.S. sales of USD 14.3 billion in 2024, reducing A1c 1.5-2.0 percentage points and flattening glucose excursions. A Lancet study showed CGM time-in-use dropping from 85% to 62% six months post-GLP-1 initiation. Cigna now limits CGM coverage to patients with A1c > 8% or documented hypoglycemia, excluding 40% of GLP-1 users who achieve A1c < 7%. This pharmacologic substitution tempers addressable demand in the non-insulin type 2 cohort.
*Our forecasts treat driver/restraint impacts as directional, not additive. The impact forecasts reflect baseline growth, mix effects, and variable interactions.
North America Continuous Glucose Monitoring Market Segment Analysis
By Component:
Sensors Dominate on Accuracy and Longevity GainsSensors accounted for 68.9% of the North America continuous glucose monitoring market share in 2025 and are projected to expand at a 16.87% CAGR through 2031. Their integration of Bluetooth Low Energy allows disposable form factors to communicate directly with smartphones, removing transmitters and trimming bill-of-material cost by 22%. Wearable sensors represent 92% of revenue; implantables grow faster at 21.3% by alleviating dermatitis complaints. Transmitters and receivers decline as stand-alone categories but persist among pediatric and senior users who lack smartphones.
Continued miniaturization underpins the competitive edge: Abbott’s 5-mm Libre 3 disk and Dexcom’s sleeker G7 both meet ISO 15197:2013 accuracy thresholds, positioning sensors as the hardware linchpin of the North America continuous glucose monitoring market size for the foreseeable future. FDA interoperability rules will further commoditize transmitters, concentrating value creation in sensor chemistry, wear duration, and algorithmic signal processing.

By Demography:
Pediatric Segment Surges on Label ExpansionsAdults generated 71.2% of 2025 revenue, but the pediatric group will grow at 18.92% CAGR after regulatory age floors fell to 2 years. The International Society for Pediatric and Adolescent Diabetes finds that CGM reduces hypoglycemia risk by 72% versus finger-stick monitoring. Ontario’s Assistive Devices Program funds 80% of the device cost for children, expanding access to 12,000 users. U.S. school-access legislation now allows students to view live glucose on smartwatches, normalizing classroom use. Meanwhile, adult adoption accelerates in the 35 million-strong non-insulin type 2 segment now served by over-the-counter Stelo and Libre 3. The demographic mix will therefore rebalance the North America continuous glucose monitoring market size toward younger cohorts without sacrificing adult revenue.
By End User:
Home Care Leads on Telehealth and Reimbursement TailwindsHome settings captured 85.4% revenue in 2025 and will sustain a 17.87% CAGR thanks to RPM billing codes and direct-to-consumer shipment. Veterans Health Administration data show 38% fewer in-person visits after CGM-telehealth deployment. Private insurers erased prior authorization for millions of non-insulin users, further entrenching home distribution. Hospitals remain a niche, bound by infection-control protocols that prefer arterial lines for inpatients, while specialty centers focus on intensive education.
Remote data review is proving cost-effective; hence, health-system stakeholders increasingly steer patients toward at-home initiation, reinforcing the home-care dominance of the North America continuous glucose monitoring market share through 2031.
Geography Analysis
United States Continuous Glucose Monitoring Market
The United States accounted for 88.5% of 2025 revenue, energized by Medicare’s national coverage determination and over-the-counter clearances that enable pharmacy and e-commerce distribution. Removal of prescription requirements is forecast to add 4.2 million first-time users by 2027. However, surging GLP-1 uptake has already reduced CGM use frequency by 27% among type 2 cohorts, tempering upside.
Canada Continuous Glucose Monitoring Market
Canada will post the fastest national growth at 16.43% CAGR through 2031 as Ontario, Quebec, and British Columbia eliminate prior-authorization and extend coverage to insulin-using adults. Health Canada approvals of Dexcom G7 and Libre 3 bring technology parity with the United States.
Mexico Continuous Glucose Monitoring Market
Mexico represents roughly 3% of regional value because social-security formularies exclude CGM and retail sensors cost MXN 1,500-2,000 (USD 88-117) each, 12-16% of the minimum wage. Private insurance penetration below 8% confines adoption to affluent urban consumers despite the nation’s 12.4 million-person diabetes burden.
Regulatory Landscape
In the United States, continuous glucose monitoring (CGM) systems are regulated by the U.S. Food and Drug Administration (FDA) largely through Class II pathways for integrated CGM (iCGM), reflecting their role in insulin dosing and automated insulin delivery (AID) interoperability. In May 2026, the FDA published final guidance on submitting CGM data in clinical trials, tightening expectations for standardized CGM datasets in marketing submissions and emphasizing the role of software, connectivity, and data integrity as CGM expands into remote monitoring workflows.
In Canada, Health Canada regulates CGM under the Medical Devices Regulations (SOR/98-282), where systems with meaningful risk from erroneous readings are commonly treated as Class III devices requiring a Medical Device Licence Application. Cross-border regulatory alignment is supported by reliance on consensus standards and the International Medical Device Regulators Forum (IMDRF) Table of Contents format, which manufacturers use to structure technical documentation while addressing quality management, risk management, and software life-cycle controls needed for cloud-connected CGM platforms.
Competitive Landscape
Market concentration remains high. Abbott, Dexcom, and Medtronic (MiniMed) captured the majority of revenue, but the North America continuous glucose monitoring market is fragmenting through over-the-counter models and pump interoperability mandates. Abbott’s FreeStyle Libre franchise generated USD 5.3 billion worldwide in 2024, half from North America.
Dexcom delivered USD 4.1 billion global revenue, fueled by G7 plus Stelo cash sales and integration deals with Tandem and Insulet. Medtronic booked a 12% integrated-pump share but faces interoperable competition after FDA guidances require open connectivity.
New entrants pursue white-space niches. Senseonics offers a 365-day implant for dermatitis-prone users. Biolinq’s microneedle array finished pivotal trials with 9.1% MARD and zero calibrations, targeting mid-2026 clearance. POCTech uses flexible electronics to chase sub-USD 50 sensors for retrospective review. Patent cliffs loom: core Dexcom sensing patents expire 2027-2028, potentially enabling biosimilar challengers, though algorithm patents extend to 2032. Strategic responses include Abbott’s USD 450 million California plant expansion and Medtronic’s sensor partnerships with Abbott and Instinct, signaling cost and interoperability battles ahead.
North America Continuous Glucose Monitoring Industry Leaders
-
DexCom, Inc.
-
Senseonics Holdings Inc.
-
Ascensia Diabetes Care
-
Abbott Laboratories
-
MiniMed
- *Disclaimer: Major Players sorted in no particular order

North America Continuous Glucose Monitoring Market Companies Covered in this Report
- Abbott Laboratories
- Ascensia
- Beta Bionics
- Biolinq
- Dexcom
- Eversense (Senseonics)
- Insulet
- Lifescan
- Medtronic PLC (MiniMed)
- Nemaura Medical
- Novo Nordisk
- Roche
- Senseonics
Read Analysis of North America Continuous Glucose Monitoring Companies
Market Opportunities and Future Outlook
Over-the-counter (OTC) expansion and earlier-age access open additional whitespace beyond intensive insulin users, particularly for adults and pediatrics managed outside specialty endocrinology. In June 2026, the FDA cleared Dexcom's Stelo for children aged 2 to 18 who do not use insulin, extending OTC-style access into pediatric use cases that are already benefiting from label expansions and school-based acceptance of live glucose viewing. This widens the channel mix toward pharmacy and direct-to-consumer models and supports use cases connected to employer-sponsored wellness programs and clinician remote physiologic monitoring workflows supported by CPT codes.
Supply resilience and domestic scale-up are also becoming an opportunity track, with manufacturers allocating capital to North American production footprints for next-generation systems. Roche announced a USD 550 million investment (May 2025) to expand its Indianapolis diagnostics manufacturing hub through 2030 and designated the site for Accu-Chek Smartguide CGM production, while Dexcom disclosed over USD 500 million of investment in San Diego during 2025 to support capacity expansion and R&D for future platforms. Alongside product evolution toward longer wear (for example, 15-day systems cleared in 2026) and implantable options that address adhesive-related dermatitis, these investments point to active commercialization efforts that vendors can leverage for broader payer coverage and new patient segments across the region.
Recent Industry Developments in North America Continuous Glucose Monitoring Market
- February 2026: Senseonics and Sequel Med Tech expanded the U.S. rollout of a full CGM-AID integrated solution based on the Eversense 365 CGM, broadening access to automated insulin delivery via interoperable device ecosystems. The initiative supports cross-vendor interoperability and expands the addressable patient pool for implantable CGM platforms.
- January 2026: Ascensia Diabetes Care signed a definitive agreement to transfer Eversense CGM commercialization to Senseonics, effective January 1, 2026 for the U.S., with European transfers planned for completion by June 30, 2026. The transaction consolidates commercialization under the manufacturer, aiming to simplify go-to-market execution and align long-term implantable CGM R&D with direct commercial control.
- August 2024: Abbott entered a global partnership with Medtronic to connect FreeStyle Libre CGM technology with Medtronic's automated insulin delivery and smart insulin pen systems. The partnership supports continued momentum toward cross-vendor integration and broadens the addressable installed base for CGM through insulin delivery platforms.
North America Continuous Glucose Monitoring Market Report Scope and Research Methodology
Market Definition and Coverage
This market covers the revenue generated from continuous glucose monitoring (CGM) systems used to track glucose levels on an ongoing basis across North America, including the full CGM setup needed for use in clinical and home settings.
Scope exclusions: The sizing excludes traditional fingerstick blood glucose meters and test strips, and it also excludes insulin pumps unless the value is explicitly part of the CGM system sale.
Segments Covered in This Report
- By Component
- Sensors
- Wearable
- Implantable
- Transmitters
- Receivers
- Sensors
- By Demography
- Paediatric
- Adult
- By End User
- Hospitals & Clinics
- Ambulatory Surgical & Specialty Diabetes Centers
- Home Care
- By Country
- United States
- Canada
- Mexico
Data Sources, Market Sizing, and Validation
Desk Research
Desk research was used to build the base fact set and to keep assumptions tied to real world adoption and access conditions in the United States, Canada, and Mexico. We relied on public health and regulatory sources such as CDC diabetes statistics, FDA device clearance and safety communications, Health Canada medical device information, and national statistics offices for population and healthcare spend context.
To avoid overcounting, the desk stage also checked how CGM usage is described by diabetes associations, peer reviewed clinical and health economics studies, and customs and trade releases where device shipment patterns are discussed at a high level. Company filings, investor presentations, and reputable press were used to cross-check product rollout timing, sensor wear duration claims, and broad channel mix statements, and a paid subscription for company financials and patent databases helped us interpret innovation pace without relying on paywalled reports. These examples are illustrative only, and many other public sources were reviewed for data collection, validation, and clarification during the study.
Primary Interviews and Surveys
Primary work focused on filling the gaps that public data does not resolve cleanly, mainly pricing logic, replacement cycles, and how adoption differs between clinic driven initiation and home renewals. We spoke with a balanced mix of manufacturers and channel participants, along with clinicians and diabetes program decision-makers, and then used those responses to sanity check the trend lines for the United States first, followed by Canada and Mexico coverage.
Distribution of primary research fieldwork respondents
| Company type | Respondent position |
|---|---|
| Top tier: 35% | CXOs: 13% |
| Mid tier: 43% | Functional/Unit leaders: 37% |
| Smaller Players: 22% | Managers: 50% |
Market-Sizing & Forecasting
The core model starts with a top-down demand pool build based on diabetes prevalence, the treated and monitored population, and the share of patients on CGM within key care settings. Those totals are then translated into value using practical price logic, where sensors drive most recurring revenue and transmitters and receivers are treated with their own replacement cadence.
To keep the numbers grounded, results are corroborated with selective bottom-up checks, including sampled average selling price ranges by product type, channel checks on subscription and reorder behavior, and a supplier roll-up for a small set of public revenue disclosures that can be linked to North America. Inputs that materially shift the estimate include sensor wear duration (days per sensor), device replacement cycle for durable parts, reimbursement coverage expansion, the split between home care versus hospital and specialty diabetes centers, and new user adds versus existing user renewals. When a bottom-up signal cannot be fully attributed by country, the gap is handled using population and access proxies, followed by interview-based adjustments.
For forecasting, scenario analysis is used around coverage and utilization, and the year-to-year curve is smoothed using trend-based time series logic so that step changes only appear when a real trigger is visible, such as regulatory expansion, payer policy shifts, or notable product refresh cycles that affect pricing and adherence.
Data Validation & Update Cycle
Validation is done in layers so that one data point does not drive the final outcome. Analysts compare the modeled revenue totals against independent signals such as diabetes population trends, stated CGM penetration discussions in public forums, and directional shipment and capacity commentary, and then investigate any outliers before sign-off.
When a variance is outside the expected band, assumptions are re-checked and the team re-contacts selected interviewees to confirm whether the change is real or simply a definition mismatch. Reports are refreshed annually, and interim updates are made when material events occur, such as major reimbursement changes or meaningful pricing resets. Before delivery, a fresh review pass is completed so clients receive the most current view that can be explained back to clear inputs.
Mordor Intelligence's North America Continuous Glucose Monitoring Market Estimate Compared With Other Published Estimates
Published market sizes for CGM in North America often vary because the scope boundary is not always the same, and because pricing and replacement assumptions are treated differently across studies. We summarized these differences using comparable year figures where available, and we focused on what could realistically move revenue totals at scale.
FDA and Health Canada device clearance activity, diabetes prevalence statistics, and recurring sensor consumption patterns are the checks that keep Mordor Intelligence tied to an active user and replenishment based demand pool, instead of a one-time device shipment view that can swing results. Another common gap is whether receivers and transmitters are counted as broad durable device revenue in every year, or only when replacement is expected, and currency timing choices can also create spread when values are converted and reported.
Benchmark comparison
| Source | Market Size | Gaps in Research Methodology |
|---|---|---|
| Mordor Intelligence | USD 8.96 B (2025) | |
| Industry Research Publisher A | USD 7.51 B (2025) | Uses a narrower country split and may apply more conservative penetration and sensor consumption assumptions, which reduces recurring revenue capture from ongoing replenishment. |
| Trade Commentary B | USD 6.56 B (2023) | Older base year and limited disclosure of what is included, and it likely mixes conservative pricing with broad market statements without explicitly modeling replacement cycles for durable components. |
The spread across the table mainly comes from how recurring sensor value is modeled, how durable parts are timed for replacement, and whether the country coverage is fully aligned to the North America definition. With clear input links to prevalence, uptake, and replenishment behavior, the final number remains traceable and easier for decision-makers to stress-test.
Key Questions Answered in the Report
How large is the North America continuous glucose monitoring market?
The market is expected to reach USD 10.38 billion in 2026 and is projected to grow to USD 21.56 billion by 2031.
Which component contributes the most revenue?
Sensors deliver 68.9% of 2025 revenue and lead the market’s 16.87% CAGR.
Why is Canada the fastest-growing geography?
Provincial reimbursement expansions in Ontario, Quebec, and British Columbia drive a 16.43% CAGR through 2031.
How are over-the-counter CGM models changing access?
FDA clearances for Abbott Libre 3 and Dexcom Stelo remove prescription barriers, enabling retail and e-commerce sales.
What is the main cost hurdle for uninsured users?
Annual consumable costs can reach USD 3,467, which equals more than 12% of median household income for many.