Market Overview
| Study Period | 2020 - 2030 |
|---|---|
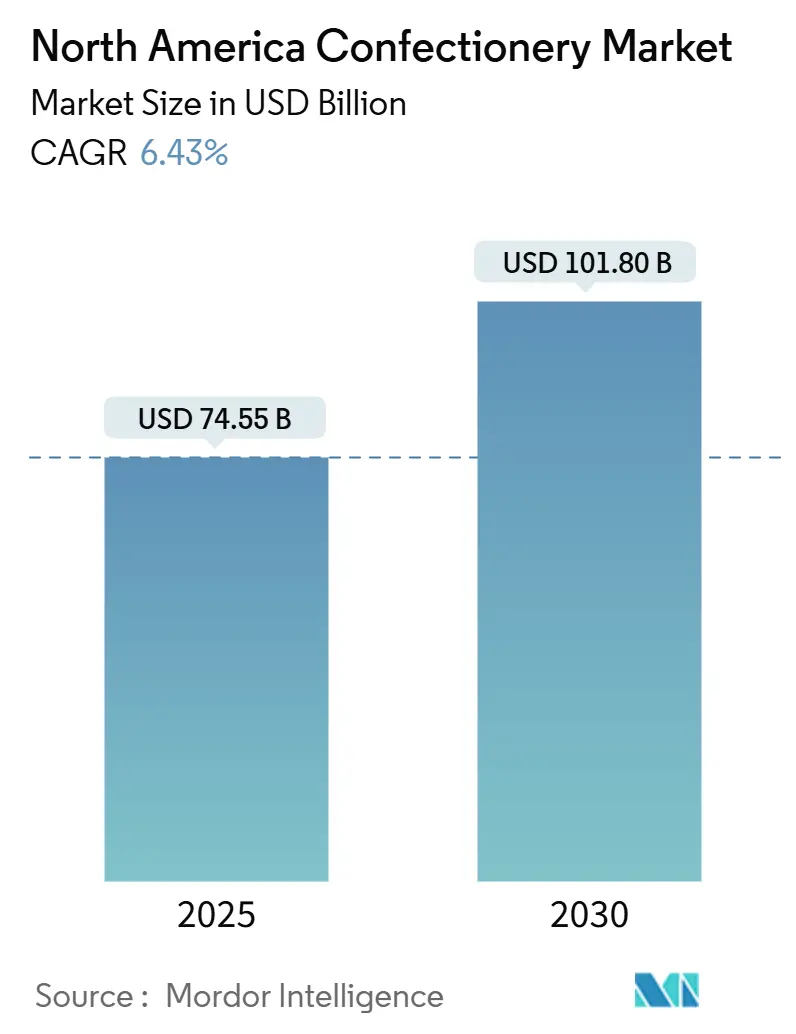
| Market Size (2025) | USD 74.55 Billion |
| Market Size (2030) | USD 101.80 Billion |
| Growth Rate (2025 - 2030) | 6.43% CAGR |
| Fastest Growing Market | Supermarket/Hypermarket |
| Largest Market | United States |
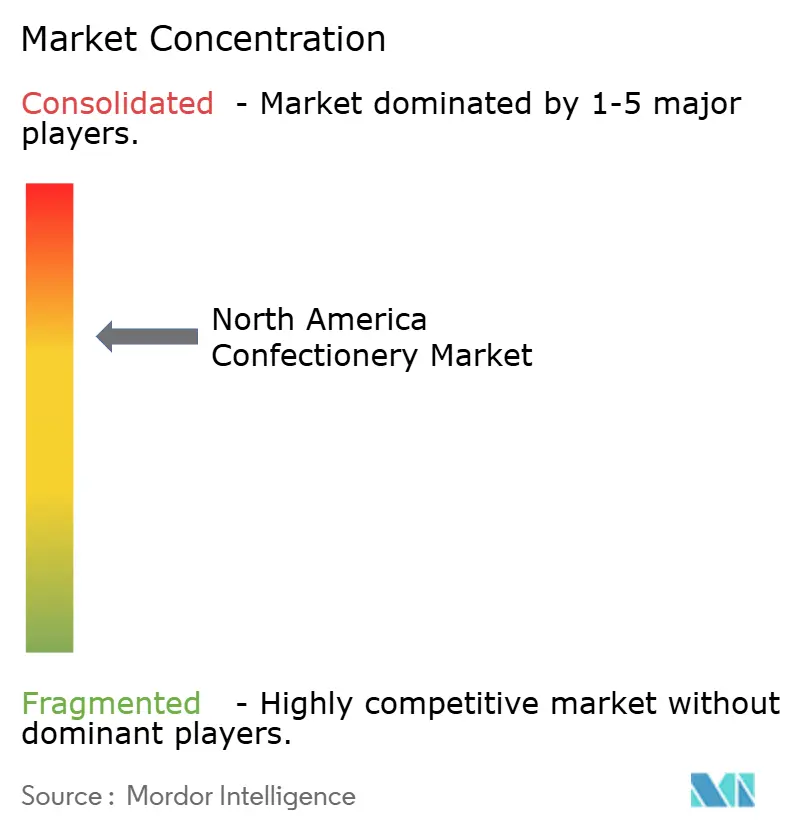
| Market Concentration | Medium |
Major Players*Disclaimer: Major Players sorted in no particular order Image © Mordor Intelligence. Reuse requires attribution under CC BY 4.0. |
|
North America Confectionery Market Analysis by Mordor Intelligence
The North America confectionery market size stands at USD 74.55 billion in 2025 and is projected to reach USD 101.80 billion by 2030, reflecting a 6.43% CAGR across the forecast window. Even as cocoa-price shocks squeeze gross margins and regulations tighten on sugar-content labeling, trends like premiumization, functional snacking, and the rise of e-commerce are driving growth. Manufacturers are navigating a delicate balance: introducing premium products while reformulating to reduce sugar, catering to a consumer base that cherishes indulgence yet seeks health alignment. AI-driven flavor ideation is becoming a cornerstone in product pipelines, streamlining development cycles and minimizing unsuccessful launches. However, mandates for sustainable packaging and a shortage of recycled aluminum are leading to significant capital expenditures, impacting profitability. In the North American confectionery market, competitive differentiation is increasingly reliant on end-to-end traceability, expedited direct-to-consumer rollouts, and value-added formats that command premium price points.
Key Report Takeaways
- By product type, chocolate captured 47.20% of the North America confectionery market share in 2024, while snack bars register the highest projected 7.12% CAGR through 2030.
- By packaging, single-serve formats held 56.31% of the North America confectionery market size in 2024, yet multipacks are poised for a 5.95% CAGR between 2025-2030.
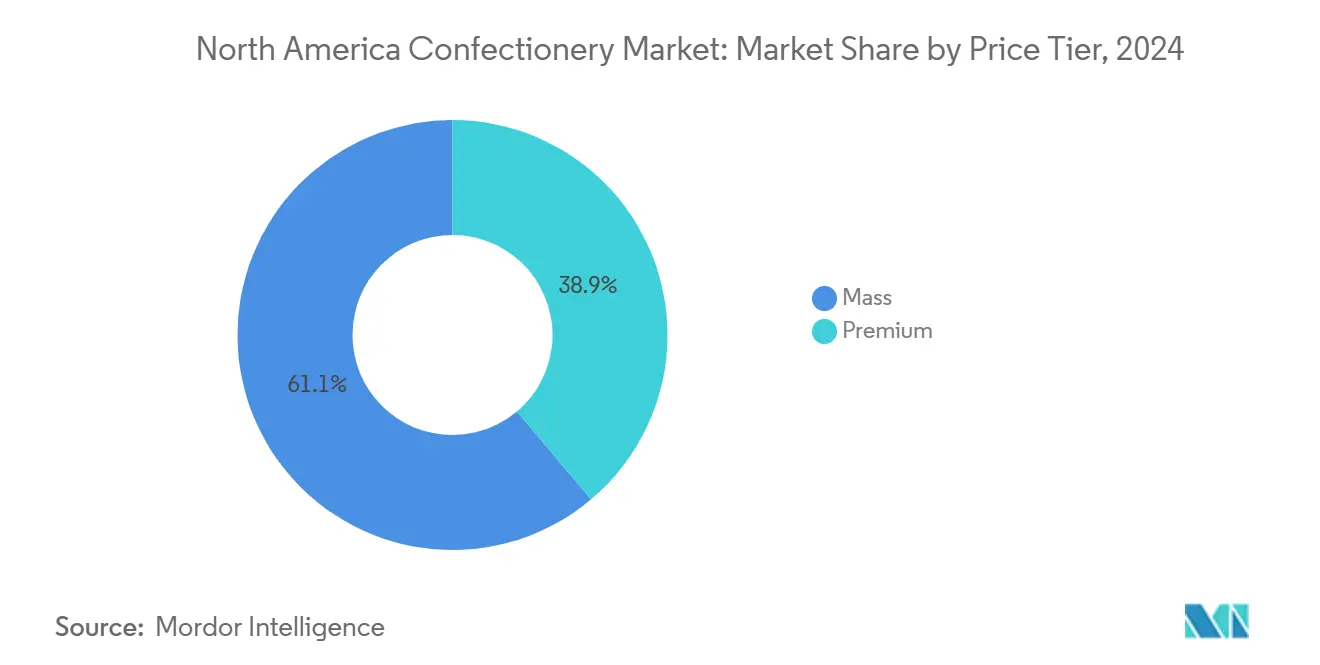
- By price tier, premium products accounted for 38.85% revenue share in 2024 and will advance at an 8.13% CAGR to 2030.
- By channel, supermarkets and hypermarkets led with 44.13% of the North America confectionery market share in 2024, whereas online retail is forecast to expand at a 7.12% CAGR through 2030.
- By geography, the United States represented 80.13% of 2024 revenues, yet Mexico charts the quickest 6.24% CAGR through 2030 .
North America Confectionery Market Trends and Insights
Drivers Impact Analysis
| Driver | (~) % Impact on CAGR Forecast | Geographic Relevance | Impact Timeline |
|---|---|---|---|
| Rising demand for premium and artisanal chocolate | +1.2% | United States, Canada, urban Mexico | Medium term (2-4 years) |
| Omni-channel and e-commerce expansion | +0.9% | North America-wide, strongest in United States metro areas | Short term (≤ 2 years) |
| Health-oriented innovation (reduced-sugar/functional) | +1.5% | United States, Canada, emerging Mexico | Long term (≥ 4 years) |
| C-store micro-fulfillment boosting impulse sales | +0.7% | United States, especially suburban and rural zones | Short term (≤ 2 years) |
| AI-driven flavor ideation accelerating NPD | +0.6% | North America-wide, led by major manufacturers | Medium term (2-4 years) |
| Sustainable packaging and ethical sourcing | +0.8% | United States, Canada, regulatory push in Mexico | Long term (≥ 4 years) |
| Source: Mordor Intelligence | |||
Understand The Key Trends Shaping This Market
Download PDF
Rising demand for premium and artisanal chocolate
As input costs rise, premium positioning helps defend profit margins. In North America, 64% of shoppers are now gravitating towards upscale confections. Additionally, half of these consumers are drawn to limited-edition lines, creating a sense of urgency that justifies higher price tags. With cross-shopping becoming the norm, even mainstream buyers are setting aside a portion of their budget for luxury bars, especially for gifting. Dark chocolate stands out as the premium choice, skillfully using single-origin sourcing and higher cacao percentages. This strategy allows producers to absorb rising cocoa costs without sacrificing volume. Craft producers are leveraging origin storytelling to secure shelf space, while established players are introducing bean-to-bar SKUs, emphasizing transparent partnerships with farmers, all in a bid to reclaim their share in North America's confectionery market.
Health-oriented innovation (reduced-sugar/functional)
Core strategies now embrace reduced-sugar and functional upgrades, once seen as fringe experiments. While intent-to-buy outpaces actual purchases by sixfold, manufacturers face a taste-texture gap, pushing them towards novel sweeteners like allulose and flavor-masking technology. Since 2020, protein fortification in snack bars, now merging with confectionery, has surged by nine percentage points, drawing in fitness-focused consumers. Adoption of plant-based chocolate is on the rise, but alternative-milk couvertures still struggle to match dairy's sensory standards. Brands mastering mouthfeel without a glycemic load stand poised to secure repeat customers and introduce new pricing dynamics in North America's confectionery landscape.
C-store micro-fulfillment boosting impulse sales
As highlighted in the NACS State of the Industry Report (2024), convenience stores are pivotal for candy consumers, offering quick access that fuels impulse purchases. Candy sales accounted for 3.6% of in-store revenue, marking a consistent year-on-year growth. With quicker restocking, c-stores can now offer a broader range of SKUs, including premium and functional items that were once absent in smaller formats, all without expanding shelf space[1]Source: National Association of Convenience Stores, State of the Industry Report 2024”, convenience.org. While aggregator commissions do nibble at c-store profits, the boost in sales from on-the-go shoppers who often pair quick dinners with dessert treats more than compensates for these fees. Moreover, maintaining brand visibility at the front counter of c-stores is crucial for tapping into North America's confectionery market, especially during drive-time.
Sustainable packaging and ethical sourcing
As recycled-content mandates and deforestation regulations tighten, brands face mounting cost pressures. A shortage of recycled aluminum has driven up wrapper prices and postponed compliance deadlines, creating significant challenges for manufacturers to meet sustainability goals. This has led brands to consider polymer pouches as an alternative, despite their lack of universal curbside collection, which could hinder recycling efforts. With consumers showing a growing preference for fair-trade labels that ensure verified premiums for farmers, traceability technologies like blockchain ledgers and QR codes are transitioning from experimental pilots to industry standards. These technologies not only enhance transparency but also build consumer trust by verifying ethical sourcing practices. In the North American confectionery market, major grocery chains are now adjusting their merchandising strategies, influenced by the push for sustainable practices and the increasing demand for environmentally responsible products[2]Source: American Military University, “ Sustainability in Retail: Green Practices for Businesses” , amu.apus.edu.
Restraints Impact Analysis
| Restraint | (~) % Impact on CAGR Forecast | Geographic Relevance | Impact Timeline |
|---|---|---|---|
| Cocoa price volatility and supply risk | -1.8% | North America-wide, chocolate-heavy portfolios | Short term (≤ 2 years) |
| Heightened sugar-content regulation and taxes | -1.1% | Mexico, United States state pilots, Canada monitoring | Medium term (2-4 years) |
| Shortage of recycled aluminum for packs | -0.4% | United States, Canada | Long term (≥ 4 years) |
| Shifting consumer health preferences | -0.9% | United States, Canada, emerging Mexico | Medium term (2-4 years) |
| Source: Mordor Intelligence | |||
Cocoa price volatility and supply risk
In 2024, cocoa futures experienced a significant surge due to crop failures in West Africa, causing a notable decline in chocolate gross margins. This increase in cocoa prices has placed immense pressure on manufacturers, particularly those operating in the premium chocolate segment, where maintaining specific flavor profiles and certifications is critical. While brands can mitigate some risks through hedging strategies, they still encounter challenges when physical cocoa beans differ in flavor profiles or certification standards required for premium product lines. Efforts to expand sourcing from Latin America face delays, as such initiatives typically require several years to mature, limiting any immediate solutions. Additionally, the complexity of establishing new supply chains and ensuring consistent quality further complicates these efforts. If retail prices increase proportionally to these cost pressures, a majority of consumers approximately six out of ten indicate they may reduce their purchase frequency, posing a substantial risk of immediate volume decline in the North American confectionery market. This potential contraction could have ripple effects across the supply chain, impacting not only manufacturers but also retailers and suppliers dependent on stable demand.
Heightened sugar-content regulation and taxes
In Mexico, a gram-based sugar levy has led to increased retail prices on various confections and prompted front-of-pack warnings, a move overseen by COFEPRIS. This regulation aims to curb sugar consumption and address rising health concerns, such as obesity and diabetes. Meanwhile, U.S. states are in discussions about implementing similar taxes to tackle public health issues. Although the FDA's added-sugar labeling has heightened consumer awareness, it hasn't yet driven a widespread shift towards low-sugar SKUs. However, the growing scrutiny around sugar content is influencing purchasing decisions, particularly among health-conscious consumers. Mid-tier brands are feeling the brunt of reformulation costs, as adapting recipes to meet regulatory and consumer demands often requires significant investment. This financial strain is pushing these brands towards mergers and acquisitions. In the North American confectionery sector, scaling up is becoming a strategic response to manage compliance costs and maintain competitiveness in an evolving regulatory landscape.
Segment Analysis
By Product Type: Functional Bars Outpace Tradition
In 2024, chocolate commands a dominant 47.20% share of North America's confectionery revenues. Milk and white chocolates lead this segment, thanks to their widespread consumer appeal and pivotal roles in seasonal promotions, gifting, and impulse retail purchases. Their versatility, spanning bars, truffles, and covered snacks, solidifies their market position, even amidst challenges like cocoa price hikes and the rising commoditization of milk and white varieties. These chocolates are often marketed with innovative packaging and promotional campaigns, further enhancing their visibility and consumer reach. Meanwhile, dark chocolate, celebrated for its premium status and health benefits, offers a cushion against volume declines. Its growing popularity among health-conscious consumers and its association with antioxidants and lower sugar content contribute to its steady demand.
Snack bars are the North American confectionery market's fastest-growing segment, boasting a 7.12% CAGR. These bars, featuring protein, energy, and fruit-nut varieties, blend convenience with nutrition, resonating with health-conscious consumers. The spillover of sports-nutrition aisles into mainstream retail checkouts underscores this segment's rising prominence. While protein-enriched bars cater to muscle recovery, adaptogen-infused varieties combat cognitive fatigue, gradually usurping space once held by traditional chocolates. Additionally, the segment benefits from increasing product innovation, such as plant-based protein bars and clean-label offerings, which align with consumer demand for transparency and sustainability. This growth signals a notable shift towards nutrition-centric snacking, reflecting changing consumer preferences for enhanced macro- and micronutrient fortification in confections.

Note: Segment shares of all individual segments available upon report purchase
Get Detailed Market Forecasts at the Most Granular Levels
Download PDF
By Packaging Type: Multipacks Gain Share
In 2024, North America's confectionery market sees multipacks taking the lead with a commanding 56.31% share. These multipacks appeal to households mindful of inflation, emphasizing savings per unit over mere convenience. With the rise of club stores and e-commerce's subscribe-and-save programs, bulk purchases have become more accessible, allowing families to stock up on non-perishable treats. While these multipacks may lead to fewer shopping trips, they offer consumers both value and flexible portioning. Innovations like resealable packaging further enhance this appeal. However, the addition of zipper closures and modified-atmosphere packaging brings complexity and costs, presenting challenges, especially for smaller producers.
Single-serve formats, while trailing behind multipacks in market share, are emerging as the fastest-growing segment with a 5.95% CAGR. These single-serve confections are staples in convenience stores and checkout counters, appealing to both on-the-go consumers and impulse buyers. Yet, rising inflation in cocoa and packaging materials is driving up per-unit costs, making single-serve items pricier. Despite this, their convenience and portion control keep them in high demand. Innovations like resealable multipacks aim to balance value and convenience. Sustainability concerns are reshaping packaging choices. A scarcity of recycled aluminum is driving up wrapper prices, leading brands to consider polymer films, though these lack curbside recycling options. In navigating the North American confectionery market, brands face the challenge of balancing cost, shelf life, and environmental credentials to meet retailer expectations[3]Source : Environmental Protection Agency, “Containers and Packaging: Product-Specific Data”, epa.gov.
By Price Tier: Premium Widens Lead
In 2024, the mass-market confectionery segment commanded a dominant 61.15% share, despite grappling with intense commoditization pressures. Private-label brands have made significant inroads into certain categories, undermining decades-old consumer brand loyalty traditionally fostered through extensive advertising. While many consumers still gravitate towards mass-market offerings for their daily choices, the segment's growth is increasingly stymied by the ascent of private labels and a shift towards a more premium-conscious consumer base. This dynamic paints a picture of a bifurcated market: mass-market products lead in volume, yet premium confectionery is witnessing a swift ascent, underscoring changing consumer preferences and spending habits.
North America's premium confectionery segment is on a rapid ascent, boasting a projected CAGR of around 8.13% through 2030. Today's consumers are channeling their discretionary spending into premium treats that prioritize experiential value, authentic craftsmanship, and distinctive production methods. Techniques like single-origin sourcing and artisanal methods are gaining prominence. Moreover, limited-edition releases and premium pricing strategies are effectively counterbalancing volume dips in everyday snacking. The market is witnessing a polarization: mid-tier brands are ceding ground to both upscale premium brands and value-driven private labels. Additionally, cross-shopping trends are emerging, with mainstream consumers seamlessly blending purchases of both mass and premium products based on occasion.
Get Detailed Market Forecasts at the Most Granular Levels
Download PDF
By Distribution Channel: Online Gains Momentum
In 2024, supermarkets and hypermarkets command a dominant 44.13% share of the North American confectionery market. These retail giants, including Walmart, Kroger, and Target, capitalize on their vast reach and strategic in-store placements, especially at checkout lanes, to drive sales. By offering a diverse product range that spans from economy to premium, they cater to a broad consumer base. Their expansive infrastructure not only accommodates a wide array of confectionery products but also ensures easy access for consumers. These formats also benefit from established supply chain networks, enabling them to maintain consistent stock levels and introduce new products efficiently. Meanwhile, convenience stores, bolstered by micro-fulfillment capabilities, cater to immediate gratification needs with an ever-expanding assortment. Their smaller footprint and proximity to residential areas make them a preferred choice for quick purchases, further solidifying their role in the distribution landscape.
Online retail is emerging as the fastest-growing distribution channel, with projections indicating a CAGR of around 7.12%. This surge is largely attributed to consumers' growing preference for e-commerce, drawn by its convenience, extensive product range, and enticing subscription models like "subscribe-and-save." Digital platforms enjoy advantages such as reduced slotting fees and access to invaluable consumer data, empowering brands to tailor offerings and hone in on specific audiences. This channel proves especially beneficial for craft and niche confectionery makers, allowing them to sidestep traditional shelf limitations and connect with a broader demographic. The rise of mobile shopping apps and social media integration further enhances the online retail experience, making it easier for consumers to discover and purchase confectionery products. Additionally, specialty avenues like vending machines and dollar stores carve out their niche, serving as platforms for flavor experimentation and distinctive consumer interactions. These channels also provide opportunities for brands to test limited-edition products and gather consumer feedback in a cost-effective manner.
Geography Analysis
In 2024, the U.S. accounts for 80.13% of total receipts, experiencing modest dollar growth despite volume declines of 3.3% in chocolate and 0.3% in non-chocolate categories. While couponing and multipacks offer some relief, they can't fully counteract the downturn caused by shifting consumer preferences and economic pressures. Additionally, private-label brands face heightened erosion among value-driven households, as consumers increasingly prioritize affordability. Premium SKUs thrive during gifting and celebration moments, supported by a growing trend toward indulgent purchases for special occasions, but mainstream candy lines see little movement due to stagnant demand. Coastal metro areas lead in e-commerce growth, empowering direct-to-consumer brands to challenge established shelf presence by leveraging digital platforms and targeted marketing. As cocoa prices surge, retail price sensitivity sharpens in North America's confectionery landscape, with consumers becoming more cautious about discretionary spending.
Mexico, buoyed by rising urban incomes and a youthful populace, spearheads regional growth with a 6.24% CAGR. The country's sugar tax incites continuous reformulations, nudging major brands to introduce localized, reduced-sugar products to dodge fiscal penalties and cater to health-conscious consumers. Meanwhile, COFEPRIS's front-of-pack warnings pose financial challenges for smaller domestic players, inadvertently bolstering multinationals' competitive edge by creating barriers to entry. Cultural events like Día de Muertos and Christmas ensure consistent demand surges, enabling manufacturers to fine-tune capacity and promotional strategies to maximize seasonal sales. These festivities also provide opportunities for brands to introduce limited-edition products, further driving consumer interest and engagement.
Canada, echoing U.S. market saturation, grapples with similar pressures from private labels and scrutiny over sugar content. Health Canada is contemplating front-of-pack labeling akin to Mexico's, hinting at potential compliance costs that could disproportionately impact smaller players. Under the USMCA, currency shifts introduce pricing unpredictability for cross-border supply chains, complicating cost management for manufacturers. While the rest of North America plays a minor role, its smaller markets serve as testing grounds for innovations before they roll out across the continent. These territories allow manufacturers to assess consumer response and refine product offerings, minimizing risks associated with broader market launches.
Competitive Landscape
In North America, the confectionery market showcases a moderate level of concentration. While major players like Hershey, Mars, Mondelēz, Nestlé, and Ferrero dominate the landscape, they continually grapple with challenges posed by emerging craft brands and the encroachment of private labels. These industry giants are adopting a three-pronged strategy: they are premiumizing their offerings to boost margins, reformulating products with a health focus to meet both regulatory standards and consumer demands, and expanding through omni-channel approaches to lessen their dependence on traditional retail outlets. There's a burgeoning interest in 'functional' confections that promise benefits beyond mere taste, plant-based options catering to the flexitarian demographic, and eco-friendly packaging that aligns with producer responsibility mandates while maintaining essential properties.
Brands like KIND, Clif Bar, and Quest Nutrition have disrupted the status quo, marketing their bars as meal replacements rather than mere treats. This strategy has allowed them to gain traction in convenience stores and gyms, areas where traditional chocolate products struggle to establish credibility.Technology is becoming a key differentiator in the competitive landscape. For instance, AI-driven flavor ideation has slashed new product development cycles from 18 months to under a year, allowing companies to swiftly adapt to emerging trends. Highlighting this trend, Mars revealed in its 2024 annual report that it has invested in machine-learning platforms. These platforms sift through social media sentiments and search data, forecasting flavor preferences even before traditional consumer surveys validate them. This proactive approach significantly mitigates the risk of product launches that could leave retailers with unsold inventory.
Brands navigate a tightrope when communicating functional benefits, especially with the FDA's regulations on nutrient-content claims and structure-function statements. While manufacturers are eager to highlight benefits, they must steer clear of language that suggests drug-like efficacy. Certifications like ISO 22000 for food safety and endorsements from Fairtrade International bolster a brand's premium positioning. However, these accolades come with added costs and complexities, especially when tracing cocoa from its farm origins to the final product, a journey essential for maintaining these certifications.
North America Confectionery Industry Leaders
-
Ferrero International SA
-
Mars Incorporated
-
Mondelēz International Inc.
-
Perfetti Van Melle BV
-
The Hershey Company
- *Disclaimer: Major Players sorted in no particular order
Need More Details on Market Players and Competitors?
Download PDF
Recent Industry Developments
- November 2025: Ice Breakers has unveiled its innovative flavor-shifting gum, which boasts a unique technology that transitions from one flavor to another during chewing. This new product aims to enhance the consumer experience by offering a dynamic and engaging taste journey, setting it apart in the competitive gum market.
- November 2025: Mars Inc. has unveiled a fresh lineup of confectionery products, including M&M's, Twix, and more. Among the new offerings, M&M's introduces 'Winter Blend', a flavor crafted specifically for winter-themed baking and gifting.
- October 2025: Zotter Chocolates has unveiled its latest creation: the Brains and Eggs chocolate bar, a unique addition to its product lineup that showcases the brand's innovative approach to chocolate-making.
- June 2025: Cacao Hunters brand has unveiled a premium line of chocolates, crafted from single-origin cacao. These chocolates are designed to offer a unique flavor profile that reflects the distinct characteristics of their origin. The brand emphasizes its commitment to ethics, asserting that all ingredients are responsibly and sustainably sourced.
North America Confectionery Market Report Scope
Chocolate, Gums, Snack Bar, Sugar Confectionery are covered as segments by Confections. Convenience Store, Online Retail Store, Supermarket/Hypermarket, Others are covered as segments by Distribution Channel. Canada, Mexico, United States are covered as segments by Country.
By Product Type
| Chocolate | Dark Chocolate | |
| Milk and White Chocolate | ||
| Sugar Confectionery | Hard Candy | |
| Mints | ||
| Pastilles, Gummies, and Jellies | ||
| Toffees and Nougats | ||
| Lollipops | ||
| Other | ||
| Snack Bar | Cereal Bar | |
| Energy Bar | ||
| Protein Bar | ||
| Fruit and Nut Bar | ||
| Gums | Chewing Gum | Sugar Chewing Gum |
| Sugar-free Chewing Gum | ||
| Bubble Gum | ||
By Packaging Type
| Single-serve |
| Multipacks |
By Price Tier
| Mass |
| Premium |
By Distribution Channel
| Supermarket/Hypermarket |
| Convenience Store |
| Online Retail |
| Others |
By Geography
| United States |
| Canada |
| Mexico |
| Rest of North America |
| By Product Type | Chocolate | Dark Chocolate | |
| Milk and White Chocolate | |||
| Sugar Confectionery | Hard Candy | ||
| Mints | |||
| Pastilles, Gummies, and Jellies | |||
| Toffees and Nougats | |||
| Lollipops | |||
| Other | |||
| Snack Bar | Cereal Bar | ||
| Energy Bar | |||
| Protein Bar | |||
| Fruit and Nut Bar | |||
| Gums | Chewing Gum | Sugar Chewing Gum | |
| Sugar-free Chewing Gum | |||
| Bubble Gum | |||
| By Packaging Type | Single-serve | ||
| Multipacks | |||
| By Price Tier | Mass | ||
| Premium | |||
| By Distribution Channel | Supermarket/Hypermarket | ||
| Convenience Store | |||
| Online Retail | |||
| Others | |||
| By Geography | United States | ||
| Canada | |||
| Mexico | |||
| Rest of North America | |||
Need A Different Region or Segment?
Customize Now
Market Definition
- Milk and White Chocolate - Milk chocolates is a solid chocolate made with milk (in the form of either milk powder, liquid milk, or condensed milk) and cocoa solids. White chocolate is made from cocoa butter and milk and contains no cocoa solids whatsoever. The scope includes regular chocolates, low-sugar, and sugar-free variants
- Toffees & Nougats - Toffees include hard, chewy, and small or one-bite candies marketed with labels as toffee or toffee-like confectionery. Nougat is a chewy confection with almond, sugar, and egg white as a basic ingredient; and it originated in Europe and Middle East countries.
- Cereals Bars - A snack composed of breakfast cereal that has been compressed into a bar shape and is held together with a form of edible adhesive. The scope includes snack bars made with cereals such as rice, oats, corn, etc. mixed with a binding syrup. These also include products labeled as cereal bars, cereal treat bars, or grain bars.
- Chewing Gum - This is a preparation for chewing, usually made of flavored and sweetened chicle or such substitutes as polyvinyl acetate. The types of chewing gums included in the scope are sugar-chewing gums and sugar-free chewing gums
| Keyword | Definition |
|---|---|
| Dark Chocolate | Dark chocolate is a form of chocolate containing cocoa solids and cocoa butter without the milk. |
| White Chocolate | White chocolate is the type of chocolate containing the highest percentage of milk solids, typically around or over 30 percent. |
| Milk Chocolate | Milk chocolate is made from dark chocolate that has a low cocoa solid content and higher sugar content, plus a milk product. |
| Hard Candy | A candy made of sugar and corn syrup boiled without crystallizing. |
| Toffees | A hard, chewy, often brown sweet that is made from sugar boiled with butter. |
| Nougats | A chewy or brittle candy containing almonds or other nuts and sometimes fruit. |
| Cereal bar | A cereal bar is a bar-shaped food product, made by pressing cereals and usually dried fruit or berries, which are in most cases held together by glucose syrup. |
| Protein bar | Protein bars are nutrition bars that contain a high proportion of protein to carbohydrates/fats. |
| Fruit & Nut bar | These are often based on dates with other dried fruit and nut additions and, in some cases, flavorings. |
| NCA | The National Confectioners Association is an American trade organization that promotes chocolate, candy, gum and mints, and the companies that make these treats. |
| CGMP | Current good manufacturing practices are those conforming to the guidelines recommended by relevant agencies. |
| Unstandardized foods | Unstandardized foods are those that do not have a standard of identity or that deviate from a prescribed standard in any manner. |
| GI | The glycemic index (GI) is a way of ranking carbohydrate-containing foods based on how slowly or quickly they are digested and increase blood glucose levels over a period of time |
| Skimmed milk powder | Skimmed milk powder is obtained by removing water from pasteurized skim milk by spray-drying. |
| Flavanols | Flavanols are a group of compounds found in cocoa, tea, apples, and many other plant-based foods and beverages. |
| WPC | Whey protein concentrate- the substance obtained by the removal of sufficient nonprotein constituents from pasteurized whey so that the finished dry product contains greater than 25% protein. |
| LDL | Low density Lipoprotein- the bad cholesterol |
| HDL | High density Lipoprotein- the good cholesterol |
| BHT | butylated Hydroxytoluene is a lab-made chemical that is added to foods as a preservative. |
| Carrageenan | Carrageenan is an additive used to thicken, emulsify, and preserve foods and drinks. |
| Free form | Not containing certain ingredients, such as gluten, dairy, or sugar. |
| Cocoa butter | It is a fatty substance obtained from cocoa beans, used in the manufacture of confectionery. |
| Pastellies | A type of of Brazilian candy made from sugar, eggs, and milk. |
| Draggees | Small, round candies that are coated with a hard sugar shell |
| CHOPRABISCO | Royal Belgian Association of the chocolate, pralines, biscuit, and confectionery industry- A trade association that represents the Belgian chocolate industry. |
| European Directive 2000/13 | A European Union directive that regulates the labeling of food products |
| Kakao-Verordnung | The German chocolate ordinance, a set of regulations that define what can be labeled as "chocolate" in Germany. |
| FASFC | Federal Agency for the Safety of the Food Chain |
| Pectin | A natural substance that is derived from fruits and vegetables. It is used in confectionery to create a gel-like texture. |
| Invert sugars | A type of sugar that is made up of glucose and fructose. |
| Emulsifier | A substance that helps to mix to liquids that does not mix together. |
| Anthocyanins | A type of flavonoid that is responsible for the red, purple, and blue colors of confectionery. |
| Functional Foods | Foods that have been modified to provide additional health benefits beyond basic nutrition. |
| Kosher certificate | This certification verifies that the ingredients, production process including all machinery, and/or food-service process complies with the standards of Jewish dietary law |
| Chicory root extract | A natural extract from the chicory root that is a good source of fiber, calcium, phosphorous, and folate |
| RDD | Recommended daily dose |
| Gummies | A chewy gelatin-based candy that is often flavored with fruit. |
| Nutraceuticals | Food or dietary supplements that are claimed to have health benefits. |
| Energy bars | Snack bars that are high in carbohydrates and calories are designed to provide energy on the go. |
| BFSO | Belgian Food Safety Organization for the food chain. |
Need More Details on Market Definition?
Ask a Question
Research Methodology
Mordor Intelligence follows a four-step methodology in all our reports.
- Step-1: Identify Key Variables: In order to build a robust forecasting methodology, the variables and factors identified in Step 1 are tested against available historical market numbers. Through an iterative process, the variables required for market forecast are set, and the model is built on the basis of these variables.
- Step-2: Build a Market Model: Market-size estimations for the forecast years are in nominal terms. Inflation is not a part of the pricing, and the average selling price (ASP) is kept constant throughout the forecast period for each country.
- Step-3: Validate and Finalize: In this important step, all market numbers, variables, and analyst calls are validated through an extensive network of primary research experts from the market studied. The respondents are selected across levels and functions to generate a holistic picture of the market studied.
- Step-4: Research Outputs: Syndicated Reports, Custom Consulting Assignments, Databases & Subscription Platforms

Get More Details On Research Methodology
Download PDF


