
North America Commercial LED Lighting Market Size and Share
Market Overview
| Study Period | 2020 - 2031 |
|---|---|
| Forecast Data Period | 2026 - 2031 |
| Base Year Market Size (2025) | USD 8.58 Billion |
| Market Size (2026) | USD 10.03 Billion |
| Market Size (2031) | USD 19.72 Billion |
| Growth Rate (2026 - 2031) | 14.48 % |
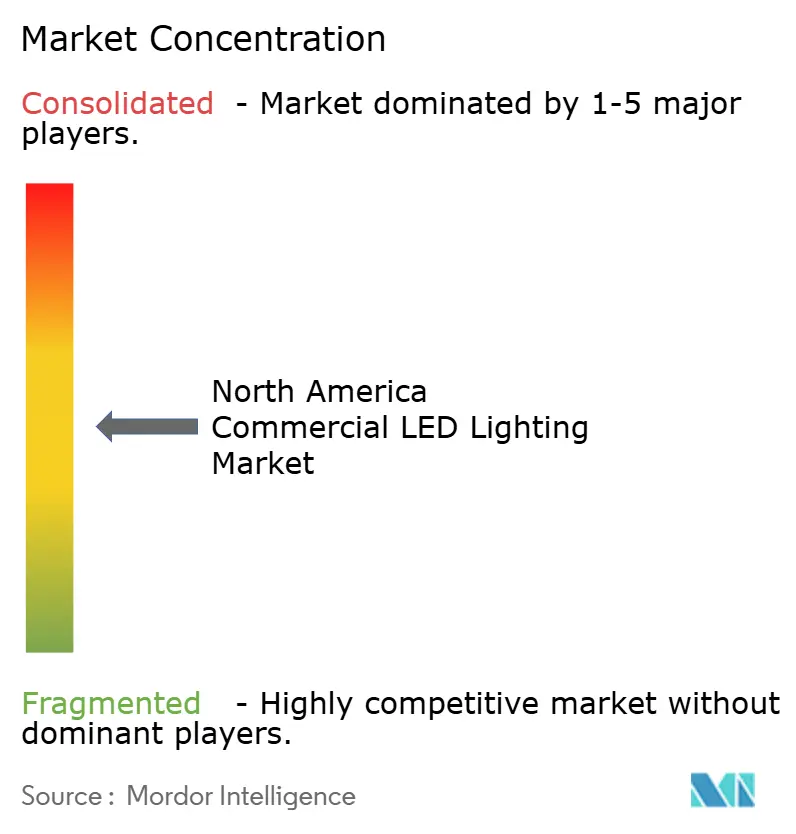
| Market Concentration | Medium |
Major Players *Disclaimer: Major Players sorted in no particular order Image © Mordor Intelligence. Reuse requires attribution under CC BY 4.0. | |
North America Commercial LED Lighting Market Analysis by Mordor Intelligence
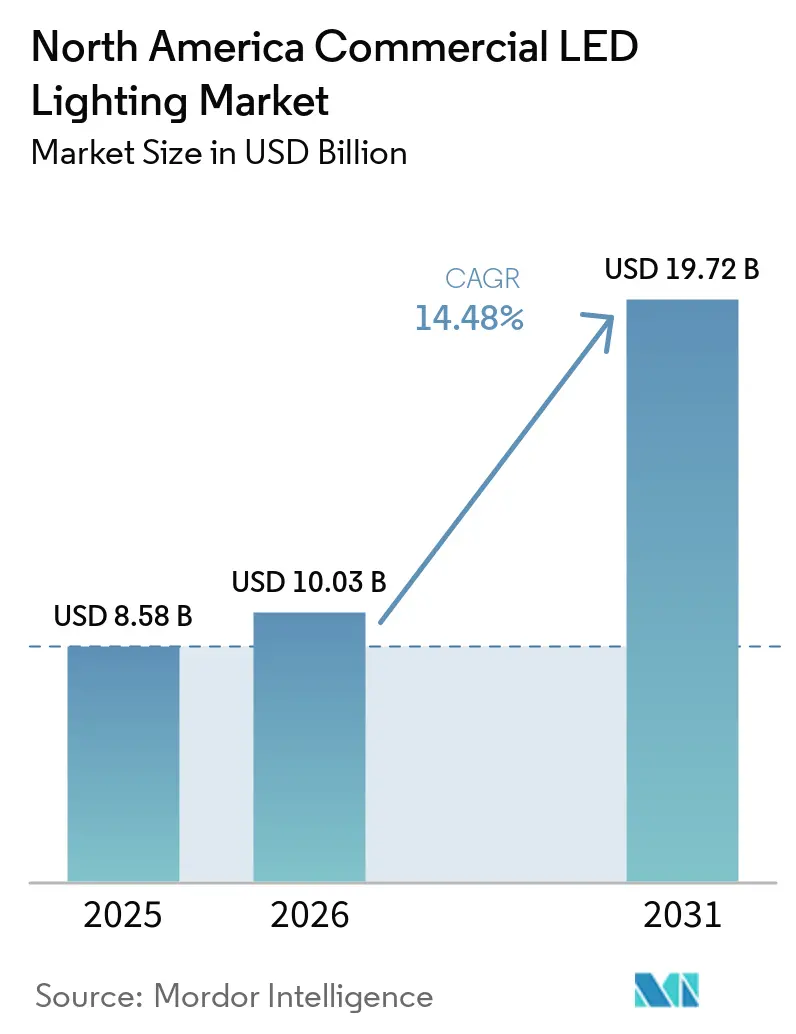
The North America commercial LED lighting market size is projected to expand from USD 8.58 billion in 2025 and USD 10.03 billion in 2026 to USD 19.72 billion by 2031, registering a CAGR of 14.48% between 2026 and 2031. Regulatory pressure, corporate decarbonization programs, and the growing role of connected luminaires are reshaping procurement decisions across offices, factories, and vertical farms. Vendors now differentiate through integrated controls, data analytics, and Lighting-as-a-Service contracts rather than through hardware efficiency alone. Tariff realignments under the United States-Mexico-Canada Agreement encourage regional manufacturing, while component shortages and interoperability hurdles complicate rollouts. Overall, retrofit demand dominates as roughly 1 billion fluorescent fixtures remain in service across the region.
Key Report Takeaways
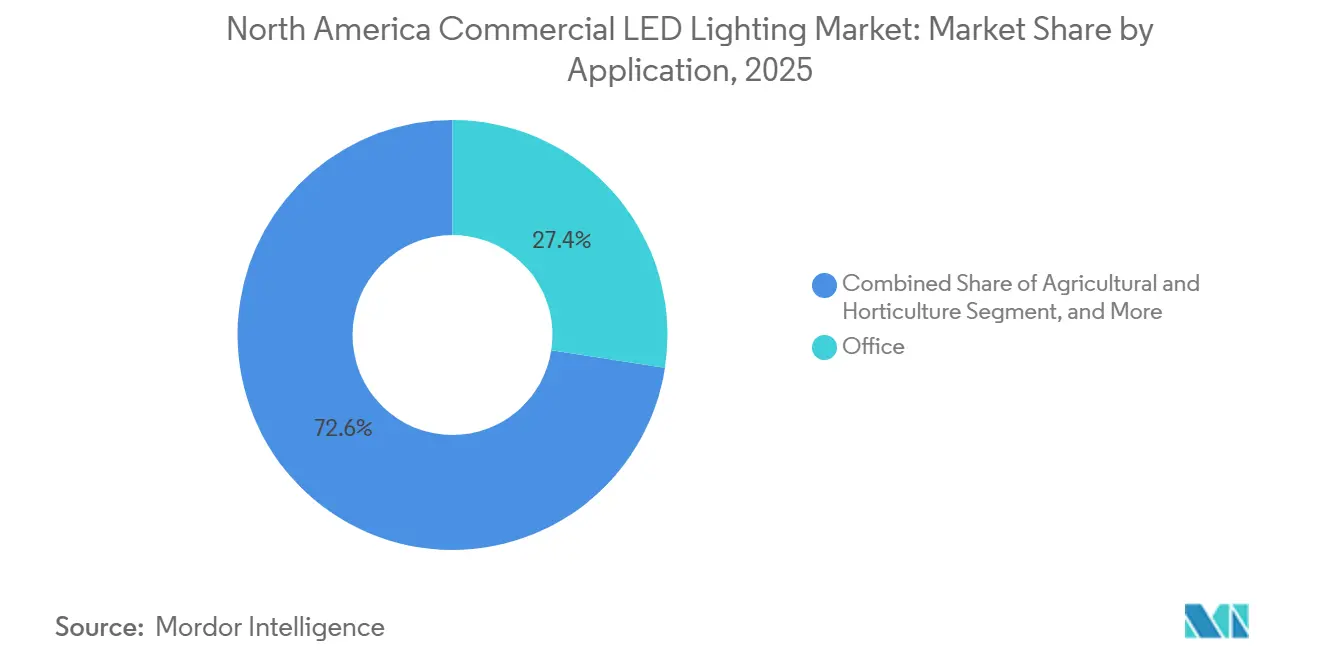
- By application, office spaces led with 27.43% revenue share in 2025, whereas agricultural and horticulture lighting is poised to post the fastest 14.89% CAGR through 2031.
- By form factor, troffers commanded 23.17% revenue share in 2025, while track lights are on track for the highest 14.94% CAGR over 2026-2031.
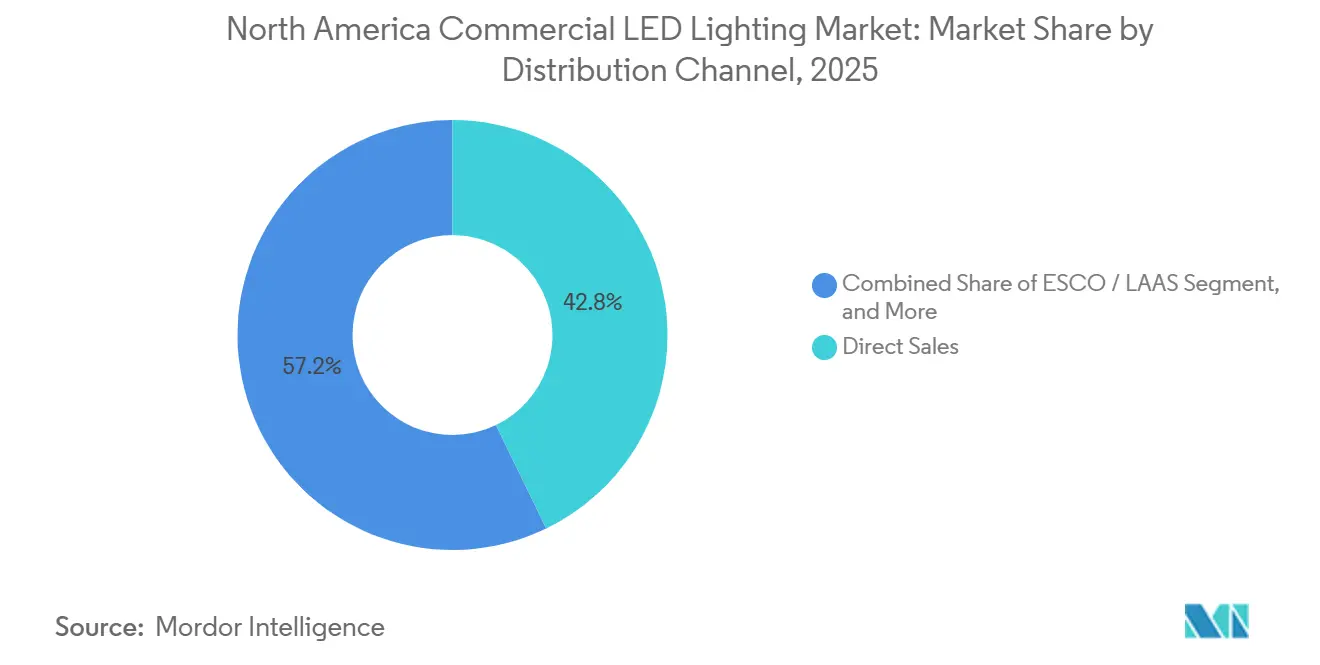
- By distribution channel, direct sales represented 42.82% of 2025 turnover, whereas Energy Service Company and Lighting-as-a-Service providers are forecast to expand at a 15.23% CAGR between 2026 and 2031.
- By installation type, retrofit projects generated 64.53% of 2025 spending and are projected to grow at a 15.04% CAGR through 2031.
Note: Market size and forecast figures in this report are generated using Mordor Intelligence’s proprietary estimation framework, updated with the latest available data and insights as of 2026.
Market Trends and Insights
Drivers Impact Analysis of North America Commercial LED Lighting Market*
| Driver | (~) % Impact on CAGR Forecast | Geographic Relevance | Impact Timeline |
|---|---|---|---|
| Stringent Energy-Efficiency Regulations and Building Codes | +2.1% | United States, Canada (provincial codes), Mexico (NOM standards) | Medium term (2-4 years) |
| Declining LED Luminaire Prices and Total Cost-of-Ownership Advantage | +1.8% | North America-wide | Short term (≤ 2 years) |
| Growth of Smart, Connected and IoT-Enabled Lighting Systems | +2.3% | United States (major metros), Canada (Toronto, Vancouver), Mexico (industrial corridors) | Medium term (2-4 years) |
| Shift Toward Human-Centric and Wellness-Focused Lighting in Workplaces | +1.4% | United States, Canada (office-dense cities) | Medium term (2-4 years) |
| Corporate Net-Zero and ESG Targets Accelerating Retrofit Demand | +2.0% | United States, Canada (corporate headquarters clusters) | Short term (≤ 2 years) |
| Demand from Indoor Vertical Farming and Micro-Fulfillment Centers | +1.6% | United States (urban peripheries), Canada (Ontario, British Columbia) | Long term (≥ 4 years) |
| Source: Mordor Intelligence | |||
Stringent Energy-Efficiency Regulations and Building Codes
New federal and provincial standards eliminate most legacy lamps, so owners replace fluorescents even when payback modelling is incomplete. U.S. rules finalized in 2024 ban halogen and incandescent options, while Canada’s 2025 code lifts minimum efficacy thresholds. Mexico’s NOM-030-ENER sets LED-equivalent baselines in public buildings. As catalogue lines for non-compliant products disappear, distributors standardize on LEDs, making code-driven conversions the default in healthcare and education.
Declining LED Luminaire Prices and Total-Cost-of-Ownership Advantage Accelerate Commercial Adoption
Rapid cost compression across LED packages and drivers lowers upfront fixture prices, enabling projects to justify payback periods shorter than two years in many commercial retrofits. Contemporary troffer designs deliver 110 lm/W efficacy 40% higher than fluorescent references, while extending rated life to roughly 85,000 hours; maintenance cycles drop proportionally, cutting operating expenses for facility managers.[1] High-bay conversions record energy savings of 50-70% in distribution centers, generating six-figure annual utility reductions in large venues. Utility incentives across multiple U.S. states further shave 10-15% from capital costs, tipping financing decisions decisively toward LED. Together, these economic levers reinforce the North America Commercial LED Lighting market’s momentum in the short term as payback math becomes compelling even for budget-constrained property owners.[2]
Growth of Smart, Connected, and IoT-Enabled Lighting Creates New Value Propositions
LED luminaires embedded with wireless radios, environmental sensors, and edge computing transform lighting grids into data backbones for smart buildings. Power-over-Ethernet architectures carry both energy and IP connectivity, allowing facilities to orchestrate occupancy-based dimming, indoor positioning, and space utilization analytics from a single dashboard. Case studies demonstrate energy savings well above 70% when advanced controls overlay standard LED efficiencies, driving the North America Commercial LED Lighting market toward holistic building-as-a-platform models. Vendors bundle software subscriptions that automate predictive maintenance and sustainability reporting, unlocking recurring revenue streams. Open-protocol ecosystems such as Bluetooth Mesh reduce vendor lock-in fears and accelerate specification uptake in new commercial developments.[3]
Shift Toward Human-Centric and Wellness-Focused Lighting Drives Premium Segment Growth
Employers and property developers link lighting quality to occupant productivity and well-being, spurring adoption of circadian-tuned systems that modulate spectrum and intensity over the day. Studies reveal up to 12% uplift in task performance under biologically aligned illumination, enticing corporate tenants eager to draw employees back to offices post-pandemic. Healthcare providers implement tunable-white fixtures that support patient circadian rhythms, reporting improvements in recovery metrics and sleep quality. Educational institutions cite both visual-comfort gains and 40% energy reductions after classroom upgrades, reinforcing the dual economic and human-factor returns. Although premium pricing remains a barrier for value-oriented segments, wellness-focused solutions command higher margins and diversify vendor portfolios in the North America Commercial LED Lighting market.
Restraints Impact Analysis of North America Commercial LED Lighting Market*
| Restraint | (%) Impact on CAGR Forecast | Geographic Relevance | Impact Timeline |
|---|---|---|---|
| Price erosion squeezing vendor margins | -1.8% | Entire region, strongest pressure on mid-tier firms | Short term (≤ 2 years) |
| High retrofit and installation costs in legacy facilities | -1.5% | Older commercial buildings across United States and Canada | Medium term (2-4 years) |
| Critical component shortages (drivers, ICs) | -1.2% | Global supply chain, regional impact | Short term (≤ 2 years) |
| Competition from OLED/micro-LED panels | -0.9% | Niche high-end U.S. projects | Long term (≥ 4 years) |
| Source: Mordor Intelligence | |||
Price Erosion Squeezing Vendor Margins Intensifies Competitive Pressure
Commoditization in basic luminaires fuels downward price pressure, challenging manufacturers to protect profitability. Market leaders such as Signify and mid-tier brands alike witness share price volatility as investors question growth prospects amid falling average selling prices.. Acuity Brands counters the trend by prioritizing intelligent-spaces solutions, which expanded 16.7% in fiscal 2024 and lifted earnings per share 24.9% despite a topline dip. Smaller manufacturers lacking scale or specialization explore mergers or exit, accelerating consolidation within the North America Commercial LED Lighting market. Tariff uncertainty, especially proposals to levy 25% duties on Mexican-assembled luminaires, adds cost risk, complicating pricing strategies for vendors with cross-border supply chains.
High Retrofit and Installation Costs in Legacy Facilities Limit Market Penetration
Buildings constructed before 1990 frequently require panel upgrades, conduit installations, and ceiling reinforcements, leading to labor costs of USD 50-150 per fixture. These additional requirements can significantly increase the overall project budget, making upgrades more challenging for businesses operating on tight margins. Heritage restrictions on fixture selections further complicate the process, as they limit the available options and often necessitate custom solutions, which can extend project timelines. Furthermore, small businesses lacking dedicated facility teams often postpone these upgrades, even when the financial returns are appealing, due to the upfront costs, logistical challenges, and the absence of internal expertise to manage such projects effectively.
*Our forecasts treat driver/restraint impacts as directional, not additive. The impact forecasts reflect baseline growth, mix effects, and variable interactions.
North America Commercial LED Lighting Market Segment Analysis
By Application:
Agricultural Facilities Lead GrowthAgricultural and horticulture installations are forecast to grow fastest at a 14.89% CAGR, benefiting from spectrum-tuned fixtures that support vertical farms. This niche already shows 66% LED penetration, yet supplemented greenhouses remain largely untapped. Office installations, although holding 27.43% of 2025 revenue, slow as hybrid work reduces density. Healthcare and retail adopt high-CRI fixtures for patient comfort and merchandising, respectively. Industrial warehouses adopt high-bay LEDs topping 180 lumens per watt, while educational sites prioritize daylight harvesting to satisfy ASHRAE 90.1, reinforcing demand for commercial and industrial LED lighting.
Niche segments such as architectural facades command premium rates for 3D-printed metal optics. Downstream, the North America commercial LED lighting market size for vertical farming is projected to rise rapidly, while offices maintain the largest North America commercial LED lighting market share through 2031.

By Form Factor:
Track Lights Gain on Retail DemandTrack lights are set to post a 14.94% CAGR, propelled by museums and retailers needing beam flexibility and colour fidelity. Troffers, with 23.17% of 2025 revenue, continue large-scale replacements but see limited price upside. High-bay fixtures exceed 100,000 lumens for cold-storage; downlights tighten colour bins to half a MacAdam ellipse for uniform ceilings. Linear strips and suspended systems provide continuous-line aesthetics.
The North America commercial LED lighting market size for track lights will therefore widen, while troffers keep the highest North America commercial LED lighting market share based on installed base.
By Distribution Channel:
Direct Sales Stability Coupled With ESCO MomentumEnergy Service Companies and LaaS providers are set to outpace other routes, reflecting a broader industry shift from capex to opex financing. This transition is driven by the increasing preference for operational flexibility and reduced upfront costs, which align with evolving customer demands and financial strategies.
Direct sales, driven by spec-focused projects, maintain dominance at 42.82%, as they cater to tailored requirements and ensure quality assurance for end-users. Meanwhile, wholesale distributors grapple with margin compression as e-commerce portals increasingly list commodity tubes and retrofit kits, intensifying price competition and reducing profitability. Although currently in the low teens, online channels are witnessing the fastest growth in unit volume, particularly for straightforward installations. This growth is fueled by the convenience, accessibility, and cost-effectiveness offered by online platforms, making them an attractive option for customers seeking simple and quick solutions.
By Installation Type:
Retrofits DominateAs about 1 billion fluorescent fixtures stand ready for replacement, retrofits account for 64.53% of spending in 2025 and maintain a robust 15.04% CAGR. These fixtures predominantly reside in older downtowns, where lighting power densities surpass contemporary standards, creating significant opportunities for energy savings and compliance with updated regulations. Retrofits are particularly appealing due to their cost-effectiveness and the ability to upgrade existing infrastructure without extensive modifications. While demand for new builds is modest, they incorporate advanced controls from the outset, such as smart lighting systems and IoT-enabled solutions, progressively closing performance gaps with retrofits. These advanced systems enhance energy efficiency, enable better monitoring, and support sustainability goals from the beginning of the building's lifecycle.
In the North American commercial LED lighting market, utility rebates and corporate ESG objectives play a pivotal role in driving adoption. Utility rebates reduce upfront costs, making LED solutions more accessible, while corporate ESG targets push businesses to adopt sustainable practices, including energy-efficient lighting. Together, these factors accelerate the adoption of LED lighting in both retrofit and new-build categories, contributing to the market's growth and alignment with environmental and regulatory standards.
Geography Analysis
United States Commercial LED Lighting Market
The United States leads the North America commercial LED lighting market, supported by state codes that effectively mandate LED efficacy levels. Yet tariff surcharges on Chinese components raise cost pressure, while Mexican production enjoys USMCA exemptions. Energy Trust of Oregon and Oncor rebates offset initial costs, sustaining mid-market retrofits.
Canada Commercial LED Lighting Market
Canada follows with stringent provincial codes and performance-based utility incentives that reward sensor integration. Currency weakness trims reported vendor revenues, but joint purchasing by municipalities smooths demand. Vertical farming clusters around Ontario and British Columbia benefit from hydroelectric power pricing.
Mexico Commercial LED Lighting Market
Mexico’s market, while smaller in absolute terms, grows through industrial corridor upgrades and NOM-030-ENER enforcement. Local factories supplying USMCA-compliant fixtures shorten lead times and sidestep U.S. tariffs, deepening cross-border integration. Collectively, these dynamics maintain steady expansion of the North America commercial LED lighting market.
Regulatory Landscape
Energy-efficiency rulemaking continues to narrow the compliant product set for lamps and fixtures used in commercial retrofits across North America, which accelerates conversions away from legacy technologies. In the United States, the Department of Energy (DOE) finalized amended energy conservation standards for general service lamps (GSLs) in 2024, anchored by a 45 lumens per watt minimum efficacy requirement, with compliance required on and after July 25, 2028. DOE also finalized test-procedure updates in January 2025, making updated federal testing mandatory for product testing starting July 15, 2025, which affects qualification workflows for LED lamps and retrofit products sold into regulated channels.
Canada is tightening and harmonizing requirements through Natural Resources Canada (NRCan) updates to the Energy Efficiency Regulations, aligning testing to U.S. DOE methods (10 C.F.R. 430.23(gg)). NRCan requires 45 lumens per watt compliance for general service incandescent and reflector lamps manufactured on or after January 1, 2026, and extends compliance requirements for other general service lamps, including LED, to units manufactured on or after January 1, 2027. Separately, DOE issued a February 2026 final determination that metal halide lamp fixture (MHLF) standards do not need amendment, keeping the existing 2017 framework in place and providing near-term stability for certain high-intensity discharge replacement cycles in commercial facilities.
Competitive Landscape
Signify, Acuity Brands, Hubbell, Cree Lighting, and Osram, the top five suppliers, command a share in the mid-40s, highlighting a moderate market concentration. These companies leverage their established market presence and extensive product portfolios to maintain their competitive edge. The remaining share is divided among regional specialists and emerging challengers, who often focus on niche applications or innovative technologies to differentiate themselves.
Acuity Brands' acquisition of QSC underscores its ambition for unified building platforms, aiming to integrate lighting with broader building management systems for enhanced operational efficiency. Meanwhile, Signify capitalizes on the familiarity of Philips Hue to promote its commercial Interact controls, targeting businesses seeking scalable and user-friendly lighting solutions. New entrants like Digital Lumens, with a focus on industrial applications, are utilizing wireless mesh sensing to gain traction in warehouse settings, offering solutions that enhance energy efficiency and operational insights. While support for open protocols like DALI-2 and Zigbee 3.0 is becoming a key driver in specifications, the presence of fragmented standards continues to escalate commissioning costs, posing challenges for seamless integration and adoption.
In North America, the commercial LED lighting market is shifting towards service-oriented revenues, with hardware fixtures serving as gateways to data analytics. This transition reflects the growing demand for smart lighting solutions that provide actionable insights and improve energy management. Vendors that blend robust manufacturing capabilities with comprehensive software ecosystems are poised to safeguard their margins amidst ongoing price pressures. Companies that can offer end-to-end solutions, combining high-quality hardware with advanced analytics and seamless integration, are better positioned to capture market share and address evolving customer needs in this competitive landscape.
North America Commercial LED Lighting Industry Leaders
-
Dialight PLC
-
OSRAM Licht AG
-
Signify Holding (Philips Lighting and Cooper Lighting)
-
US LED Limited
-
Hubbell Inc.
- *Disclaimer: Major Players sorted in no particular order
North America Commercial LED Lighting Market Companies Covered in this Report
- Signify Holding
- Acuity Brands Inc.
- Hubbell Inc.
- Cree Lighting
- Dialight plc
- US LED Ltd.
- Osram Licht AG
- Technical Consumer Products Inc.
- Current Lighting Solutions LLC
- Zumtobel Group
- Lutron Electronics Co. Inc.
- Legrand SA
- Leviton Manufacturing Co. Inc.
- Samsung Electronics America
- LG Innotek USA Inc.
- Nichia America Corp.
- Orion Energy Systems Inc.
- Energy Focus Inc.
- Digital Lumens Inc.
- Fagerhult Group
- Revolution Lighting Technologies
- Cooper Lighting Solutions
- Lumileds Holding BV
Market Opportunities and Future Outlook
A large retrofit pool continues to define whitespace for commercial LED and controls across offices, education, healthcare, warehouses, and exterior areas, with about 1 billion fluorescent fixtures still in service across the region and retrofits representing 64.53% of 2025 spending. Programs and guidance that standardize LED plus controls specification broaden the serviceable market for connected luminaires and commissioning, including U.S. federal procurement practices supported by GSA LED and controls guidance for federal buildings. At the project level, Orion Energy Systems announced a USD 14-15 million LED exterior lighting award from a major international retail chain in January 2026, reinforcing demand for large, multi-site rollouts where vendors can bundle luminaires, controls, and deployment services.
Municipal and infrastructure conversions also expand adjacent opportunity for commercial-grade luminaires, controls, and networked management platforms, particularly for streetlighting and large venues that use similar components and supply chains as commercial outdoor lighting. In April 2026, the City of Toronto and Toronto Hydro announced a CAD 577 million, 10-year plan to convert municipal streetlights to LED with smart controls by 2035, with spending front-loaded into the first four years, supporting sustained demand for connected nodes, interoperability, and maintenance services. Large-facility upgrades further highlight demand for high-output LED systems and controls, such as the Daytona International Speedway project announced in May 2026 to install a comprehensive Musco LED lighting system across the facility (work starting April 2026 and running into early 2027), aligning with the market shift toward performance guarantees and service-led contracts.
Recent Industry Developments in North America Commercial LED Lighting Market
- May 2026: Dialight expanded its ProSite platform series with a streetlight model designed for hazardous and non-hazardous applications. The update strengthens its addressable base across industrial sites and adjacent commercial outdoor use cases where durability and compliance documentation drive specifications.
- January 2026: Signify introduced the Philips Hue Bridge Pro with higher device limits and faster processing aimed at light commercial deployments. The release supports denser connected-lighting installations and reinforces the shift toward software-enabled controls that can be extended from prosumer ecosystems into small commercial sites.
- April 2025: The United States layered a 34% duty on Chinese lighting imports, while Mexico and Canada remained exempt under USMCA. The tariff gap increased incentives to regionalize sourcing and assembly, influencing supplier selection, lead times, and pricing strategies for commercial LED projects.
North America Commercial LED Lighting Market Report Scope and Research Methodology
Market Definition and Coverage
This market covers the value of LED lighting products sold for commercial end users across North America, including new installations and retrofit replacements in buildings such as offices, retail, hospitality, and similar sites.
Scope exclusions: This sizing excludes residential lighting demand and does not count non-LED legacy technologies except where they are part of a direct LED replacement decision.
Segments Covered in This Report
- By Application
- Retail Stores (Showrooms, Malls, Shops)
- Office
- Hospitality (Restaurants, Casinos, Hotels)
- Architectural (Decorative)
- Healthcare Facilities
- Educational Institutions
- Industrial and Warehouse
- Outdoor Commercial (Parking, Facades)
- Agricultural and Horticulture (Vertical Farm)
- By Form Factor
- Troffers
- Downlights
- High-Bay
- Track Lights
- Suspended Pendants
- Panel Lights
- Linear Strips
- Flood and Area Lights
- Other Form Factors
- By Distribution Channel
- Direct Sales
- Retail / Wholesale
- ESCO / Lighting-as-a-Service Providers
- Online / E-Commerce
- By Installation Type
- New Construction
- Retrofit
- By Country
- United States
- Canada
- Mexico
Data Sources, Market Sizing, and Validation
Desk Research
Desk work starts by building a fact base for commercial building activity and lighting demand signals in the US, Canada, and Mexico. We use public sources such as US Energy Information Administration releases, US Department of Energy efficiency programs and rulemaking updates, Statistics Canada construction and building stock tables, Mexico INEGI industry statistics, and US Census Bureau construction spending series.
To convert those signals into a workable model, company filings and investor decks are reviewed for revenue mix cues, channel structure, and pricing commentary. Trade association pages and reputed press are used to confirm product shifts, including retrofit cycles and connected controls adoption. Where it helps validate company scale and footprint, we also rely on paid subscriptions for company financials and intelligence, plus a patent database to track activity in LED packages, drivers, and smart controls. These desk sources are illustrative only, and many other public and paid references were used during data collection, cross-checking, and clarification.
Primary Interviews and Surveys
Primary work is used to confirm how the commercial LED spend splits between retrofit and new build, how pricing is moving by common form factors, and how buyers time upgrades around energy codes and utility rebates. We speak with a mix of manufacturers, distributors, contractors, ESCO type providers, and large facility owners across the US, Canada, and Mexico, then tighten assumptions when multiple respondents describe the same demand pattern.
Distribution of primary research fieldwork respondents
| Company type | Respondent position |
|---|---|
| Top tier: 37% | CXOs: 13% |
| Mid tier: 43% | Functional/Unit leaders: 29% |
| Smaller Players: 20% | Managers: 58% |
Market-Sizing & Forecasting
Sizing is led by a top-down build that reconstructs commercial LED demand from the commercial building base, renovation intensity, and typical lighting points per facility, which is then translated into annual replacement and new installation volumes. Those volumes are priced using a blended ASP logic that reflects the observed shift from lamps toward luminaires and integrated fixtures, and then adjusted for mix changes by channel and installation type.
To keep the totals grounded, selective bottom-up checks are run using sampled supplier revenues by region, distributor channel checks, and a simple volume times ASP approximation for a few high-penetration form factors such as troffers and downlights. Inputs used in the model include commercial floor space additions, retrofit penetration by building type, utility rebate activity and timing, lumens-per-watt and efficacy policy milestones, typical product lifetime and failure rates, and reported price erosion curves for common fixtures.
For forecasting, scenario analysis is applied around three levers that respondents emphasized most, namely retrofit pace, ASP progression, and the speed of adoption for connected lighting with sensors and controls. Where bottom-up signals are missing for smaller private players, gaps are handled by applying conservative revenue density ranges by channel and country, followed by a second pass using interview-based sanity checks.
Data Validation & Update Cycle
Validation is done through stepwise checks that compare model outputs against independent signals such as construction spending direction, public efficiency program activity, and reported replacement cycles in commercial facilities. When a variance looks too wide, we revisit the underlying driver, re-check unit assumptions, and re-contact a few respondents focused on that specific topic before sign-off.
Before publication, the work is reviewed across multiple analyst layers so that country splits, price trajectories, and growth rates stay consistent with the broader lighting and building environment. The report is refreshed annually, and interim updates are triggered when there is a material change such as a policy shift, trade disruption, or a visible change in pricing behavior. Right before delivery, a final pass is completed so clients receive the most current view available.
Mordor Intelligence's North America Commercial Led Lighting Market Size Compared With Other Published Estimates
Published numbers for this market often differ because the boundary between commercial-only lighting and broader LED lighting demand is not treated the same way by every publisher, and because pricing and retrofit pace assumptions vary by building cohort. Differences can also come from which countries are included in North America and whether the year label refers to a base year, an estimate year, or a first forecast year.
Commercial building stock signals and retrofit program activity are the evidence checks that tie Mordor Intelligence's estimate to an addressable commercial spend pool in the US, Canada, and Mexico, before pricing is applied with form factor mix adjustments. The spread you see across sources usually traces back to how they treat connected controls value, how they roll up lamps versus luminaires, and whether currency timing and inflation passthrough are updated recently or left static.
Benchmark comparison
| Source | Market Size | Gaps in Research Methodology |
|---|---|---|
| Mordor Intelligence | USD 8.58 B (2025) | |
| Industry Research Publisher A | USD 8.32 B (2025) | This estimate appears to use a narrower country cut that emphasizes the US and Canada, and it applies a more conservative retrofit and ASP progression path, which can keep near-term value lower. |
| Market Data Distributor B | USD 7.70 B (2024) | The figure is anchored to an earlier base year, which can understate value when price mix is shifting toward integrated luminaires, and it may apply a different commercial boundary that blends industrial or other non-commercial demand. |
Taken together, the table suggests that the main differences are timing and scope, more than the underlying direction of growth. By keeping the demand pool tied to measurable commercial activity signals and then stress-testing the pricing and mix assumptions, the approach gives a practical number that can be reproduced and updated as new policy and building indicators come in.
Key Questions Answered in the Report
What is the projected value of the North America commercial LED lighting market by 2031?
It is forecast to reach USD 19.72 billion by 2031.
How fast is the market expected to grow between 2026 and 2031?
It is set to register a 14.48% CAGR during the 2026-2031 period.
Which application segment is anticipated to expand the quickest through 2031?
Agricultural and horticulture lighting is projected to grow at a 14.89% CAGR.
Which form factor currently generates the largest revenue share?
Troffers held the top share at 23.17% of 2025 revenue.
Why are Lighting-as-a-Service providers gaining traction?
They let building owners shift upgrades from capital to operating expenses, and this channel is forecast to grow at a 15.23% CAGR through 2031.
What drives the dominance of retrofit projects?
About 1 billion fluorescent fixtures still in use create a large replacement pool, pushing retrofits to 64.53% of 2025 spending and a forecast 15.04% CAGR through 2031.