
Market Overview
| Study Period | 2020 - 2031 |
|---|---|
| Forecast Data Period | 2026 - 2031 |
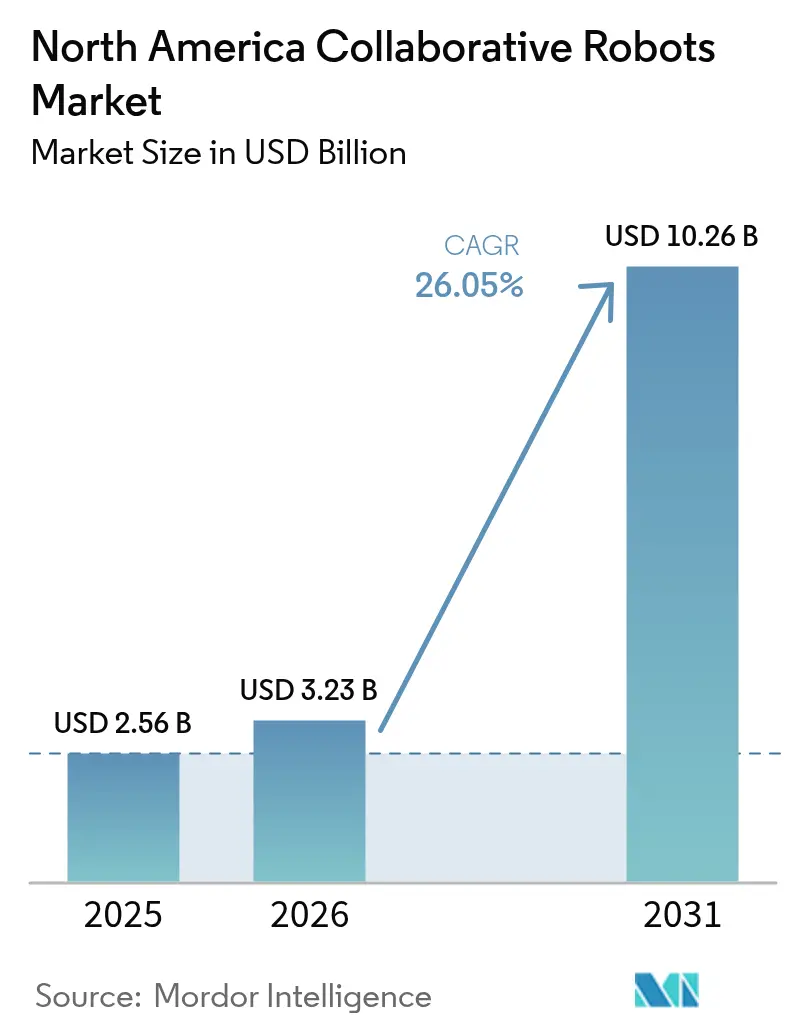
| Base Year Market Size (2025) | USD 2.56 Billion |
| Market Size (2026) | USD 3.23 Billion |
| Market Size (2031) | USD 10.26 Billion |
| Growth Rate (2026 - 2031) | 26.05 % |
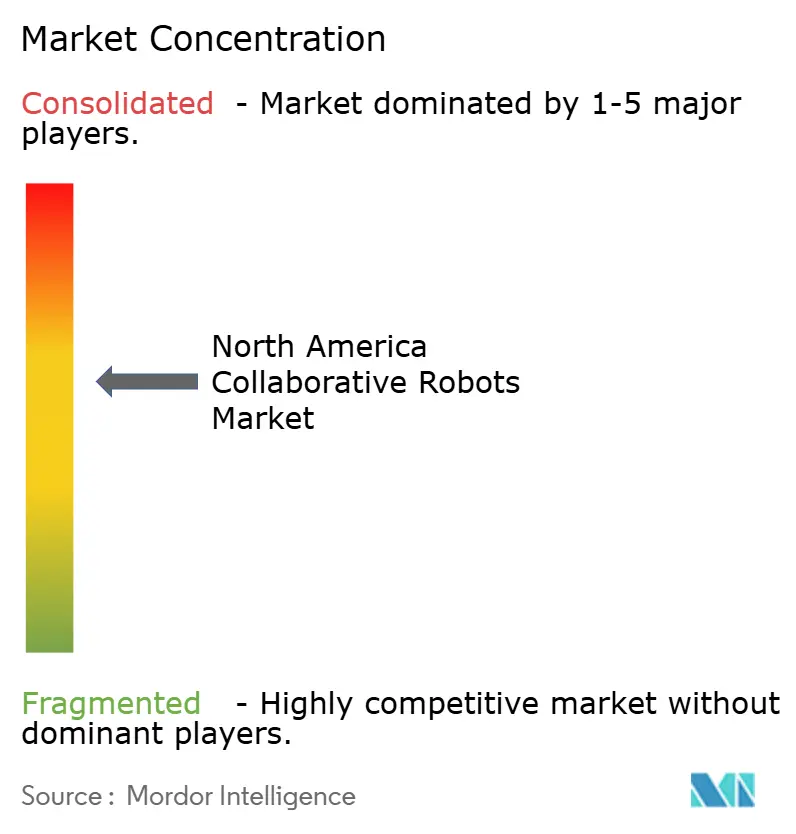
| Market Concentration | Medium |
Major Players *Disclaimer: Major Players sorted in no particular order Image © Mordor Intelligence. Reuse requires attribution under CC BY 4.0. | |
North America Collaborative Robots Market Analysis by Mordor Intelligence
The North America collaborative robots market size is expected to grow from USD 2.56 billion in 2025 to USD 3.23 billion in 2026 and is forecast to reach USD 10.26 billion by 2031 at 26.05% CAGR over 2026-2031. Reshoring incentives, ongoing labor shortages, and simplified human–robot interaction are converging to position the North America collaborative robots market as a structural pillar of regional manufacturing modernization. Federal grants covering up to 40% of qualified automation expenditures compress pay-back periods below 18 months, even for small and midsized enterprises. Tier-one automakers and semiconductor fabs are broadening orders beyond pilot cells, signaling that cobots have moved from experimentation to core capital-equipment budgets. Vendors, meanwhile, are embedding edge-AI controllers that learn tasks in hours rather than weeks, creating a recurring software revenue stream that may exceed hardware sales before decade-end.
Key Report Takeaways
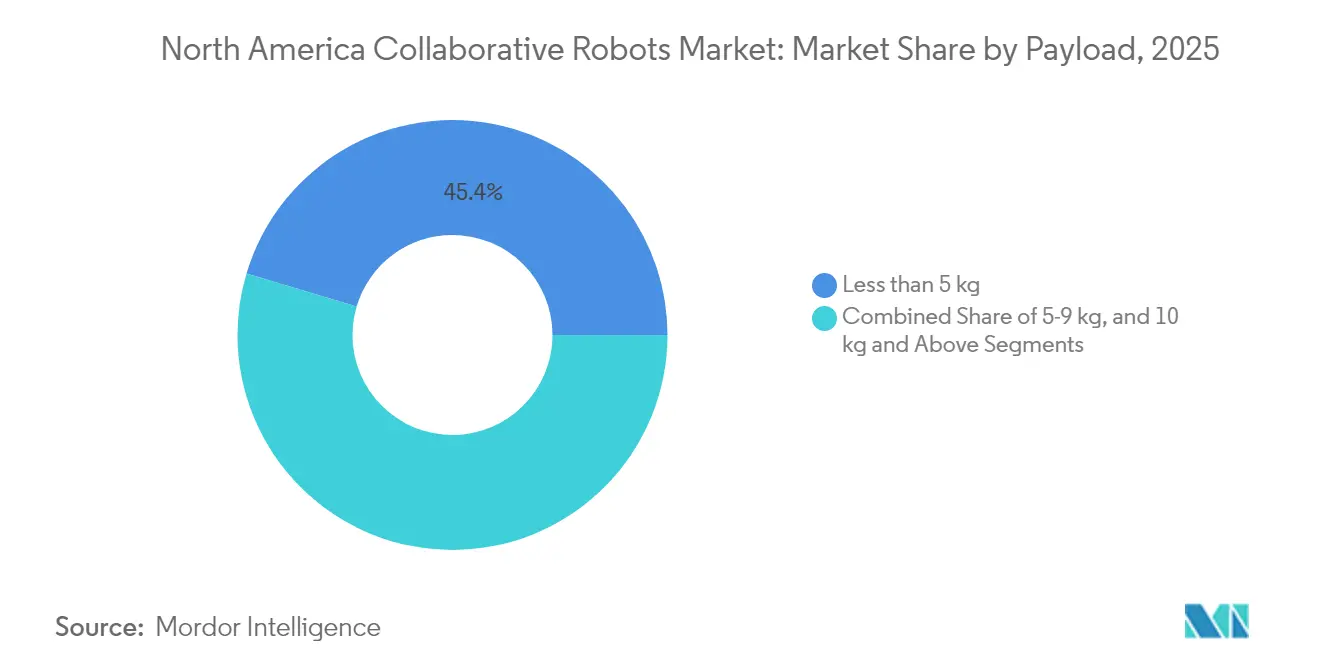
- By payload, units rated below 5 kg captured 45.38% of the North America collaborative robots market share in 2025, while payloads of 10 kg and above are forecast to expand at an 17.65% CAGR through 2031.
- By end-user industry, electronics and semiconductors commanded 36.95% revenue in 2025; food and beverage is set to grow at a 14.88% CAGR to 2031.
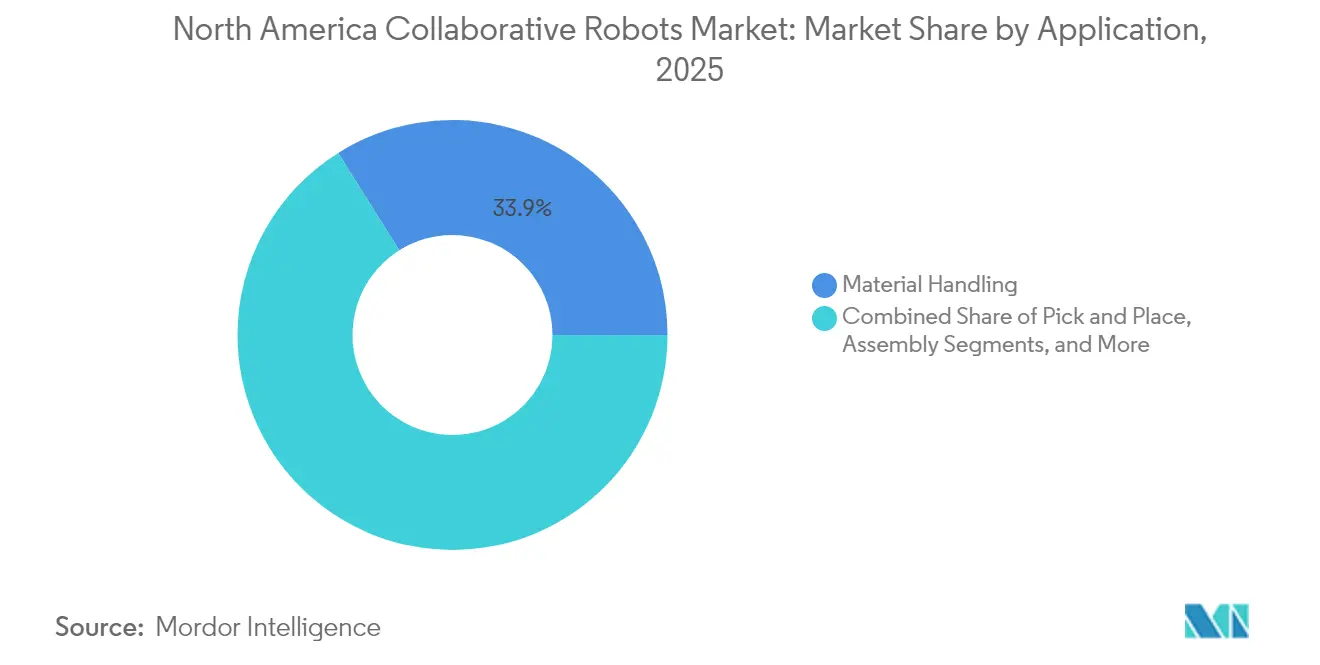
- By application, material handling held 33.92% of the North America collaborative robots market size in 2025, whereas assembly tasks are advancing at a 16.90% CAGR.
- By component, hardware delivered 51.64% of 2025 revenue, yet software is rising at a 18.82% CAGR through 2031.
- By Country, the United States accounted for 78.55% of 2025 revenue, while Mexico is the fastest-growing country at an 17.95% CAGR to 2031.
Note: Market size and forecast figures in this report are generated using Mordor Intelligence’s proprietary estimation framework, updated with the latest available data and insights as of 2026.
North America Collaborative Robots Market Trends and Insights
Drivers Impact Analysis*
| Driver | (~) % Impact on CAGR Forecast | Geographic Relevance | Impact Timeline |
|---|---|---|---|
| Increasing Demand for Automation in Manufacturing Processes | +6.2% | United States, Mexico, Canada | Medium term (2-4 years) |
| High Return on Investment Enabled by Easy Deployment | +4.8% | United States, Canada | Short term (≤ 2 years) |
| Rapid Advances in Edge Computing and AI Integration | +5.1% | United States, with spillover to Mexico | Medium term (2-4 years) |
| Rising Labor Costs and Labor Shortages Across Industries | +5.4% | United States, Canada | Short term (≤ 2 years) |
| Adoption of Collaborative Robots in Precision Agriculture Operations | +2.3% | United States, Canada | Long term (≥ 4 years) |
| Incentive Grants for Reshoring Electronics Assembly Lines | +3.7% | United States, Mexico | Medium term (2-4 years) |
| Source: Mordor Intelligence | |||
Increasing Demand for Automation in Manufacturing Processes
Manufacturers that repatriate lines from Asia must balance throughput and flexibility. Cobots allow quick re-tooling without cages, satisfying this dual mandate. The 2024 House AI Task Force urged USD 500 million per year for human–robot collaboration pilots, accelerating early-stage deployments.[1]House AI Task Force, “Artificial Intelligence in Manufacturing Report,” congress.gov Yaskawa’s 185,000 square-foot U.S. expansion underscores vendor confidence in sustained orders. As a result, the North America collaborative robots market is expanding beyond tier-one plants toward rural contract manufacturers that previously lacked access to robotics expertise.
High Return on Investment Enabled by Easy Deployment
Drag-and-drop design suites and pre-engineered grippers now let job shops integrate a cobot cell in under 48 hours, down from 6-12 weeks. ABB’s GoFa-Vention bundle cut installation labor costs by 60-70% for first-wave adopters. Lower integration overhead unlocks use cases with batch sizes below 100 units, allowing the North America collaborative robots market to penetrate segments once deemed too small for automation.
Rapid Advances in Edge Computing and AI Integration
On-device inference transforms cobots into adaptive co-workers that optimize trajectories in real time. Universal Robots’ MotionPlus software reduced cycle-time variability by 18% during multi-arm assembly trials. National Science Foundation hubs are funding AI-enabled manufacturing test beds, anchoring the North America collaborative robots market in federally backed innovation clusters.
Rising Labor Costs and Labor Shortages Across Industries
Median manufacturing wages rose 4.8% in 2024, intensifying pressure to automate tasks with high injury rates. Toyota’s Kentucky battery-plant layout shows how cobots handle repetitive material moves while technicians manage diagnostics. The North America collaborative robots market therefore functions as a workforce multiplier rather than a direct labor substitute, mitigating union resistance.
Restraints Impact Analysis*
| Restraint | (~) % Impact on CAGR Forecast | Geographic Relevance | Impact Timeline |
|---|---|---|---|
| Limited Payload and Speed Capabilities Versus Traditional Robots | -2.1% | United States, Canada, Mexico | Medium term (2-4 years) |
| High Initial Integration and Training Costs for SMEs | -1.8% | United States, Canada | Short term (≤ 2 years) |
| OSHA Standard Ambiguity Creating Certification Bottlenecks | -1.4% | United States | Short term (≤ 2 years) |
| Cybersecurity Vulnerabilities in Open-Source Robot Operating Systems | -0.9% | United States, with spillover to Canada | Medium term (2-4 years) |
| Source: Mordor Intelligence | |||
Limited Payload and Speed Capabilities Versus Traditional Robots
ISO/TS 15066 force limits cap most cobots at 35 kg payload and 1.5 m/s speed, excluding applications such as body-in-white welding or press tending. Traditional arms still handle 88.4% of automotive installations.[2]International Federation of Robotics, “World Robotics 2024,” ifr.org Hybrid cells that pair fenced heavy-duty robots with cobots increase floor-space needs, diluting some flexibility benefits and slowing penetration of the North America collaborative robots market into legacy press shops.
High Initial Integration and Training Costs for SMEs
End-of-arm tooling, vision systems, and process redesign can top USD 50,000 per cell. A 2024 NIST survey found 62% of small manufacturers still view integration services as the primary barrier. Government extension programs train fewer than 5,000 operators annually, creating a temporary adoption bottleneck that curbs near-term growth of the North America collaborative robots market.
*Our forecasts treat driver/restraint impacts as directional, not additive. The impact forecasts reflect baseline growth, mix effects, and variable interactions.
Segment Analysis
By Payload: Miniaturization Sustains Sub-5 kg Dominance
Less-than-5 kg cobots captured 45.38% of the North America collaborative robots market share in 2025, propelled by cleanroom electronics assembly that values compact footprints and gentle force limits. Standard Bots’ 30 kg model, released in 2025, signals supplier intent to penetrate heavier-duty palletizing, pointing to segment blurring. Over time, vendors will package modular arms allowing end users to swap joints and extend reach, reinforcing the scalability narrative that fuels the North America collaborative robots market.
Demand for 10 kg-plus units, forecast to grow at an 17.65% CAGR, stems from food palletizing and machine tending where ergonomic risk drives automation budgets. KUKA’s mosaixx remote-monitoring stack lowers service visits, cutting total cost of ownership and attracting multi-site processors. As high-payload designs mature, the North America collaborative robots market size for heavy-duty units could exceed USD 1.12 billion by 2031.


By End-User Industry: Food and Beverage Takes the Growth Lead
Electronics retained 36.95% revenue in 2025 owing to wafer handling and die bonding tasks that demand particle-free operation. Nonetheless, food and beverage posts a 14.88% CAGR to 2031, reshaping the North America collaborative robots market as processors confront hygiene mandates and 50% annual turnover on packaging lines.
Logistics, pharmaceuticals, and aerospace form an emerging cohort, collectively advancing as fulfillment centers deploy cobots for order picking. Compliance with ISO 22000 food-safety rules and FSMA preventive controls accelerates uptake, ensuring the North America collaborative robots market diversifies across verticals.
By Application: Assembly Narrows the Gap With Material Handling
Material handling held 33.92% of 2025 revenue, reflecting early wins in palletizing and machine tending. Assembly is set to grow at 16.90% CAGR, buoyed by inverse-kinematics optimizers that cut cycle time 12%, making cobots viable for fast takt operations. Sensor-rich end effectors let cobots seat press-fits or apply torque within ±3%, once exclusive to precision gantries.
As vendors ship task-specific software bundles, buyers increasingly pay for guaranteed takt-time outcomes, shifting value capture from hardware to recurring licenses and enlarging the North America collaborative robots market size allocated to digital add-ons.
By Component: Software Monetization Redraws Revenue Mix
Hardware made up 51.64% of 2025 sales, but software is rising at 18.82% CAGR on the back of cloud dashboards and predictive-maintenance algorithms. ABB’s subscription tier for welding cobots spreads costs over the asset life, a model now echoed by KUKA’s mosaixx and Yaskawa’s forthcoming AI-optimizer module.
Services revenue, traditionally one-off, is migrating to multi-year support contracts. As margins on metal sell-offs thin, vendors rely on analytics to retain differentiation, reinforcing software’s share of the North America collaborative robots market.
Geography Analysis
The United States controlled 78.55% of the North America collaborative robots market in 2025, underpinned by semiconductor fabs in Arizona and automotive clusters in the Midwest. Senate appropriations for 2025-26 allocate USD 1.5 billion to cobot integration grants, sustaining demand during macro softness. Yaskawa’s USD 180 million Wisconsin expansion doubles domestic capacity and reduces lead times, bolstering supply resilience.
Mexico, expanding at an 17.95% CAGR through 2031, benefits from nearshoring of electronics and vehicle parts. Government incentives target high-value assembly lines, and cobots bridge labor gaps without proportional headcount. Vendors are responding by setting up parts depots in Monterrey and Queretaro, signaling long-term commitment to the North America collaborative robots market south of the border.
Canada remains smaller but steady, led by Ontario and Quebec food processors that leverage provincial automation grants. Clear adoption of ISO/TS 15066 by workplace-safety regulators shortens certification cycles, making Canada a test bed for hygienic stainless-steel cobot designs. Although its manufacturing base is modest, Canada’s focus on aerospace subassembly and cold-chain food packaging provides high-margin niches within the broader North America collaborative robots market.
Regulatory Landscape
Collaborative robot deployments in North America continue to be shaped primarily by consensus safety standards and workplace enforcement expectations rather than a single cobot-specific federal rule. In the United States, OSHA guidance for industrial robot systems frames employer responsibilities around hazard assessment, safeguarding, and safe work practices, while ANSI/RIA standards define the prevailing technical baseline used by integrators and end users in risk documentation.
A major standards update is the ANSI/A3 R15.06-2025 release (Oct 2025), which replaces ANSI/RIA R15.06-2012 and aligns more directly with ISO 10218-1/2:2025. The update shifts emphasis from certifying a "collaborative robot" product toward validating a "collaborative application" through risk assessment and documented limits. On the policy side, proposed federal legislation in 2026 (H.R. 7334 and the companion Senate bill S. 4686) to establish a National Commission on Robotics points to rising government focus on competitiveness, workforce incentives, and supply chain risks for robotics and automation buyers and suppliers.
Value Chain Analysis
The value chain runs from component suppliers, including servo drives, motors, encoders, safety-rated controllers, machine vision, force-torque sensors, and precision mechanical elements such as harmonic drives and RV reducers, to cobot OEMs. A wide integration layer then configures end-of-arm tooling, guarding and safety functions, and application software.
Distribution combines direct OEM sales to large manufacturers with ecosystem-led channels that package pre-engineered workcells for SMEs, along with training, commissioning, and lifecycle services such as maintenance, spares, and software updates. In 2026, scaling constraints have been most visible in mechanically precise components, with industry reporting pointing to long lead times for actuators and reducers as suppliers run near capacity. This increases the importance of alternative sourcing, design-for-availability, and contract manufacturing, and partnerships that pull manufacturing and subassembly closer to end markets. Examples include Flex expanding its manufacturing partnership with Teradyne Robotics (Universal Robots and Mobile Industrial Robots brands) in April 2026 to support intelligent automation scale, and Kawasaki Robotics expanding collaboration with Dexterity in June 2026 to advance Physical AI logistics systems built around Kawasaki arm platforms.
Competitive Landscape
Market concentration is moderate. ABB, Universal Robots, and FANUC together held roughly 45% of 2024 unit shipments, with remaining share divided among KUKA, Yaskawa, Doosan, and emerging domestic players. Competition pivots on payload envelopes, AI-driven path planning, and ecosystem reach. Universal Robots’ NVIDIA-powered accelerator slashed integration time by 30%, while FANUC’s IEC 62443-certified controller addresses cybersecurity mandates in pharma and defense.
Standard Bots targets Buy-America opportunities with its 30 kg model manufactured in New York. KUKA’s dedicated digital division reflects the strategic pivot toward recurring revenue as hardware commoditizes. Intellectual-property portfolios in force-torque sensing raise entry barriers, yet ROS2 middleware lowers development cost for start-ups, fostering healthy churn and sustaining innovation across the North America collaborative robots industry.
Strategic plays increasingly revolve around platform monetization. ABB’s partnership with Vention enables plug-and-play cells for job shops, while KUKA’s mosaixx allows over-the-air updates, mirroring cloud trends in industrial IoT. With vendors racing to lock in developer communities, ecosystem orchestration rather than arm kinematics is emerging as the decisive battleground in the North America collaborative robots market.
North America Collaborative Robots Industry Leaders
ABB Ltd.
Universal Robots A/S
FANUC Corporation
Techman Robot Inc.
AUBO (Beijing) Robotics Technology Co., Ltd.
- *Disclaimer: Major Players sorted in no particular order

Market Opportunities and Future Outlook
Localization of robotics manufacturing and operations hubs across the United States is creating whitespace for regional suppliers, integrators, and training partners as vendors build closer-to-customer capacity and support infrastructure. In 2026, FANUC America announced a USD 90 million investment for an 840,000 sq. ft. Michigan facility to expand robot manufacturing capacity, and Universal Robots (Teradyne Robotics) advanced plans for a U.S. Operations Hub in Wixom, Michigan that combines manufacturing, service, and training functions. Together, these moves support shorter lead times and closer application engineering engagement with automotive, electronics, and general industrial buyers.
Opportunity is also shifting toward standardized, rapid-deployment solutions and software-heavy workcells, where buyers prioritize time-to-commission and repeatability across multiple sites. FANUC America highlighted pre-engineered CRX-based systems for rapid deployment at Automate 2026, and ABB broadened its cobot portfolio with the PoWa family on OmniCore. As standards move toward application-centric compliance (ANSI/A3 R15.06-2025), demand rises for integrators and OEM ecosystems that can deliver documented collaborative application risk assessments, validated safety functions, and ongoing cybersecurity-aligned controller and software maintenance.
Recent Industry Developments
- July 2026: ABB Robotics introduced the Flexley Stack F712 autonomous forklift using vSLAM navigation as part of its mobile robot portfolio. The launch strengthens interoperability narratives between intralogistics AMRs and robot arms, supporting integrated material movement workflows that complement cobot-based workcells.
- December 2025: Universal Robots announced plans to open a new U.S. Operations Hub in Wixom, Metro Detroit, Michigan, combining manufacturing, service, and training for North American operations. The hub adds regional capacity and customer-proximity support that can shorten deployment cycles and expand application engineering coverage.
- November 2024: KUKA rolled out its mosaixx cloud platform for fleet monitoring and predictive maintenance. The platform deepens the software and connectivity layer around deployed cobots, supporting recurring service models and multi-site visibility for end users.


Research Methodology Framework and Report Scope
Market Definition and Coverage
We size the North America collaborative robots market as the revenue earned from cobot systems and the directly attached software and services sold for industrial and commercial use across the United States, Canada, and Mexico.
Scope exclusions: We exclude traditional industrial robots that are not designed for safe human-robot collaboration, along with general factory IT tools that are not sold as part of a cobot solution.
Segmentation Overview
- By Payload
- Less than 5 kg
- 5-9 kg
- 10 kg and Above
- By End-user Industry
- Electronics/Semiconductor and FPD
- Automotive
- Food and Beverage
- Other End-user Industries
- By Application
- Material Handling
- Pick and Place
- Assembly
- Other Applications (Palletizing/De-palletizing, Welding, Painting, Sorting, Positioning, etc.)
- By Component
- Hardware
- Software
- Services
- By Country
- United States
- Canada
- Mexico
Data Sources, Market Sizing, and Validation
Desk Research
Desk work started with mapping what gets shipped, installed, and regulated for collaborative robots, then tying those signals to spending in North American manufacturing. Public sources such as the International Federation of Robotics (IFR), the US Census Bureau (including manufacturing and trade series), Statistics Canada, and Mexico INEGI were used to ground factory output trends and automation intensity.
We also referenced sources such as USITC trade statistics for robotics-related import patterns, OSHA and standards bodies for safety cues that influence adoption, and peer-reviewed robotics journals for application maturity and performance benchmarks. Company filings, investor decks, and reputable press were used to track mix shifts like higher payload systems, software attach, and service penetration. In a few places, paid subscriptions for company financials, patent databases, and import-export shipment-level views were used to sanity-check supplier exposure and product activity. The sources listed here are illustrative, and many additional public documents and databases were reviewed for cross-checking and clarification.
Primary Interviews and Surveys
Primary work focused on validating what portion of robot spending is truly collaborative, and what gets counted as hardware versus software and services at the point of sale. We spoke with a mix of manufacturers, system integrators, distributors, and end users across the United States, Canada, and Mexico so assumptions on pricing, utilization, and retrofit cycles could be checked against real purchase behavior. Where desk inputs looked inconsistent, follow-up discussions were used to confirm whether the difference came from application mix (for example, machine tending versus assembly) or from timing of large multi-site rollouts.
Distribution of primary research fieldwork respondents
| Company type | Respondent position |
|---|---|
| Top tier: 29% | CXOs: 13% |
| Mid tier: 57% | Functional/Unit leaders: 43% |
| Smaller Players: 14% | Managers: 44% |
Market-Sizing & Forecasting
Our model starts from a top-down reconstruction of demand, where factory automation spend, robot adoption intensity, and collaborative robot penetration by key industries are used to build a realistic demand pool for North America. That output is then tested using selective bottom-up approximations, including sampled average selling price (ASP) bands by payload class, integration-to-hardware ratios, and channel checks on typical order sizes, which are then used to adjust totals when the implied volumes look off.
Inputs that matter in this market include payload mix shifts (less than 5 kg versus higher payload), the split of applications like material handling, pick and place, and assembly, and the share of deployments going into electronics, automotive, and food processing lines. We also track indicators such as manufacturing output trends, new capacity additions in high automation sectors, and the pace of safety-driven retrofits that make cobot adoption easier in existing plants. For forecasting, scenario analysis is used around capex cycles and adoption pace, and the scenarios are tied back to expert views on lead times, ASP progression, and software and services attach rates. If a bottom-up signal is incomplete for a country or application, we fill the gap using conservative proxy ratios from similar end-user profiles, then recheck the assumption in interviews.
Data Validation & Update Cycle
Outputs are validated through triangulation across multiple checkpoints, so the implied revenues align with adoption signals, pricing bands, and the pace of new installations. Variance checks are run at the country level and then reviewed again at the application and end-user level to catch outliers, followed by a second analyst review before sign-off.
The model is also compared against independent signals such as manufacturing activity, trade movements for robot-related categories, and publicly visible investment cycles in automation-heavy industries. Reports refresh on an annual cycle, and interim updates are triggered when material events shift pricing, supply, or demand expectations. Before delivery, we do a final pass to incorporate the latest public releases and any fresh primary feedback so clients receive an up-to-date view.
Mordor Intelligence's North America Collaborative Robots Market Size Versus Other Published Estimates
Published numbers for North America cobots do not always match, and the spread usually comes from what is counted as cobot revenue and how the geography is handled. Differences in whether software and services are included, and whether shipments are converted into revenue using realistic ASP bands, also move the final value.
The biggest gap drivers we saw were scope choices (cobot systems only versus all industrial robots), component coverage (hardware only versus hardware plus software and services), and the timing of currency and inflation assumptions when values are converted into USD. Some estimates also lean on a single base case without checking whether implied units align with factory automation signals, which can inflate fast-growth years. A narrower, component-specific revenue build that stays tied to North American deployments, and is refreshed with recent pricing and attach-rate checks, explains the differences seen here, a modeling choice applied by Mordor Intelligence.
Benchmark comparison
| Source | Market Size | Gaps in Research Methodology |
|---|---|---|
| Mordor Intelligence | USD 2.56 B (2025) | |
| Industry Association A | USD 2.10 B (2025) | Often counts mainly robot hardware revenue and uses conservative integration and software attach assumptions, which can understate total spend tied to cobot deployments. |
| Global Consultancy B | USD 3.05 B (2025) | May include adjacent light industrial robot cells or broader automation bundles, and then applies higher blended ASP progression without consistent checks against application-level adoption signals. |
Taken together, the table suggests the lower figure is typically linked to hardware-only counting, while the higher figure is commonly linked to wider robot scope or more aggressive pricing lift. Our approach keeps the market total traceable to clear variables such as payload mix, application demand, and component attach, so the final number can be repeated and stress-tested when new data comes in.


Key Questions Answered in the Report
How fast is collaborative-robot adoption growing in North America?
The North America collaborative robots market is expanding at a 26.05% CAGR between 2026 and 2031, supported by reshoring incentives and labor shortages.
Which payload class leads current cobot demand?
Arms rated below 5 kg hold 45.38% market share, favored in electronics and light assembly lines.
What segment will be the biggest revenue driver by 2031?
Software subscriptions, growing at a 18.82% CAGR, are expected to overtake hardware as the primary revenue source.
Why are food processors investing heavily in cobots?
High labor turnover and strict hygiene rules push food-and-beverage producers to automate packaging and palletizing tasks at a 14.88% CAGR.
Which country is the fastest-growing market in the region?
Mexico leads with an 17.95% CAGR, fueled by nearshored electronics and automotive production.
How are vendors differentiating their products?
Suppliers embed edge-AI controllers, cloud dashboards, and cybersecurity certifications to cut integration time and meet compliance demands.
Page last updated on:


 Your data is secure and never sold or shared.


