
Market Overview
| Study Period | 2021 - 2031 |
|---|---|
| Forecast Data Period | 2026 - 2031 |
| Base Year Market Size (2025) | USD 8.91 Billion |
| Market Size (2026) | USD 9.43 Billion |
| Market Size (2031) | USD 12.53 Billion |
| Growth Rate (2026 - 2031) | 5.85 % |
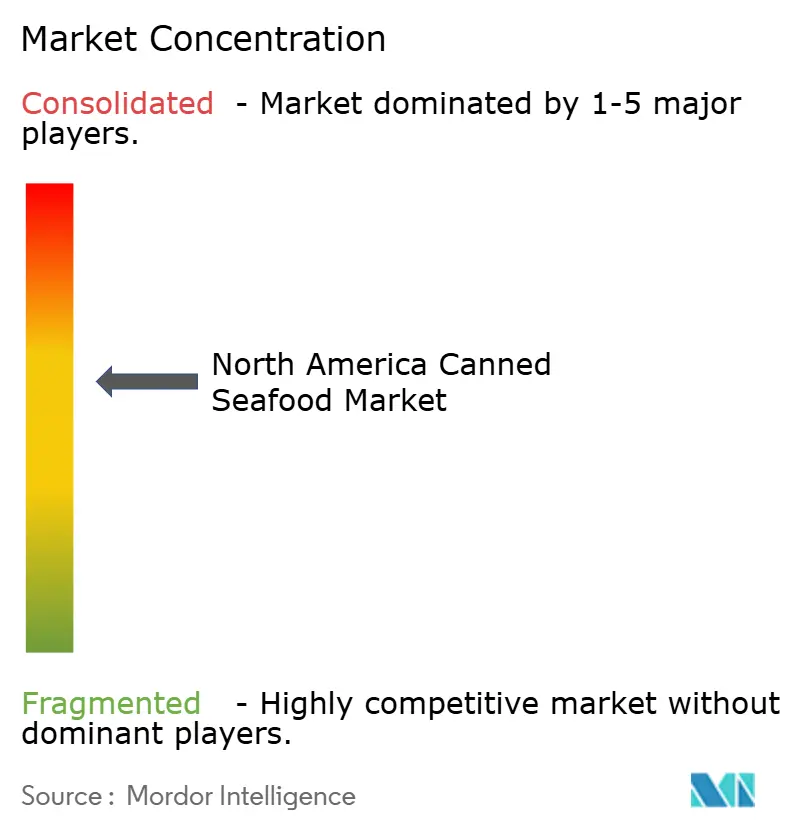
| Market Concentration | Medium |
Major Players *Disclaimer: Major Players sorted in no particular order Image © Mordor Intelligence. Reuse requires attribution under CC BY 4.0. | |
North America Canned Seafood Market Analysis by Mordor Intelligence
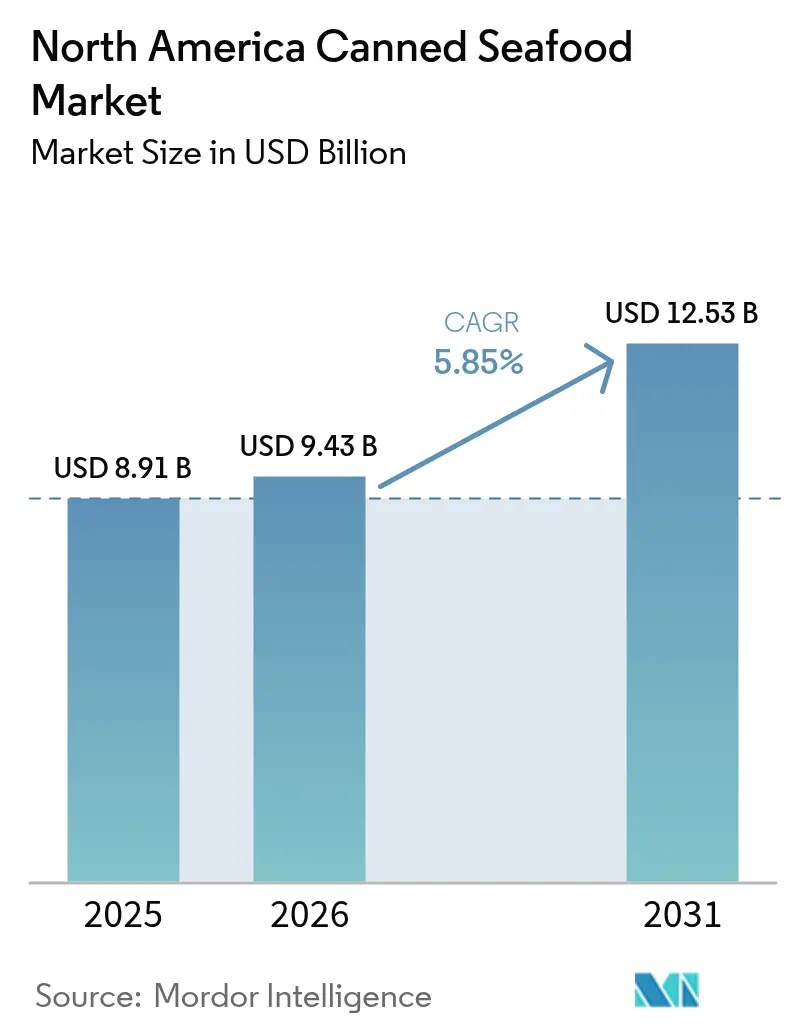
North America canned seafood market size in 2026 is estimated at USD 9.43 billion, growing from 2025 value of USD 8.91 billion with 2031 projections showing USD 12.53 billion, growing at 5.85% CAGR over 2026-2031. This growth trajectory is primarily driven by the increasing consumer preference for shelf-stable protein options, the implementation of new regulatory requirements concerning food-contact chemicals, and the expanding prevalence of urban lifestyles. Sustainability certifications have emerged as a significant factor, enabling companies to command premium pricing. Additionally, the FDA's 2025 decision on PFAS has accelerated deadlines for packaging innovations, compelling canneries to adjust their capital allocation strategies accordingly. While digital commerce is gaining traction, traditional brick-and-mortar retail channels continue to dominate the market due to entrenched consumer shopping habits, particularly for center-store product categories. The competitive landscape is characterized by moderate intensity. Multinational corporations maintain an edge through scale advantages; however, they face increasing margin pressures caused by raw material price volatility and rising compliance costs. These challenges are prompting companies to optimize their operations through rightsizing initiatives and strategic portfolio rationalization.
Key Report Takeaways
- By species, canned fish led with 68.20% revenue share in 2025; canned shrimp is forecast to expand at a 6.62% CAGR to 2031.
- By packaging material, steel cans held 62.80% of the 2025 North American canned seafood market share, while retort pouches are advancing at a 7.05% CAGR through 2031.
- By product form, chunks/pieces captured a 57.60% share of the North American canned seafood market size in 2025, and whole fish formats are projected to grow at an 8.15% CAGR to 2031.
- By distribution channel, the off-trade segment accounted for 62.70% of the North American canned seafood market size in 2025; on-trade is progressing at a 6.65% CAGR between 2026 and 2031.
- By geography, the United States dominated with 78.10% of North American canned seafood market share in 2025, whereas Mexico recorded the fastest CAGR at 7.25% through 2031.
Note: Market size and forecast figures in this report are generated using Mordor Intelligence’s proprietary estimation framework, updated with the latest available data and insights as of 2026.
Market Trends and Insights
Drivers Impact Analysis of North America Canned Seafood Market*
| Driver | (~) % Impact on CAGR Forecast | Geographic Relevance | Impact Timeline |
|---|---|---|---|
| Enhanced convenience features and preservation benefits | +1.2% | North America | Medium term (2-4 years) |
| Increasing urban population and modern lifestyle changes driving market growth | +0.9% | North America core, spillover to urban Mexico | Long term (≥ 4 years) |
| Growing demand for premium portable seafood snacks | +0.8% | United States and Canada | Short term (≤ 2 years) |
| Expanding consumer preference for protein-rich seafood convenience foods in the united states | +0.7% | United States | Medium term (2-4 years) |
| Room temperature storage advantages in regions with underdeveloped cold chain networks | +0.5% | Mexico and Rest of North America | Long term (≥ 4 years) |
| Sustainability certifications and product origin transparency influencing consumer purchasing behavior | +0.4% | North America | Medium term (2-4 years) |
| Source: Mordor Intelligence | |||
Enhanced Convenience Features and Preservation Benefits
Market expansion is being significantly influenced by the increasing consumer demand for ready-to-eat protein sources that require minimal preparation. The Food Industry Association's Power of Seafood 2024 report indicates that 59% of seafood consumption now occurs at home, compared to 41% at restaurants[1]. This shift highlights a growing preference for cost-effective meal solutions, driven by inflationary pressures and changing consumer behavior. Technological advancements in preservation methods have further supported this trend by enabling seafood to maintain an extended shelf life without refrigeration. These innovations have addressed critical supply chain vulnerabilities that were exposed during recent disruptions, ensuring greater product availability and reliability. Manufacturers are strategically utilizing these advancements to diversify their market reach, targeting not only traditional meal occasions but also emerging segments such as emergency preparedness and outdoor recreation. In densely populated urban markets, where time constraints heavily influence purchasing decisions, the demand for shelf-stable protein alternatives has become increasingly prominent, further driving market growth.
Increasing Urban Population and Modern Lifestyle Changes Driving Market Growth
The urbanization trend in North America continues to grow, concentrating purchasing power within densely populated trade areas. In these urban settings, smaller household sizes often result in limited freezer space, influencing consumer purchasing behavior. Additionally, the prevalence of dual-income families and extended commuting hours has significantly reduced the time available for meal preparation, driving a stronger preference for convenient protein options. To address concerns about food waste and align with sustainability objectives, manufacturers are increasingly offering packaging designed for single or two-person servings. Among young professionals, canned seafood has gained popularity as a convenient and nutritious choice for lunchboxes and post-work snacks, reflecting a growing connection between health and convenience. Urban-focused retailers are responding to these shifts by enhancing in-store merchandising strategies, including the use of recipe cards and cross-aisle promotions that feature complementary products such as pasta, rice, and salad kits. These evolving consumer preferences and retail strategies provide a strong and sustainable foundation for the North American canned seafood market.
Growing Demand for Premium Portable Seafood Snacks
Following the pandemic, there has been a significant shift in consumer behavior, with Americans increasingly prioritizing health and wellness. According to the Norwegian Seafood Council's 2024 trends report, 70% of Americans now identify as more health-conscious. In response to this growing demand, brands are innovating by offering artisanal flavors and sustainably sourced tuna belly packaged in convenient single-serve pull-tab tins specifically designed to complement charcuterie boards. Additionally, online specialty stores and subscription boxes have simplified access to exclusive, limited-edition product varieties, catering to niche consumer preferences. This strategic premium positioning not only enhances average selling prices but also mitigates the impact of fluctuations in commodity costs. Furthermore, Millennials and Gen Z consumers are particularly drawn to narratives centered around ethical harvesting practices, which strengthen brand loyalty and drive social media-driven word-of-mouth marketing. These factors collectively contribute to the expansion of the North American canned seafood market.
Expanding Consumer Preference for Protein-rich Seafood Convenience Foods in the United States
Canned tuna continues to rank among the top three most consumed seafood products in the United States, reflecting a strong consumer preference for convenient, shelf-stable protein options. Product labels now emphasize key nutritional benefits, such as omega-3 fatty acid content, high lean protein levels, and minimal processing, positioning canned tuna as a healthier alternative to many snack bars. The fitness community has increasingly adopted tuna pouches as a go-to post-workout snack, driving their availability in sporting goods retail outlets. Additionally, the growing popularity of flexitarian diets, which prioritize seafood over red meat, has contributed to consistent household purchases of canned tuna. To further strengthen their nutritional claims, manufacturers are actively collaborating with registered dietitians to validate and communicate these benefits effectively at the point of sale. These combined factors are significantly contributing to the expansion of the canned seafood market across North America.
Restraints Impact Analysis of North America Canned Seafood Market*
| Restraint | (~) % Impact on CAGR Forecast | Geographic Relevance | Impact Timeline |
|---|---|---|---|
| Raw material price volatility affects market growth | -1.1% | North America | Short term (≤ 2 years) |
| Regulatory compliance costs for BPA and PFAS packaging standards | -0.8% | North America | Medium term (2-4 years) |
| Consumer health concerns regarding sodium and preservative content | -0.6% | United States and Canada | Long term (≥ 4 years) |
| Consumer preference for fresh seafood limits market growth | -0.5% | North America | Long term (≥ 4 years) |
| Source: Mordor Intelligence | |||
Raw Material Price Volatility affects Market Growth
Commodity price fluctuations continue to exert significant margin pressure on the seafood industry, driven by factors such as seasonal variations, climate-related disruptions, and geopolitical events that impact global fishing operations. NOAA Fisheries reported that the Alaska seafood industry incurred a substantial loss of USD 1.8 billion in 2023, accompanied by a sharp 50% decline in profitability[2]. This highlights the sector's pronounced vulnerability to price volatility. Additionally, North American processors, particularly those with considerable reliance on imported seafood, face compounded challenges due to currency fluctuations when sourcing from international suppliers. The unpredictability of prices further complicates long-term contract negotiations with retail partners, who prioritize stable and predictable cost structures for private label programs. Beyond raw seafood inputs, the effects of price volatility extend to packaging materials, with fluctuations in aluminum and steel prices significantly influencing overall production costs.
Regulatory Compliance Costs for BPA and PFAS Packaging Standards
In March 2025, the FDA invalidated 35 food-contact notifications associated with PFAS, necessitating immediate and significant adjustments in packaging processes. Concurrently, the European Union's ban on BPA, which takes effect in January 2025, introduces additional challenges for exporters navigating regulatory compliance across multiple regions. Packaging converters are required to invest in pilot production lines, conduct qualification trials, and obtain customer approvals, all within highly constrained timelines. The need to maintain dual inventories of both legacy materials and their replacements further exacerbates working capital requirements. Mid-sized companies are redirecting their research and development budgets toward meeting compliance obligations, which, in turn, delays the introduction of new products to the market. These escalating costs are placing considerable pressure on profitability within the North American canned seafood market.
*Our forecasts treat driver/restraint impacts as directional, not additive. The impact forecasts reflect baseline growth, mix effects, and variable interactions.
North America Canned Seafood Market Segment Analysis
By Species/Type:
Canned Fish Dominance Faces Premium Shrimp ChallengeIn 2025, canned fish accounted for a significant 68.20% share of the North American canned seafood market, driven by the widespread consumer preference for tuna, salmon, and sardine varieties. This substantial share establishes canned fish as the largest single contributor to the market, underscoring the operational efficiencies achieved in procurement and production processes. The market is witnessing a notable shift toward canned shrimp, which is projected to grow at a robust CAGR of 6.62% through 2031. This growth reflects an increasing consumer inclination toward premium products that offer superior texture and a sense of indulgence.
Canned shrimp products are leveraging global flavor combinations and incorporating resealable plastic lids to enhance convenience and cater to snacking occasions. Additionally, a smaller segment focusing on prawns is exploring gourmet positioning by integrating Caribbean and South Asian spice profiles to appeal to niche markets. Manufacturers are also innovating by introducing mixed-species medleys, such as blends of tuna and octopus, to create unique offerings while optimizing the use of existing canning infrastructure. This strategic diversification of species not only opens new revenue streams but also ensures the core offerings of the North America canned seafood market remain unaffected.

By Packaging Material:
Steel Cans Resilience Amid Retort Pouch InnovationIn 2025, steel cans constituted 62.80% of the market volume, supported by an established recycling infrastructure and widespread consumer familiarity. Despite ongoing efforts within the industry to achieve lightweighting objectives, steel cans have retained their characteristic rigidity, making them a preferred choice for packaging. Concurrently, the North American canned seafood market is experiencing a significant shift towards retort pouches, which are anticipated to grow at a compound annual growth rate (CAGR) of 7.05%. Retailers are increasingly adopting these pouches due to their reduced logistics costs, while consumers value their convenience, particularly the easy-open tear notches.
Aluminum cans present a balanced solution by combining high recyclability with effective barrier properties. Companies such as B and G Foods, which has pledged to achieve full recyclability by 2027, are leveraging can-to-can closed-loop recycling narratives to emphasize their commitment to sustainability and circular economy principles. Furthermore, innovative packaging formats, including transparent glass jars designed for premium fillets, are gaining traction. These formats cater to gifting occasions and are also being utilized in pilot programs for reusable packaging solutions. The ongoing evolution in packaging formats is largely driven by regulatory mandates to phase out harmful substances such as PFAS and BPA, prompting increased capital investments across the North American canned seafood sector.
By Product Form:
Chunks/Pieces Convenience Versus Whole Fish Premium AppealChunks and pieces captured a 57.60% share in 2025, aligning with salad kits, pasta toppers, and sandwich styles. his format's suitability for ready-mix solutions appeals to meal preparation audiences, further driving the penetration of private-label offerings. The consistent demand for chunk light tuna multipacks among urban households highlights the growing emphasis on convenience and efficiency in modern lifestyles.
Whole fish formats, riding the wave of authenticity narratives, are set to grow at an 8.15% CAGR through 2031. Transparent packaging, prominently displaying intact sardines or mackerel, boosts perceived quality. Culinary aficionados value visual cues that enhance plating aesthetics. Producers are innovating with portion-controlled whole fish, bones intact for flavor richness, yet tailored for single servings. Flavor-infused broths, like olive oil with chili, amplify gastronomic allure. This premiumization trend is expanding margins for players in North America's canned seafood market.
By Distribution Channel:
Off-Trade Dominance Challenged by Online Retail GrowthOff-trade outlets delivered 62.70% of 2025 revenues, supported by weekly grocery trips and in-store price promotions. Supermarkets and hypermarkets, known for their extensive stock-keeping unit (SKU) variety, strategically utilize end-cap displays to attract consumer attention, particularly during high-demand periods such as Lent and the back-to-school season. Additionally, convenience stores play a significant role in capturing incremental purchases, catering to commuters seeking quick and convenient lunch options.
HoReCa industry players are not only offering unique and convenient flavors but also presenting dishes that patrons may find challenging to replicate at home. With their expertise in cooking techniques and flavor enhancement, restaurants frequently surpass home cooks, particularly in seafood preparation. As a result, the On-Trade sector, projected to grow at a 6.65% CAGR, is witnessing a surge. In online retail, subscription services encourage repeat purchases, and direct-to-consumer startups stand out with unique storytelling and tailored bundles. Supermarkets' e-commerce platforms promote store pickup choices, enhancing the synergy between off-trade and online sales. Yet, despite the digital boom, many consumers still value the tactile experience of inspecting can integrity, underscoring the enduring importance of physical stores in North America's canned seafood landscape.
Geography Analysis
United States Canned Seafood Market
In 2025, the United States holds a commanding 78.10% share of the market, driven by well-established consumption patterns, an expansive retail infrastructure, and high levels of disposable income that encourage the adoption of premium seafood products. The U.S. seafood trade deficit, which reached USD 20.3 billion in 2023, underscores the country's significant reliance on international suppliers. This dependency presents a substantial opportunity for domestic canned seafood processors to capture market share. Retailers leverage the strong consumer trust in long-standing tuna brands, while niche players are gaining traction by introducing MSC-certified albacore product lines that cater to environmentally conscious consumers. Furthermore, government procurement for nutrition assistance programs ensures a consistent baseline demand, contributing to market stability and growth.
Canada Canned Seafood Market
Canada ranks as the second-largest market, benefiting from its geographic proximity to both Atlantic and Pacific harvesting regions and a strong cultural preference for seafood. Urban centers such as Toronto and Vancouver exhibit a notable preference for premium pole-and-line seafood selections, reflecting a shift towards sustainable and high-quality options. In Quebec, retailers address local consumer preferences by offering bilingual packaging that complies with regulatory requirements and resonates with the province's cultural nuances. Additionally, nationwide wellness campaigns emphasizing the health benefits of omega-3 fatty acids have bolstered seafood consumption across various demographic groups, enhancing the overall performance of the North American canned seafood market.
Mexico Canned Seafood Market
Mexico is the fastest-growing market in the region, with a projected CAGR of 7.25% (2026-2031). The rise in middle-class incomes, coupled with the expansion of supermarket chains into tier-two cities, has significantly improved access to canned seafood products. Shelf-stable formats are particularly well-suited to Mexico's warmer climate, where inconsistent electricity supply continues to challenge cold-chain logistics. The integration of canned tuna into traditional dishes such as tacos and salads has further reduced barriers to adoption. Domestic processors are increasingly investing in advanced retort processing lines to meet both domestic demand and export requirements along the North American trade corridor. Additionally, coastal tourism hubs are driving incremental demand through the hospitality sector's sourcing needs. Collectively, these factors are fueling the sustained growth and expansion of the North American canned seafood market.
Regulatory Landscape
In the United States, canned seafood processors operate under the FDA seafood HACCP regulation (21 CFR Part 123), which requires hazard analysis and documented controls for reasonably likely hazards, with importer accountability reinforced through FDA food safety modernization programs for foreign suppliers. For canned fish in hermetically sealed containers, standards and controls also cover product identity and container-related requirements such as those in 21 CFR Part 161 (for certain fish products), alongside thermal processing expectations used for shelf-stable safety management.
In Canada, the Canadian Food Inspection Agency (CFIA) enforces the Safe Food for Canadians Regulations (SFCR, SOR/2018-108), requiring licensing, a Preventive Control Plan (PCP), and traceability for fish and fish products placed on the market or imported. Label compliance remains a key market-access gate, including net quantity declarations for imported prepackaged fish in hermetically sealed containers and alignment with CFIA fish naming conventions used for common name standardization.
Value Chain Analysis
The value chain runs from capture fisheries and aquaculture through primary processing, canning and retorting, packaging conversion (steel and aluminum cans and retort pouches), distribution to retail and foodservice, and finally to consumers. Trade bodies such as the National Fisheries Institute (NFI) and regional processor associations (e.g., Pacific Seafood Processors Association) support industry practices, while large brand owners and importers coordinate multi-origin sourcing to feed tuna, salmon, sardines, and other fish inputs into North American packing operations.
Bottlenecks center on processing capacity and compliance-driven complexity. Domestic cannery infrastructure remains constrained, and labor availability, logistics costs, and cross-border frictions affect throughput and working capital. Recent signals include the opening of Island Creek Oysters tinned seafood cannery in Massachusetts (June 2024) as a niche-capacity addition, alongside the relocation of the final remaining seafood cannery in Maine to Delaware reported in November 2024, reinforcing the uneven geography of value-add. Downstream, retailers and distributors are tightening procurement requirements through responsible-sourcing and traceability programs (e.g., Whole Foods Market Seafood Code of Conduct announced in January 2025 and US Foods traceability requirements for Exclusive Brands), pushing data capture and supplier verification deeper into the chain.
Competitive Landscape
In the North American canned seafood market, a handful of major players dominate, holding a substantial market share. These key players are increasingly prioritizing sustainable seafood production to attract a broader consumer base. Notable players in the market include Dongwon Enterprise Co., Ltd., Thai Union Group PCL, The Jim Pattison Group, Blue Harbor Fish Co., and Crown Prince, Inc., among others.
Mid-tier players are grappling with intensified challenges. These firms are also forming co-packing alliances, enhancing both plant utilization and negotiating leverage. Their innovation efforts are centered on themes like sustainability, digital traceability, and unique flavors.
Many processors are adopting blockchain verification and QR packaging, allowing consumers to access data directly linked to the vessels. Some are even exploring alternative proteins, combining them with kelp or pulses as a strategy to navigate seafood quota restrictions. As large consumer-goods conglomerates set their sights on these portable protein adjacencies, interest in mergers and acquisitions is on the rise. Such strategic moves ensure the North American canned seafood market remains both dynamic and stable, making it an attractive arena for long-term capital investments.
North America Canned Seafood Industry Leaders
-
Dongwon Enterprise Co., Ltd.
-
Thai Union Group PCL
-
The Jim Pattison Group
-
Blue Harbor Fish Co.
-
Crown Prince, Inc.
- *Disclaimer: Major Players sorted in no particular order
North America Canned Seafood Market Companies Covered in this Report
- Dongwon Enterprise Co., Ltd.
- Thai Union Group PCL
- The Jim Pattison Group
- Blue Harbor Fish Co.
- Crown Prince, Inc.
- Goya Foods, Inc.
- Grace foods
- Grupo PINSA
- Grupo Maritimo Industrial SA de CV
- Season Brand LLC
- American Tuna Inc.
- Trident Seafoods Corp.
- Cento Fine Foods
- Pacific Seafood Group
- Performance Food Group (Bar Harbor Foods)
- Cooke Seafood USA Inc
- Clover Leaf Seafoods Corp.
- Lummi Island Wild
- FCF Co., Ltd.
- Wild Planet Foods, Inc
Market Opportunities and Future Outlook
Packaging and compliance-driven renovation creates whitespace for PFAS- and BPA-aligned materials, lightweight formats, and improved recyclability narratives, particularly while steel cans still represent 62.80% of 2025 volume and retort pouches continue to gain share within shelf-stable seafood. Retailer governance is also elevating the commercial value of verified sourcing and chain-of-custody documentation, as shown by Whole Foods Market launching a Seafood Code of Conduct in January 2025 and large distributors formalizing traceability data submission requirements. This can accelerate adoption of digital traceability, verified vessel lists, and third-party sustainability certification claims in canned seafood portfolios.
Processing and cold-chain infrastructure additions support product availability, private label programs, and premium formats that depend on consistent throughput and specs. In 2026, multiple in-scope seafood processors announced capacity actions that strengthen North American supply networks, including BSF committing more than USD 20 million to expand processing at its Jacksonville, Florida headquarters (project start June 1, 2026), Pacific Seafood leasing a plant at the Seward Marine Industrial Center in Alaska to expand cod processing, and Pacific Dream Seafoods beginning construction on a 61,000-square-foot processing and cold storage facility in Burlington, Washington. These moves align with demand for convenient at-home seafood consumption and with the operational need to manage raw-material volatility through better control of processing, inventory, and distribution.
Recent Industry Developments in North America Canned Seafood Market
- May 2026: TriWest Capital Partners acquired Ocean Brands from the Jim Pattison Group, bringing canned seafood labels such as Ocean’s and Gold Seal under new ownership. The transaction signals continued consolidation in North American shelf-stable seafood and can enable portfolio investment in brand repositioning, channel expansion, and supply-chain optimization.
- May 2026: Chicken of the Sea International, owned by Thai Union Group, committed that all branded retail tuna products will achieve Marine Stewardship Council (MSC) certification by the end of 2026. This raises the bar for mainstream tuna sourcing and increases competitive pressure on brands and private label programs to match third-party certification and chain-of-custody readiness.
- July 2024: Island Creek Oysters inaugurated its first tinned seafood cannery in the United States, a 10,000-square-foot facility focused on European-style ready-to-go products. The build-out adds domestic specialty processing capacity and supports premium, story-led offerings that can diversify category growth beyond legacy tuna and salmon staples.
North America Canned Seafood Market Report Scope and Research Methodology
Market Definition and Coverage
This market covers the value of seafood products sold in sealed, shelf-stable packs (mainly cans and similar retort formats) across North America, counted at the point of sale into retail and foodservice channels.
Scope exclusions: Fresh, chilled, and frozen seafood products are excluded, and non-seafood canned proteins are not counted.
Segments Covered in This Report
- By Species/Type
- Canned Fish
- Tuna
- Salmon
- Sardines
- Mackerel
- Other Canned Fish
- Canned Shrimp
- Canned Prawns
- Other Types
- Canned Fish
- By Packaging Material
- Steel Cans
- Aluminum Cans
- Retort Pouches
- Others
- By Product Form
- Whole
- Chunks/Pieces
- By Distribution Channel
- Off-Trade
- Supermarkets/Hypermarkets
- Convenience Stores
- Online Retail
- Specialty Stores
- Other Distribution Channels
- On-Trade (HoReCa)
- Off-Trade
- By Geography
- United States
- Canada
- Mexico
- Rest of North America
Data Sources, Market Sizing, and Validation
Desk Research
Desk work starts with building the demand and supply context for shelf-stable seafood in the United States, Canada, and Mexico. We review public data that anchors volumes and trade direction, and then translate that into a value view using reasonable price and mix assumptions.
Common inputs include official trade and landing statistics and food consumption signals, such as NOAA Fisheries data, Statistics Canada tables, USDA Economic Research Service indicators, and UN Comtrade import export series, supported by FAO fisheries datasets. To make the model practical for real market conditions, we also reference company annual reports and investor presentations, association websites, and reputable press coverage on pricing, packaging changes, and channel shifts. Select paid subscriptions are used only for company financials and intelligence, shipment-level import export visibility, and patent lookups related to packaging and shelf-life improvements. The sources listed here are illustrative only, and many other public documents were also checked for data collection, validation, and clarification.
Primary Interviews and Surveys
Primary work is used to pressure-test what desk research cannot fully settle, especially mix by species, channel margins, and how pricing moves through promotions and pack sizes. We speak with participants across the value chain, including brand owners, co-packers, importers, distributors, and retail category stakeholders, covering the United States, Canada, and Mexico so regional differences in consumption and sourcing are not averaged out too early.
Distribution of primary research fieldwork respondents
| Company type | Respondent position |
|---|---|
| Top tier: 30% | CXOs: 12% |
| Mid tier: 56% | Functional/Unit leaders: 34% |
| Smaller Players: 14% | Managers: 54% |
Market-Sizing & Forecasting
The sizing model begins with a top-down build where production, imports, and exports are used to reconstruct the available canned seafood supply for North America, which is then mapped to apparent consumption by country. Once the demand pool is formed, value is derived by applying realistic price bands and mix splits that reflect species and pack formats sold through retail and foodservice.
To keep totals grounded, the results are then checked with selective bottom-up approximations, such as sampled shelf prices by pack size, channel checks on typical trade margins, and partial supplier revenue roll-ups where disclosures are available. Inputs that meaningfully move the outcome include import reliance by species (for example tuna versus salmon), shifts between cans and retort pouches, private label penetration in grocery, online share within shelf-stable seafood, and observed price inflation versus promotion intensity. For forecasting, we rely on scenario analysis supported by expert views on pricing and supply stability, and then we convert those scenarios into annual values with conservative smoothing so one-off spikes do not overstate the trend. Where bottom-up signals are incomplete, gaps are handled by using ranges for mix and margins, followed by re-checking the final number against independent volume and price indicators.
Data Validation & Update Cycle
Validation is done through multiple checks so the estimate stays consistent with real market signals. We compare model outputs with independent indicators like trade volumes, consumption trends, and shelf pricing patterns, and then investigate outliers such as sudden jumps in price or mix that do not match what interviews indicate.
Before sign-off, the model and assumptions go through step-by-step analyst reviews, and follow-up calls are triggered when variance is too wide across sources or when a material event changes supply, regulations, or channel behavior. Reports are refreshed annually, with interim updates when major developments occur, and a final pre-delivery review is completed so clients receive the latest updated view.
Mordor Intelligence's North America Canned Seafood Market Sizing Compared With Other Published Estimates
Published market values for canned seafood can differ even when they sound like they measure the same thing, because the scope and the year being reported do not always line up. Differences also come from how prices are treated, how channels are counted, and whether figures are updated after changes in inflation, promotions, or trade flows.
Frozen seafood is a common add-on in broader seafood studies, and it sits outside Mordor Intelligence's scope for this report, which keeps the value tied to shelf-stable canned and retort-packed products only. Some published figures also mix retail and foodservice in different ways, apply a single average selling price without pack-size effects, or use older currency timing that does not reflect recent price moves in North America.
Benchmark comparison
| Source | Market Size | Gaps in Research Methodology |
|---|---|---|
| Mordor Intelligence | USD 8.91 B (2025) | |
| Trade Journal A | USD 24.26 B (2024) | Uses a combined frozen and canned seafood definition, which expands the product pool and can also shift the base year and price structure versus a canned-only view. |
| Regional Consultancy B | USD 3.51 B (2023) | Focuses only on canned tuna, so other canned fish and canned shrimp/prawn items are not captured, which naturally reduces the total market value. |
The spread in the table is mainly explained by product-form coverage and category roll-ups, followed by timing and pricing assumptions. By keeping inclusions clear and then validating prices and channel mix with practical checks, the estimate stays traceable to repeatable steps that users can follow and pressure-test.
Key Questions Answered in the Report
What is the current value of the North America canned seafood market?
The North America canned seafood market size stands at USD 9.43 billion in 2026 and is on track to reach USD 12.53 billion by 2031.
Which species segment leads the market?
Canned fish dominates with 68.20% share in 2025, driven mainly by tuna, salmon, and sardines.
Which geography is expanding the quickest?
Mexico is forecast to record a 7.25% CAGR through 2031 thanks to rising incomes and broader supermarket coverage.
Why are retort pouches gaining popularity?
Retort pouches support lighter shipping weights, quick opening, and compliance with PFAS-free mandates, which fuels a 7.05% CAGR outlook.