
Market Overview
| Study Period | 2020 - 2031 |
|---|---|
| Forecast Data Period | 2026 - 2031 |
| Base Year Market Size (2025) | USD 9.02 Billion |
| Market Size (2026) | USD 9.38 Billion |
| Market Size (2031) | USD 11.41 Billion |
| Growth Rate (2026 - 2031) | 3.99 % |
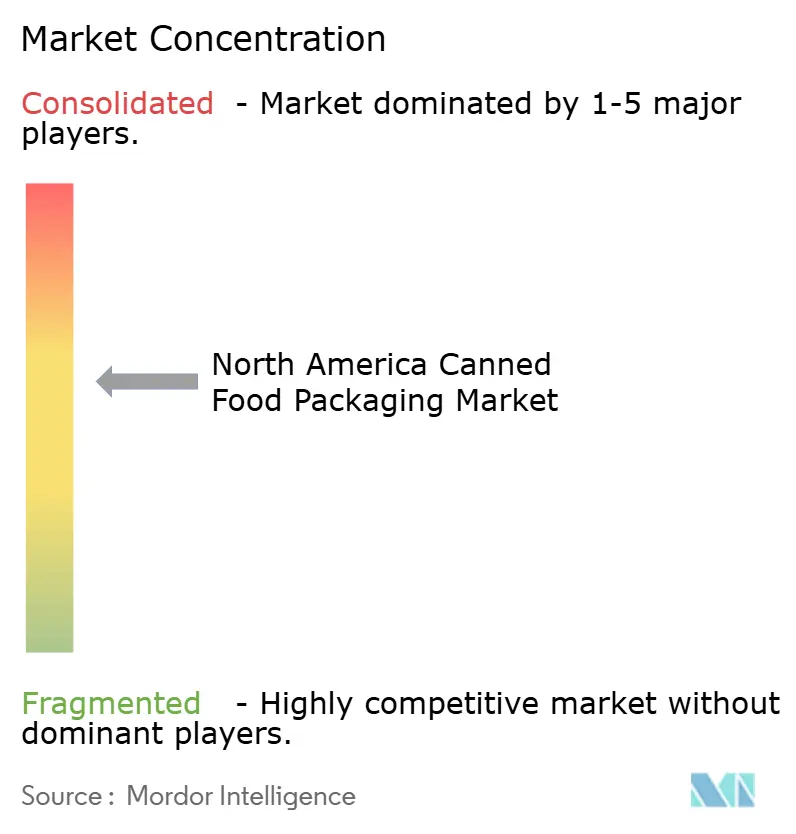
| Market Concentration | Medium |
Major Players *Disclaimer: Major Players sorted in no particular order Image © Mordor Intelligence. Reuse requires attribution under CC BY 4.0. | |
North America Canned Food Packaging Market Analysis by Mordor Intelligence
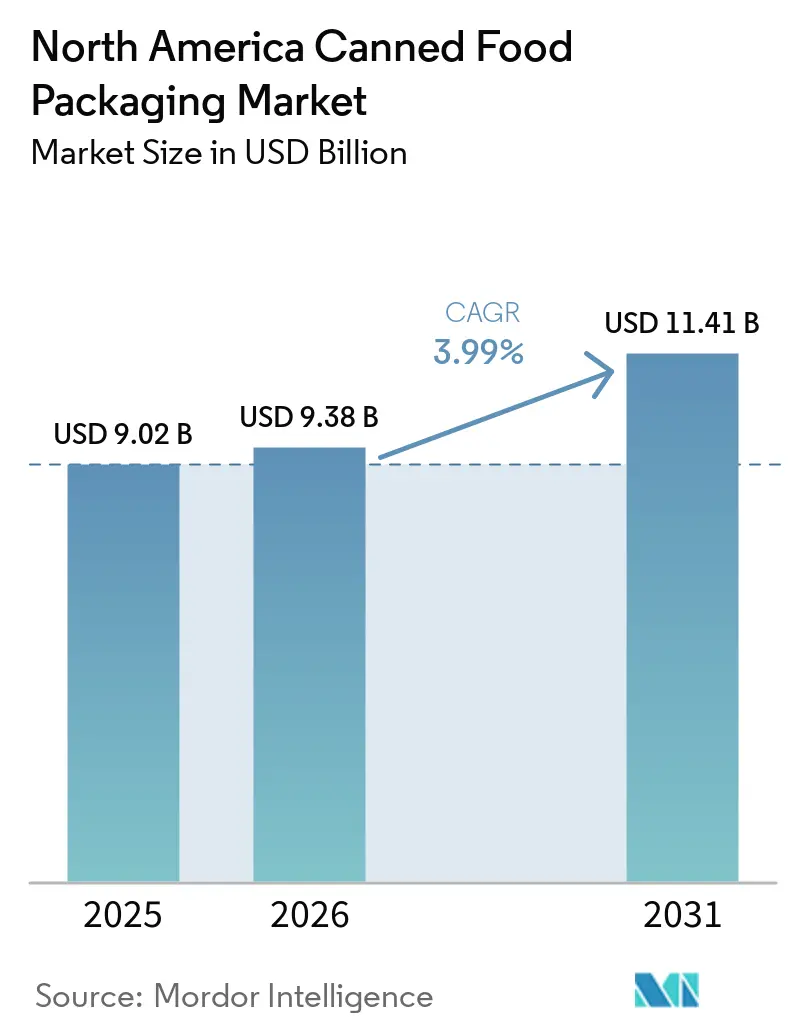
The North America canned food packaging market size in 2026 is estimated at USD 9.38 billion, growing from 2025 value of USD 9.02 billion with 2031 projections showing USD 11.41 billion, growing at 3.99% CAGR over 2026-2031. Aluminum retained leadership supported by closed-loop recycling systems that match government recycling targets and reinforce premium brand positioning.[1] Ready-made meals dominated consumption thanks to remote-work lifestyles and rising single-serve preferences. Structural innovation is another growth catalyst: two-piece draw-and-redraw (DRD) formats are scaling because they trim metal use and integrate easy-open ends that simplify meal prep.
Key Report Takeaways
- By material, aluminum led with 54.12% share of the North America canned food packaging market in 2025; aluminum is projected to grow at a 5.18% CAGR through 2031.
- By application, ready-made meals held 28.61% revenue share in 2025; soups and broths are forecast to advance at a 5.51% CAGR to 2031.
- By can structure, three-piece welded formats accounted for 38.55% share in 2025, while two-piece DRD cans are expanding at a 5.82% CAGR.
- By can capacity, the 201–500 g segment captured 29.42% share of the North America canned food packaging market size in 2025 and is pacing at a 5.66% CAGR.
- By geography, the United States commanded a 72.40% share of the North America canned food packaging market size in 2025; Mexico records the highest projected CAGR at 6.34% through 2031.
Note: Market size and forecast figures in this report are generated using Mordor Intelligence’s proprietary estimation framework, updated with the latest available data and insights as of 2026.
Market Trends and Insights
Drivers Impact Analysis of North America Canned Food Packaging Market*
| Driver | (~) % Impact on CAGR Forecast | Geographic Relevance | Impact Timeline |
|---|---|---|---|
| Rising consumption of convenience and ready-made meals | +1.2% | United States and Canada, with spillover to Mexico urban centers | Medium term (2-4 years) |
| Sustainability push for infinitely-recyclable metal cans | +0.8% | North America-wide, strongest in California, Ontario, British Columbia | Long term (≥ 4 years) |
| Surge in pet-food canning capacity across U.S. and Canada | +0.9% | United States and Canada, concentrated in Midwest and Ontario | Short term (≤ 2 years) |
| Retailer private-label expansion in canned categories | +0.7% | United States and Canada, led by major retail chains | Medium term (2-4 years) |
| On-shoring of metal-can production to avoid Section-232 tariffs | +0.5% | United States, with indirect benefits to Canadian suppliers | Short term (≤ 2 years) |
| OEM demand for QR-coded smart cans enabling traceability | +0.3% | North America-wide, early adoption in premium segments | Long term (≥ 4 years) |
| Source: Mordor Intelligence | |||
Rising Consumption of Convenience and Ready-Made Meals
Ready-made meals already represent 28.95% of the North America canned food packaging market and continue to climb as workers balance hybrid schedules with limited cooking time. Mars is spending USD 2 billion on U.S. production through 2026, a figure that illustrates brand confidence in shelf-stable formats that allow streamlined distribution and year-long inventory cycles. Two-piece DRD lines added by Crown in Iowa and Minnesota shorten seaming steps, yielding sleeker food cans that fit cup-holder-style niches popular in single-serve soups. FDA traceability rules are further motivating adoption of lot-coded ends that simplify recalls and reinforce consumer trust. Taken together, these dynamics keep the North America canned food packaging market firmly aligned with the convenience trend.
Sustainability Push for Infinitely-Recyclable Metal Cans
Aluminum’s infinite recyclability resonates with state mandates in California, Ontario, and British Columbia that require high post-consumer content by 2028. Crown reports that roughly 80% of new beverage product launches now rely on aluminum, a signal that food portfolios will follow the same path as brand owners sync packaging choices with ESG metrics. Electrolit’s USD 400 million Waco plant is designed for non-virgin substrates, illustrating how incoming capacity is future-proofed for circular-economy targets. Because metal can be remelted endlessly with no barrier loss, retailers use its credentials as an on-pack storytelling theme to justify premium shelf pricing. As regulations tighten, the sustainability moat strengthens, locking in long-run growth for the North America canned food packaging market.
Surge in Pet-Food Canning Capacity Across U.S. and Canada
Pet humanization means owners demand microbiological safety equal to infant food, favoring retortable metal that delivers a 24-month shelf life without preservatives. Nestlé Purina is investing USD 220 million in Mexico while ADM opens a USD 39 million wet-food plant in the U.S., collectively adding millions of 3-oz to 13-oz cans per week. Crown’s Dubuque and Owatonna lines specialize in tapered shapes that ease bowl emptying for small-breed diets, proving that format customization captures niche demand. Mid-size 201–500 g containers, already the fastest-growing capacity band, benefit most from these launches. The category’s recession resilience offsets raw-material swings, thereby anchoring near-term volumes in the North America canned food packaging market.
Retailer Private-Label Expansion in Canned Categories
Private labels give grocers a margin hedge as branded inflation persists. Amazon’s Saver entry leverages QR-enabled lids to push recipe videos, elevating engagement while keeping retail prices 10–15% under national offers. Crown notes that 46% of U.S. shoppers now buy private-label products exclusively, pushing converters to flex plant schedules for shorter runs and varied label art. Silgan secures multi-year supply deals that currently cover roughly 90% of the 2024 forecast can volumes, locking in asset utilization above 88% and stabilizing EBITDA despite metal volatility. As more retailers treat canned aisles as loyalty battlegrounds, procurement teams increasingly favor the North America canned food packaging market for its scale, supply security, and track-and-trace capabilities.
Restraints Impact Analysis of North America Canned Food Packaging Market*
| Restraint | (~) % Impact on CAGR Forecast | Geographic Relevance | Impact Timeline |
|---|---|---|---|
| Plastic retort pouches displacing mid-size food cans | -0.7% | United States and Canada, strongest in ready-meal segments | Medium term (2-4 years) |
| Tinplate and aluminium price volatility squeezing converters | -0.9% | North America-wide, acute impact on specialty manufacturers | Short term (≤ 2 years) |
| Regulatory uncertainty around BPA-replacement chemistries | -0.4% | United States and Canada, varying by state/province | Long term (≥ 4 years) |
| Labour shortages at North-American can-making plants | -0.6% | United States and Canada, concentrated in manufacturing regions | Medium term (2-4 years) |
| Source: Mordor Intelligence | |||
Plastic Retort Pouches Displacing Mid-Size Food Cans
Lightweight flexible retort packs cut logistics costs by up to 30% compared with three-piece cans, attracting ready-meal brands that target urban millennials prioritizing portability. Retailers favor stand-up pouches, too, because each linear foot of shelf holds roughly 15% more SKUs than equivalent can facings, boosting category revenue density. Yet cans still prevail in 121 °C retort cycles where pouch delamination risk rises, and in value-pack formats where dent resistance matters during e-commerce fulfillment. Converters defend share by offering peel-off foil membranes and microwavable coatings that replicate pouch convenience. The contest limits, but does not reverse, volume growth for the North America canned food packaging market.
Tinplate and Aluminum Price Volatility Squeezing Converters
Tinplate now trades near USD 1,400 per metric ton after Section 232 tariffs removed tariff-rate quotas, driving two price hikes of 8–16% at Independent Can in 2025 alone. Crown had to pass along USD 94 million of metal inflation in Q1 2025, yet contractual lags compressed quarterly margins by 240 basis points. Domestic tinplate capacity covers barely 1% of U.S. steel output, so specialty grades often rely on imports from Germany or Taiwan, creating supply gaps when vessel slots tighten. As metals swing, some niche converters trim SKUs or exit low-volume lines, consolidating demand among the top five suppliers. Volatility, therefore, clouds near-term EBITDA trajectories across the North America canned food packaging market.
*Our forecasts treat driver/restraint impacts as directional, not additive. The impact forecasts reflect baseline growth, mix effects, and variable interactions.
North America Canned Food Packaging Market Segment Analysis
By Material:
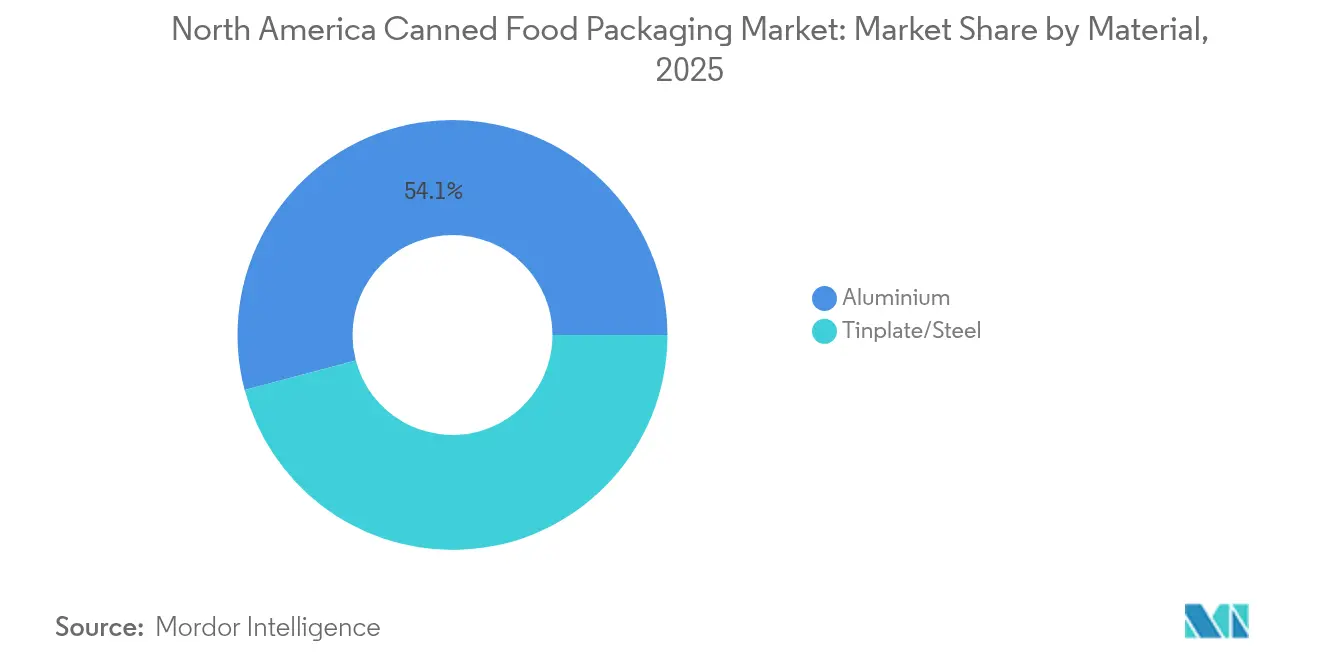
Aluminum’s Sustainability Premium Underpins LeadershipAluminum garnered 54.12% of North America canned food packaging market share in 2025 and is expanding at a 5.18% CAGR as brands highlight closed-loop recovery rates exceeding 70%. The substrate’s light weight slashes freight emissions and its bright surface supports high-definition printing that elevates shelf appeal. Steel remains indispensable for bulk tomato paste and institutional soup packs, especially Sizes #10 and #300, yet Section 232 tariffs have tilted cost curves, nudging mainstream processors toward aluminum ends even on steel bodies.
Innovation furthers aluminum uptake: alloy refinements let mills roll gauges down to 0.205 mm without pinhole risk, yielding an immediate 6% metal saving per can. Nestlé’s La Choy line adopted this thin wall in 2025, cutting annual metal needs by 1,200 tons. As state deposit programs add multipliers for containers with >70% recycled content, can makers that leverage used-beverage-can (UBC) feedstock can gain cost insurance. These fundamentals secure aluminum’s top slot in the North America canned food packaging market.

By Application:
Ready-Made Meals Still Rule, Soups Surge AheadReady-made meals commanded a 28.61% share of the North America canned food packaging market in 2025 as time-starved households embraced heat-and-eat kits that eliminate perishability concerns. Brand owners cooperated with converters to roll out integrated easy-open ends and microwave-safe lacquers that shorten prep to under two minutes.
Soups and broths, while smaller, are growing quickest at 5.51% CAGR on the strength of premium bone broths that retail above USD 4.25 per 14 oz can. Large pull tabs and matte varnishes reinforce artisan cues even in mass grocery, widening price bandwidth. The North America canned food packaging market size for soup alone is projected to reach USD 1.82 billion by 2031, reflecting steady cold-weather consumption patterns and category reinvention around global flavors.
By Can Structure:
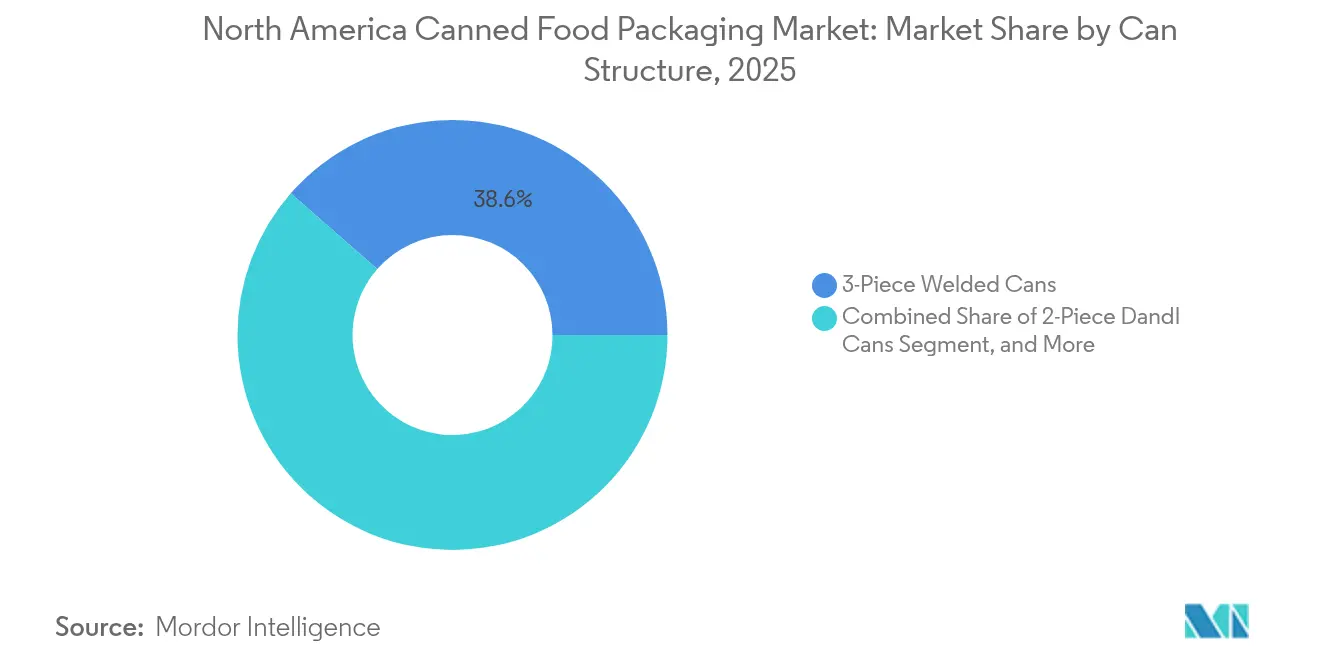
Three-Piece Predominates but Two-Piece DRD Gains PaceThree-piece welded formats held 38.55% share in 2025, thanks to entrenched line assets capable of 1,800 cans per minute changeovers. These lines deliver the lowest cost per thousand for traditional stack-height cans used in diced tomato and vegetable staples.
Two-piece DRD cans, however, are surging at a 5.82% CAGR because fewer seams translate to 9–11% metal savings and lower micro-leak risk. Crown’s 2024-25 Iowa plant switches between 211×400 and 300×407 bodies with less than 40 minutes of idle time, enabling mixed-SKU output for private-label customers. As canners chase e-commerce durability, DRD’s monolithic body offers dent resistance that reduces returns. Thus, structure choice is becoming a strategic lever within the North America canned food packaging market.
By Can Capacity:
Mid-Size 201–500 g Aligns with Portion ControlMid-range cans captured 29.42% share of the North America canned food packaging market size in 2025 and are advancing at 5.66% CAGR as health-focused shoppers portion calories more tightly. These cans cover single or dual servings, curbing food waste for smaller households.
Pet food magnifies the trend: 5.5 oz and 12.5 oz units make up nearly 70% of wet formulas, providing easy-lift formats for senior owners. Above-1,000 g cans persevere in foodservice beans and institutional soup, but limited freezer space in urban restaurants places a cap on volume. Up to Up-to-200 g slim cans appeal to gourmet pâtés and keto meals, yet their higher lid-to-body metal ratio keeps costs above the mass-market norm.
Geography Analysis
United States Canned Food Packaging Market
The United States accounted for 72.40% of the North America canned food packaging market in 2025 on the back of deep grocery penetration and a resilient manufacturing base clustered in the Midwest. Section 232 import duties are accelerating domestic sourcing, prompting players like Kimberly-Clark to budget over USD 2 billion for in-region automation and distribution hubs through 2030, further solidifying U.S. dominance.
Canada Canned Food Packaging Market
Canada delivers steady incremental gains underpinned by producer responsibility laws in Ontario and Québec that incentivize high recycling rates for metal. Lassonde’s USD 200 million New Jersey facility, although located in the U.S., is set to serve Canadian private-label volumes too, showcasing supply-chain integration. Concurrently, ingredient makers such as Jungbunzlauer invest CAD 200 million in Ontario fermentation plants, anchoring upstream inputs required by Canadian packers.
Mexico Canned Food Packaging Market
Mexico is the growth hot spot, climbing at 6.34% CAGR to 2031 as urbanization lifts demand for shelf-stable proteins and beans, core uses for two-piece D&I cans. Nestlé’s USD 1 billion 2025-27 capex plan selects Mexico for new culinary lines, banking on a swelling middle class that values longer pantry life in warmer climates. Local steelmaker Ternium boosts lacquered-coil output, trimming inbound freight and enhancing regional competitiveness within the North America canned food packaging market.
Regulatory Landscape
In the United States, canned food packaging is shaped by FDA food-contact and process controls, alongside trade actions affecting metal inputs. In June 2026, the White House issued a proclamation further adjusting tariff regimes for imported aluminum and steel into the United States, reinforcing cost and sourcing pressure for can bodies, ends, and coated coil used across food and pet food applications.
Food-contact chemical oversight is also tightening. In May 2026, the US FDA finalized a systematic post-market assessment process for food chemicals (including food contact substances), and in June 2026, the No Toxic Chemicals in Food Packaging Act of 2026 was introduced in Congress, targeting a list of chemicals for prohibition in food contact materials. Together, these actions add compliance work around can coatings and alternatives to legacy chemistries. In Canada, Health Canada maintains safety requirements for packaging materials under the Food and Drugs Act framework and continues to support voluntary Letters of No Objection (LONO) as a pathway for documenting acceptability, while CFIA preventive controls influence packers' requirements for traceability and process discipline.
Value Chain Analysis
The value chain starts with metal and coating inputs (aluminum coil, tinplate/steel, and coating chemistries), followed by can and end manufacturing (two-piece D&I/DRD and three-piece welded), then filling/retort by food and pet food processors, and finally distribution through grocery, club, and e-commerce channels. Upstream supply and pricing remain sensitive to trade measures: Section 232-related duties and tariff adjustments through 2026 amplify cost volatility, especially for tinplate where US supply relies heavily on imports. This dynamic pushes procurement teams toward multi-sourcing, longer-term contracts, and greater emphasis on domestic or regional coil availability.
Midstream, converters compete on line speed, lightweighting, and closure features, including easy-open ends and emerging smart or traceability elements. Regulatory and sustainability programs increasingly shape downstream requirements. FDA thermal processing rules and FSMA-linked traceability needs raise data and lot-control expectations, while state-level packaging EPR programs (operational in parts of the United States in 2026) add reporting and fee administration that cascades into brand-owner specifications and supplier documentation. These pressures increase the role of testing, compliance documentation, and recycled-content strategies, tightening collaboration between coil suppliers (for recycled-content and coating compatibility), can makers, and food processors.
Competitive Landscape
Market concentration is moderate: Silgan controls just above 50% U.S. unit volume, while Crown, Ball Metalpack (now Sonoco Metal Packaging), and Ardagh hold most of the rest.[3] Capital intensity-new two-piece presses that exceed USD 22 million per line-limits new entrants.
Aluminum supply alliances are strategic. Novelis guarantees Crown 300,000 tons of UBC-based coil annually, insulating it from London Metal Exchange shocks. Silgan’s 2024 Weener acquisition added 4,000 staff and advanced dispensing closures that cross-sell with food cans, giving the firm a wider customer toolkit.
Digital traceability is emerging as a differentiator. Trials pairing near-infrared inks with blockchain registries record retort date, seal pressure, and pallet ID, allowing pet-food brand owners to pinpoint quality deviations in under eight minutes, versus days previously. Players able to embed these smart features at line speed are poised to widen their share inside the North America canned food packaging market.
North America Canned Food Packaging Industry Leaders
-
Amcor plc
-
Crown Holdings, Inc.
-
Ball Corporation
-
CANPACK S.A.
-
Silgan Holdings Inc.
- *Disclaimer: Major Players sorted in no particular order
North America Canned Food Packaging Market Companies Covered in this Report
- Amcor plc
- Crown Holdings, Inc.
- Ball Corporation
- CANPACK S.A.
- Silgan Holdings Inc.
- Sonoco Products Company
- Trivium Packaging B.V.
- Ardagh Group S.A.
- CCL Industries Inc.
- Wells Can Company Ltd.
- Independent Can Company
- Container Supply Company, Inc.
- Allstate Can Corporation
- Ideal Can Inc.
- Toyo Seikan Group Holdings, Ltd.
- Mauser Packaging Solutions Holding Company
- ArcelorMittal S.A. – Packaging Steel
- Tata Steel Ltd. – Packaging Steel
- United States Steel Corporation – Packaging
- Novelis Inc.
Read Analysis of North America Canned Food Packaging Companies
Market Opportunities and Future Outlook
Regionalization and incremental capacity build-outs create whitespace for suppliers that can shorten lead times and de-risk imported inputs. In January 2026, Massilly North America announced an USD 85 million investment in a new Brantford, Ontario facility for food can manufacturing, supported by provincial funding, signaling nearshoring activity that can benefit Canadian and cross-border canned-food supply chains. In parallel, major players continue to add or optimize North American assets, and project timelines disclosed for late 2026 operations in some networks keep attention on securing long-term offtake commitments and qualifying new lines for food-contact compliance.
Differentiation opportunities are also concentrating around functionality, compliance-ready materials, and sustainability-linked operations. The June 2026 CANPACK and Canovation collaboration to accelerate the CanReseal aluminum can system highlights a pathway for metal packaging to compete more directly with flexible formats for convenience, particularly in single-serve and on-the-go use cases. At the same time, FDA activity on post-market assessment of food-contact chemicals and the introduction of federal legislation targeting specific chemicals raise demand for validated coating systems and documentation, favoring converters that can provide tested alternatives and traceability-enabled packaging. Investments such as Sonoco actions in 2026 that pair packaging capacity with site-level environmental infrastructure upgrades also point to openings for can makers that help brand owners meet internal ESG reporting and state-level program requirements while maintaining retort performance.
Recent Industry Developments in North America Canned Food Packaging Market
- June 2026: CANPACK and Canovation formalized a collaboration to advance the CanReseal resealable aluminum can system toward commercial launch and pilot-scale deployment. The initiative expands metal packaging functionality into reclose and portability use cases that typically favor flexible formats, supporting premiumization and new product formats in shelf-stable foods.
- February 2025: Ball Corporation completed the acquisition of Florida Can Manufacturing in Winter Haven, Florida, for USD 160 million. The acquisition strengthened Ball’s North American can manufacturing footprint and added capacity and customer access that can influence competitive dynamics for metal packaging supply in the region.
- February 2024: Crown Holdings reported results for full-year 2024 and noted strength in its North American food can business in the period. The update underscored the importance of scale players in balancing inflationary input costs and maintaining service levels for high-volume canned food categories.
North America Canned Food Packaging Market Report Scope and Research Methodology
Market Definition and Coverage
For this study, the market is defined as the revenue generated from packaging used to pack food in cans across North America, counted at the packaging level and tracked in USD for the study period.
Scope exclusions: This sizing excludes non-can formats used for shelf-stable foods, such as pouches, cartons, and plastic tubs.
Segments Covered in This Report
- By Material
- Tinplate/Steel
- Aluminium
- By Application
- Ready-made Meals
- Meat
- Sea Food
- Pet Food
- Fruits and Vegetables
- Soups and Broths
- Dairy and Infant Nutrition
- Other Applications
- By Can Structure
- 2-Piece D&I Cans
- 2-Piece DRD Cans
- 3-Piece Welded Cans
- By Can Capacity
- Up to 200 g
- 201 – 500 g
- 501 – 1000 g
- Above 1 000 g
- By Country
- United States
- Canada
- Mexico
Data Sources, Market Sizing, and Validation
Desk Research
Desk research was used to build the starting structure of the market and to anchor key assumptions that can be checked in public data. We referred to sources such as the US Census Bureau, Statistics Canada, the US International Trade Commission trade data, UN Comtrade, and public releases from food and packaging associations to understand production and trade direction.
Along with that, we reviewed company annual reports, investor presentations, earnings call notes, and credible business press coverage to track capacity additions, material mix shifts (steel versus aluminum), and major demand moves in canned food. For cross-checking financial direction and patent activity around can forming and coatings, we also used paid subscriptions focused on company financials and patent databases. The desk sources listed here are illustrative, and we used additional public sources for collection, validation, and clarification.
Primary Interviews and Surveys
Primary work was used to stress-test assumptions that are hard to confirm from public sources, especially around price realization, mix by can format, and how quickly new can lines ramp up. We spoke with packaging suppliers, material and component participants, and buyers linked to canned food production across the United States, Canada, and Mexico, so regional demand patterns were not generalized.
Inputs from these discussions were used to confirm what is counted as canned food packaging, correct unrealistic utilization or price assumptions, and align the forecast with what market participants indicate about ordering and contracting behavior.
Distribution of primary research fieldwork respondents
| Company type | Respondent position |
|---|---|
| Top tier: 30% | CXOs: 12% |
| Mid tier: 56% | Functional/Unit leaders: 42% |
| Smaller Players: 14% | Managers: 46% |
Market-Sizing & Forecasting
The core sizing logic uses a top-down approach where food can demand is reconstructed from canned food output and pack-type mix indicators, then translated into packaging value using observed price ranges and mix by can structure. To keep the totals realistic, we corroborated the result with selective bottom-up approximations, such as sampling supplier revenues where disclosed, applying observed can-type splits, and checking implied volumes against known capacity signals.
Key inputs that shaped the model included canned food production trends by country, import and export direction for relevant metal packaging and components, material share shifts between steel and aluminum, typical can size and pack count mix, and price movement tied to metal cost pass-through and contract timing. Where bottom-up disclosures were incomplete, gaps were handled through conservative mix assumptions that were then re-checked through interviews and adjusted only when multiple independent signals supported the change.
For forecasting, scenario analysis was used so different demand paths for shelf-stable food consumption, retailer ordering cycles, and material cost pressure could be tested without forcing a single aggressive curve. The final forecast path was selected after aligning the scenarios with what primary respondents indicated about expected volume stability, price realization, and investment pace over the forecast window.
Data Validation & Update Cycle
Validation was done by triangulating the model outputs against independent signals, such as trade direction, capacity expansion announcements, and implied packaging intensity per unit of canned food produced. Outliers were flagged when year-on-year shifts looked too large versus known drivers, and those lines were reworked until the variance could be explained with a clear assumption.
Before sign-off, the model and assumptions go through multi-step internal review so calculation logic, unit consistency, and currency treatment are checked. Reports are refreshed annually, and interim updates are triggered when material events occur, such as major capacity changes or sharp raw material moves. Just before delivery, we do a fresh pass to ensure the latest public updates are reflected in the market numbers and narrative.
Mordor Intelligence's North America Canned Food Packaging Market Sizing Compared With Other Published Estimates
Published market sizes for canned food packaging can look far apart, even when the geography label seems similar, because underlying counting rules are not always aligned. The biggest gaps usually come from what packaging formats are included, whether values are counted at the can-maker level or extended into broader packaging spend, and how price and mix are carried forward from the base year.
The main gap comes from including non-can shelf-stable packaging and broader food packaging spend, where Mordor Intelligence counts only packaging revenue tied to food cans by material and can structure, with mix and pricing refreshed using country-level checks and recent input from industry discussions.
Benchmark comparison
| Source | Market Size | Gaps in Research Methodology |
|---|---|---|
| Mordor Intelligence | USD 9.38 B (2026) | |
| Industry Publisher A | USD 10.50 B (2024) | Uses an earlier base year and a broader regional bucket, and the scope description is less explicit on whether adjacent shelf-stable packaging formats are excluded, which can lift the total. |
| Research Publisher B | USD 29.22 B (2024) | The value level appears expanded beyond food cans into wider packaging spend, which can multiply the market size if containers, closures, and non-can formats are counted together. |
The spread in the table is mainly explained by scope and value-chain coverage, followed by base-year timing and how price and mix are rolled forward. By keeping the definition tied to food cans and by re-checking mix, sizing stays traceable to clear demand indicators and repeatable steps, which helps users compare year to year without hidden category overlap.
Key Questions Answered in the Report
How large is the North America canned food packaging market in 2026?
The market stands at USD 9.38 billion in 2026 and is on track to reach USD 11.41 billion by 2031 at a 3.99% CAGR.
Which material leads in North American food cans?
Aluminum leads with 54.12% share thanks to its infinite recyclability and barrier performance.
What is the fastest-growing application for food cans?
Soups and broths register the highest growth, advancing at a 5.51% CAGR through 2031.
Why are two-piece DRD cans gaining traction?
They cut metal use up to 11%, integrate easy-open ends, and deliver stronger dent resistance, lifting adoption at a 5.82% CAGR.
Which country shows the quickest growth in canned food packaging?
Mexico is expanding the fastest, recording a 6.34% CAGR driven by industrialization and rising middle-class demand.
How are tariffs affecting can makers?
The reinstated 25% Section 232 tariffs raise tinplate and aluminum costs, compressing margins and accelerating domestic sourcing.