
North America Building Information Modelling Market Size and Share
Market Overview
| Study Period | 2020 - 2031 |
|---|---|
| Forecast Data Period | 2026 - 2031 |
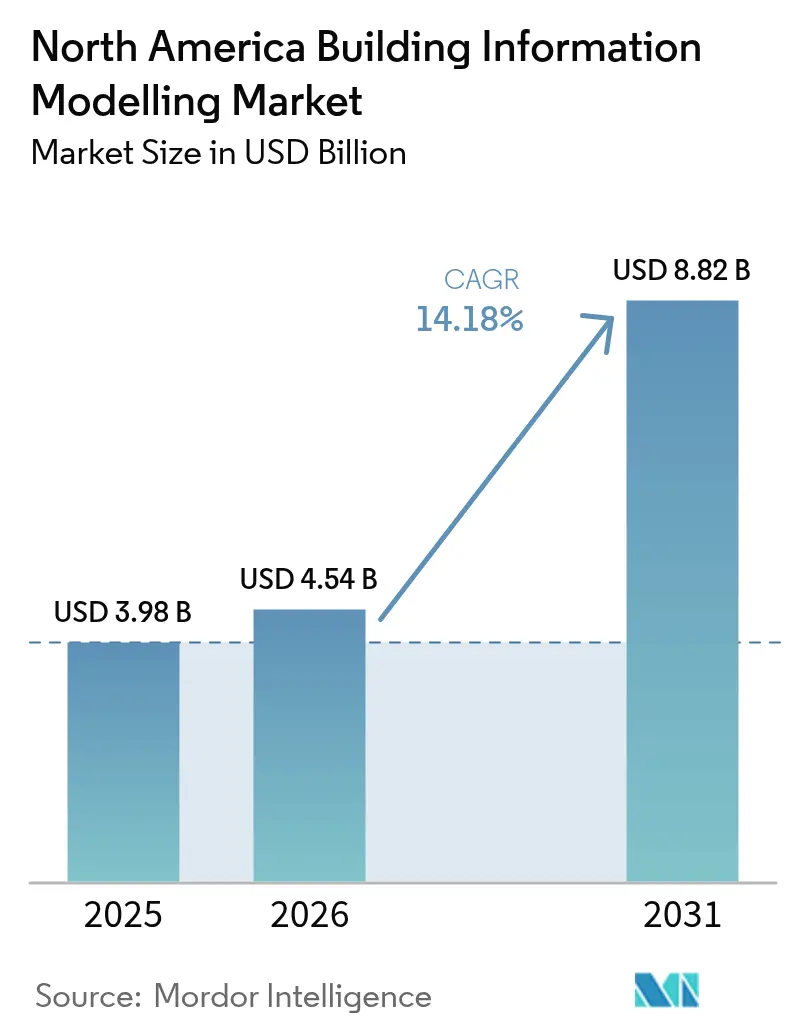
| Base Year Market Size (2025) | USD 3.98 Billion |
| Market Size (2026) | USD 4.54 Billion |
| Market Size (2031) | USD 8.82 Billion |
| Growth Rate (2026 - 2031) | 14.18 % |
| Market Concentration | Medium |
Major Players *Disclaimer: Major Players sorted in no particular order Image © Mordor Intelligence. Reuse requires attribution under CC BY 4.0. | |
North America Building Information Modelling Market Analysis by Mordor Intelligence
The North America Building Information Modelling market size was valued at USD 3.98 billion in 2025 and estimated to grow from USD 4.54 billion in 2026 to reach USD 8.82 billion by 2031, at a CAGR of 14.18% during the forecast period (2026-2031). Robust expansion is rooted in generative AI that automates design tasks, accelerating federal and state BIM mandates, and a push to retrofit existing buildings for decarbonization.[1] Cloud-native collaboration tools are widening access for small and medium enterprises, while insurers now offer premium discounts for BIM-centric risk modeling, further boosting adoption. Commercial real estate maintains the largest user base, yet residential construction posts double-digit growth as developers digitize workflows, and Mexico’s infrastructure boom positions the country as the fastest-growing geography.
Key Report Takeaways
- By component, software led with 81.65% of the North America Building Information Modelling market share in 2025, while services are advancing at a 14.72% CAGR through 2031.
- By deployment mode, on-premise solutions held 63.15% share of the North America Building Information Modelling market size in 2025; cloud platforms exhibit the highest projected CAGR at 15.32% to 2031.
- By application, commercial construction accounted for 41.25% share of the North America Building Information Modelling market size in 2025 and residential projects are rising at a 15.74% CAGR through 2031.
- By project lifecycle phase, pre-construction and design captured 47.05% of the North America Building Information Modelling market share in 2025, whereas operations and maintenance record the steepest CAGR at 15.26% to 2031.
- By geography, the United States commanded an 80.75% share of the North America Building Information Modelling market size in 2025, and Mexico shows the fastest expansion at a 15.29% CAGR through 2031.
Note: Market size and forecast figures in this report are generated using Mordor Intelligence’s proprietary estimation framework, updated with the latest available data and insights as of 2026.
North America Building Information Modelling Market Trends and Insights
Drivers Impact Analysis*
| Driver | (~) % Impact on CAGR Forecast | Geographic Relevance | Impact Timeline |
|---|---|---|---|
| Generative AI-powered design optimization | +3.2% | United States tech hubs, early adopters in Mexico | Medium term (2-4 years) |
| Government BIM mandates and incentives | +2.8% | United States federal sector, Canadian provinces | Short term (≤ 2 years) |
| Rising retrofit demand for decarbonization | +2.1% | Urban cores across North America | Long term (≥ 4 years) |
| Cloud-native collaboration for SMEs | +2.4% | North American SMEs with spill-over from APAC precedents | Medium term (2-4 years) |
| Insurance premium discounts for BIM models | +1.8% | United States and Canada | Long term (≥ 4 years) |
| Digital-twin convergence with smart-city aid | +2.4% | Municipal programs in United States, Canada and Mexico | Long term (≥ 4 years) |
| Source: Mordor Intelligence | |||
Generative AI-Powered Design Optimization Accelerates Workflow Automation
Generative AI features embedded in leading BIM tools automatically iterate structural and energy models, cutting project delivery time by up to 30%.[2] Autodesk Forma and Graphisoft Archicad 28 include AI-driven documentation that speeds code checks, a benefit appreciated by 85% of Mexican firms pursuing competitiveness. Machine learning now scans historic project data to recommend material choices that improve energy intensity. Vendors employ cloud inference engines so even small laptops can harness advanced computation. Early adopters report fewer RFIs during construction because clash detection is executed at the concept stage, although firms must budget additional training hours to realize these gains.
Government BIM Mandates Create Compliance-Driven Adoption
The U.S. General Services Administration requires model-based submissions for all major public builds, pushing contractors toward full BIM workflows.[3] Canada’s federal Collaborative Procurement framework sets BIM deliverable thresholds for projects above CAD 5 million. Several states and provinces supplement these rules with tax rebates on documented BIM execution plans, although inconsistent local codes still impose re-work. ISO 19650 alignment in both countries raises documentation quality and accelerates permit reviews. Contractors that cannot meet evolving mandates face exclusion from publicly financed opportunities, driving service demand for compliance audits and model validation.
Rising Retrofit Demand Drives Decarbonization-Focused Applications
North America’s aging building stock now represents a prime target for deep energy retrofits that rely on accurate as-built modeling. Owners use BIM to simulate photovoltaic fit-outs, window replacements, and HVAC overhauls that cut operating emissions. Laser scanning feeds point clouds into BIM tools, yet processing remains labor-intensive, challenging smaller contractors. Lenders increasingly link green finance approval to BIM-derived energy analyses that verify payback. Training programs funded by municipal climate initiatives aim to upskill trades so they can interpret digital models during retrofit execution.
Cloud-Native Collaboration Democratizes SME Access
Cloud platforms remove capital expenditure on high-end workstations, letting small firms subscribe to browser-based model editors that synchronize changes in real time. Surveys show 69% of Revit users are ready to migrate once security concerns are addressed. Data sovereignty questions persist, prompting some owners to mandate domestic data centers. Hybrid architectures are therefore popular, storing sensitive files on-premise while using the cloud for clash detection. Service marketplaces connect SMEs to freelance BIM coordinators, spreading specialist knowledge without full-time hiring costs.
Restraints Impact Analysis*
| Restraint | (~) % Impact on CAGR Forecast | Geographic Relevance | Impact Timeline |
|---|---|---|---|
| High Upfront Training and Cultural Change Costs | -2.1% | Global, particularly affecting SMEs | Short term (≤ 2 years) |
| Fragmented Building Codes Across United States States | -1.4% | US national, state-level variations | Medium term (2-4 years) |
| Cyber-Security Concerns Around Cloud BIM Repositories | -1.8% | North America and EU, cloud-dependent markets | Medium term (2-4 years) |
| IP Ownership Disputes in Multi-Stakeholder Models | -1.2% | Global, complex project environments | Long term (≥ 4 years) |
| Source: Mordor Intelligence | |||
High Upfront Training and Cultural Change Costs Constrain SME Adoption
A BIM workstation can cost USD 10,000, while advanced user training surpasses USD 5,000 per employee. Smaller contractors often lack reserves for such outlays, slowing technology penetration beyond tier-one builders. Resistance to new workflows also persists because trades rely on familiar 2D drawings. Professional indemnity complexities arise when multiple parties edit a shared model, prompting legal reviews that add time and expense. Public grants partially offset costs, but many SMEs still prioritize near-term cash flow over digital investment.
Fragmented Building Codes Across United States Create Implementation Complexity
Each U.S. state enforces unique code amendments, forcing architects to configure bespoke BIM templates and rule-sets for compliance. This fragmentation undermines software economies of scale and complicates multi-state projects. Pilot efforts to digitize codes into machine-readable formats remain nascent. Contractors, therefore, maintain parallel execution plans, adding administrative overhead that erodes productivity gains. National standardization would raise BIM efficiency, yet requires coordination among thousands of local permitting bodies.
*Our forecasts treat driver/restraint impacts as directional, not additive. The impact forecasts reflect baseline growth, mix effects, and variable interactions.
Segment Analysis
By Component: Services Growth Outpaces Software Maturation
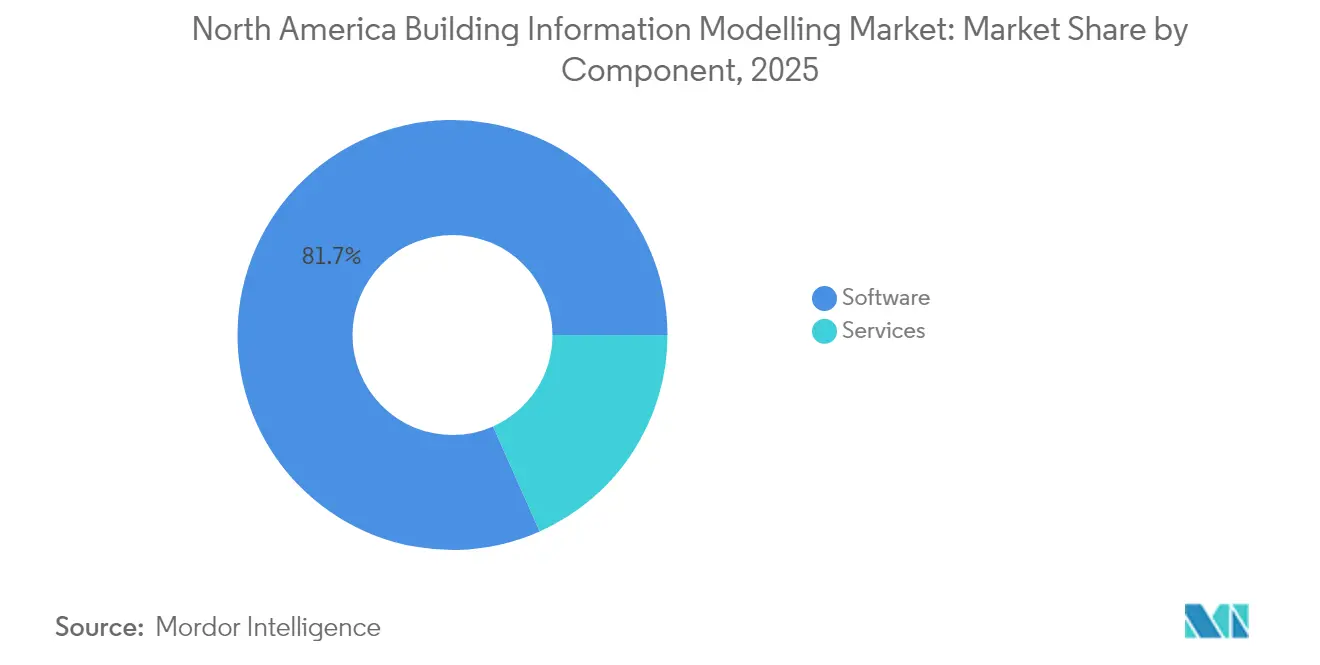
Software retained 81.65% of the North America Building Information Modelling market share in 2025 and has historically underpinned digital construction workflows. Continuous upgrades, such as AI-driven clash detection, sustain license renewals and support subscriptions. However, services are outstripping software with a 14.72% CAGR because implementation complexity drives organizations to outsource deployment, integration, and training. Consulting engagements range from project-specific modeling to enterprise-wide digital roadmaps, highlighting that technology alone cannot deliver full value.
Demand for tailored education programs illustrates the skills gap that limits internal execution capacity. Certification courses teach ISO 19650 compliance, data exchange protocols, and common data environment governance. Maintenance contracts also expand as owners migrate between on-premise and cloud solutions, requiring vendor-agnostic expertise to preserve data integrity. Consequently, services revenue is projected to narrow the gap with software by 2031, even though licenses will remain the foundation of the North America Building Information Modelling market.

By Deployment Mode: Cloud Acceleration Challenges On-Premise Dominance
On-premise systems still commanded 63.15% of the North America Building Information Modelling market size in 2025 due to established IT policies at large contractors. These environments offer direct control over sensitive intellectual property and integrate smoothly with legacy file servers. Yet cloud platforms are expanding at a 15.32% CAGR, propelled by rising remote collaboration demands and subscription pricing that lowers entry barriers. The hybrid approach, in which companies retain vault storage on-site while using cloud engines for rendering and coordination, is gaining popularity.
Cloud vendors emphasize zero-trust security and regional data centers to address owner concerns. Real-time model federation lets architects, engineers, and builders co-author files, shortening design iterations and reducing errors downstream. Payment flexibility is a compelling draw for SMEs that prefer operating expenses over capital expenditure. Over time, the cost of maintaining physical servers and the talent to administer them is expected to propel further migration toward fully hosted environments.
By Application: Residential Surge Contrasts Commercial Maturity
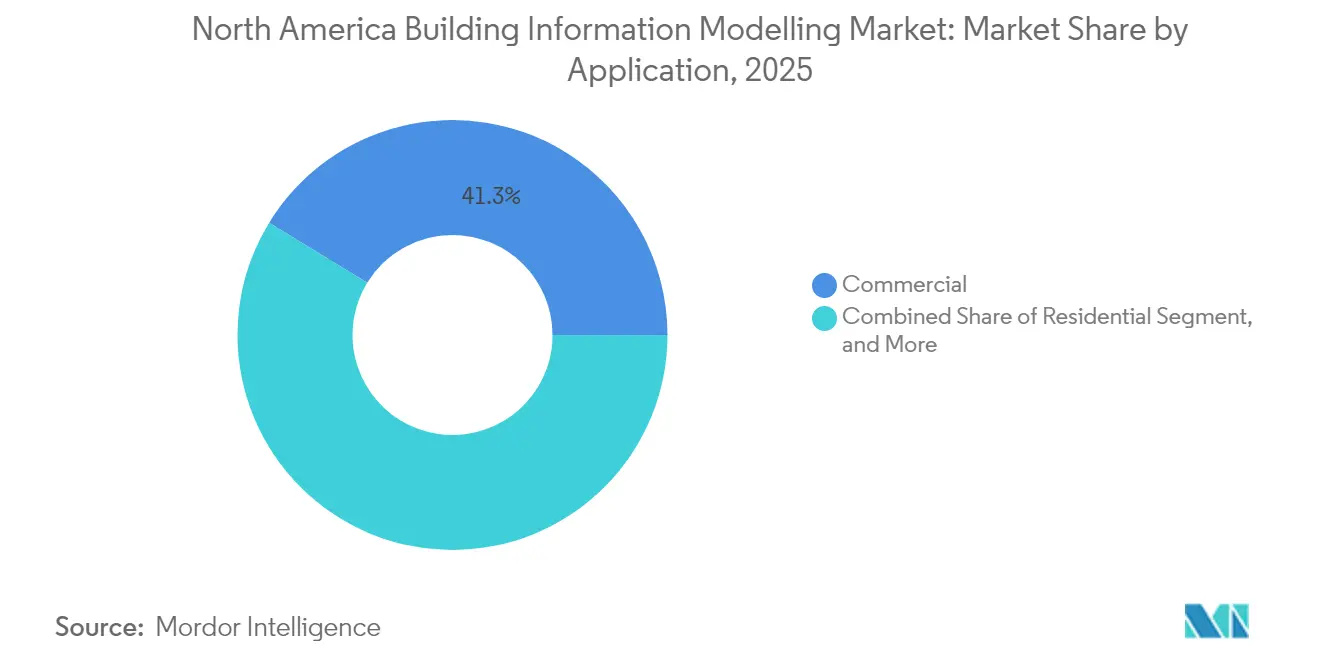
Commercial projects held 41.25% of the North America Building Information Modelling market size in 2025 and have long utilized digital coordination to manage complex MEP systems. Hospitals and higher education facilities employ BIM to achieve sustainability certifications and operational data handover. Conversely, residential construction posts the fastest 15.74% CAGR as single-family and multi-family developers adopt BIM to mitigate labor shortages and comply with stricter energy codes. Model-based quantity take-off improves budget certainty, appealing to lenders amid elevated borrowing costs.
Industrial and infrastructure sectors also leverage BIM for system-heavy facilities such as factories and rail networks. Mexico’s Tren Maya, for instance, mandates model-based documentation for all stations and track works, creating new opportunities for regional service providers. Public agencies increasingly require BIM for environmental impact assessments, spurring adoption even in smaller municipalities. Growing acceptance across these diverse applications underscores BIM’s versatility throughout North America.
By Project Lifecycle Phase: Operations Growth Reflects Digital Twin Convergence
Pre-construction and design dominated with 47.05% of the North America Building Information Modelling market share in 2025 because early-stage coordination underpins successful delivery. Value engineering, code compliance checks, and stakeholder visualization are well established. Operations and maintenance, however, lead growth at a 15.26% CAGR as owners connect models to sensor networks and facility management systems. Digital twins enable predictive maintenance that reduces downtime and energy consumption, extending BIM’s value beyond handover.
Structured data exchanges such as COBie v3 ease integration with computerized maintenance management systems. Asset owners can track equipment warranties, schedule inspections, and allocate capital budgets based on model intelligence. As the installed base of BIM-enabled assets expands, facility teams invest in cloud dashboards to monitor performance, driving recurring software and analytics revenue. This shift from project to lifecycle mindset marks a pivotal evolution in the North America Building Information Modelling market.
Geography Analysis
The United States accounted for 80.75% of the North America Building Information Modelling market size in 2025, supported by federal mandates that require native and IFC models on public projects. Major private owners also stipulate BIM deliverables, fostering a deep ecosystem of consultants and certified professionals. Despite dominance, state-level code variation hampers uniform workflows and inflates compliance costs.
Canada shows steady advancement backed by its Collaborative Procurement Initiative and the Canadian Practice Manual for BIM that align with ISO 19650. Provincial transport agencies integrate BIM and GIS to manage infrastructure lifecycles, and defense projects demonstrate sophisticated digital twin use cases. Yet inconsistent provincial codes mirror U.S. fragmentation, limiting nationwide economies of scale.
Mexico represents the fastest expansion with a 15.29% CAGR to 2031, driven by nearshoring, data center construction, and flagship infrastructure such as Tren Maya. International developers demand LEED and energy performance documentation that BIM readily supplies. Government entities progressively reference ISO standards for public tenders, bolstering local capacity. Cloud-ready SMEs in Mexico City and Monterrey use subscription software to compete for cross-border projects, signaling lasting momentum.
Regulatory Landscape
North America does not operate under a single, uniform BIM mandate; adoption is commonly driven by owner and agency requirements embedded in procurement and delivery standards. In the United States, major public owners use agency-level BIM manuals and protocols, including U.S. General Services Administration model-based submission requirements and the U.S. Department of Veterans Affairs BIM Manual, to shape deliverable expectations such as BIM Execution Plans, model handover data, and use of open standards like IFC and COBie. At sub-national levels, municipal and state entities also publish prescriptive BIM standards and protocols, including City of Seattle BIM standards and the State of Ohio BIM protocol, reinforcing a compliance environment that varies by jurisdiction and project type.
In Canada, standards alignment has tightened around ISO 19650 information management, including the November 2024 adoption of CAN/CGSB/CSA-ISO 19650-4:24, while public-sector efforts increasingly focus on digitizing codes and permitting workflows. Federal programs and solicitations tied to digital compliance checking, alongside National Research Council Canada work to translate national construction codes into machine-consumable formats and connect BIM data structures to approval pathways, continue to expand the compliance use case. In February 2026, Canada Mortgage and Housing Corporation published a project profile for a Building Information Management toolkit for housing, signaling continued public-owner activity to standardize BIM requirement language for non-profit and housing-sector delivery.
Value Chain Analysis
The North America BIM value chain starts with standards-setting and specification bodies and public owners that define deliverables, including NBIMS-US references and ISO 19650-aligned information requirements. Software publishers then provide authoring, coordination, simulation, and common data environment capabilities, while system integrators and specialist service firms translate these requirements into project workflows through implementation, integration, content or template development, and training. Architects, engineers, contractors, and trade partners deliver projects using these model-based workflows, and downstream owners and facility operators consume structured handover data to support operations and maintenance, increasingly connecting BIM to digital twins, GIS, and enterprise asset and facility management systems.
Interoperability and data governance sit at the center of value realization, with openBIM exchanges (IFC/COBie) and disciplined BEPs reducing rework across multi-stakeholder projects. Hardware and capture inputs such as laser scanning and reality capture feed as-built updates, while cloud platforms provide collaboration and compute for coordination and analysis. The market keeps consolidating toward service-heavy enablement, illustrated by February 2025 rebranding of Applied Software to GRAITEC North America, as vendors and partners expand regional delivery capacity for deployment, training, and workflow standardization.
Competitive Landscape
Market concentration sits at a mid-level as long-standing leaders Autodesk, Bentley Systems, and Trimble continue to dominate core modeling domains while facing nimble challengers. Hexagon’s 2024 acquisition of Voyansi adds geospatial intelligence to its portfolio, and Nemetschek’s 2024 purchase of GoCanvas builds field data acquisition strength.[4] Bentley’s December 2024 deal for Cesium opens new 3D geospatial visualization avenues, underscoring a race to assemble end-to-end digital construction ecosystems.
AI-native startups target design generation, automated code checking, and energy optimization, often offering browser-based interfaces that reduce IT friction for SMEs. Interoperability remains a strategic differentiator; vendors promoting open standards such as IFC and COBie gain favor on multi-stakeholder projects. Service firms partner with software suppliers to bundle implementation and compliance support, generating holistic value propositions.
Insurers, lenders, and asset owners exert growing influence by embedding BIM deliverables into contracts, reshaping vendor roadmaps toward data transparency and lifecycle analytics. As subscription business models mature, incumbents must balance license revenue with managed services to defend share within the North America Building Information Modelling market. Mergers that streamline compliance, sustainability reporting, and cloud collaboration are likely through the forecast period.
North America Building Information Modelling Industry Leaders
-
Autodesk Inc.
-
Bentley Systems Incorporated
-
Trimble Inc.
-
Nemetschek SE
-
Dassault Systèmes SE
- *Disclaimer: Major Players sorted in no particular order

Market Opportunities and Future Outlook
Digitized compliance and permitting workflows represent a clear whitespace in North America, especially in Canada where government-linked initiatives connect building code digitalization to machine-assisted compliance checking. National Research Council Canada activity to translate national construction codes into BIM-compatible, machine-consumable formats supports demand for software features that map BIM objects and properties to regulatory rule sets, and for services that validate models against owner and authority requirements. As more public and institutional buyers specify ISO 19650-aligned information management and openBIM deliverables, interoperability tooling, including IFC/COBie and information delivery specifications with common data environment governance, becomes a practical buying criterion rather than a technical preference.
Contractual standardization of deliverables also creates room for repeatable, packaged offerings across owners and geographies. BIMForum publication of the LOD Specification 2025 (released January 2026) provides an updated baseline for model content and handover definitions, supporting templated scopes for BIM services, model checking, and lifecycle data delivery. On the delivery side, cloud collaboration and security assurance increasingly shape enterprise adoption decisions, creating opportunities for vendors and integrators to pair cloud-native BIM platforms with governance, cybersecurity controls, and automated model validation to reduce friction for multi-party projects and operations-focused use cases.
Recent Industry Developments
- June 2026: Autodesk signed a strategic collaboration agreement with Amazon Web Services (AWS) to advance cloud-based design and make solutions. The agreement supports deeper cloud infrastructure alignment for BIM collaboration and compute-heavy workflows, reinforcing the industry shift from on-premise coordination to cloud-native delivery models.
- April 2026: Bentley Systems announced that ProjectWise and OpenGround achieved FedRAMP Authorization at the Moderate Impact Level, sponsored by the U.S. Army Corps of Engineers. The authorization strengthens Bentley's position for U.S. federal infrastructure programs where accredited cloud environments are a procurement requirement and supports cloud-hosted project delivery and geotechnical data management.
- December 2024: Bentley Systems acquired Cesium for USD 60 million, expanding its 3D geospatial visualization capabilities for infrastructure digital twins. The acquisition tightens integration between BIM and geospatial context, improving project visualization and asset lifecycle analysis across transportation and public works portfolios.
Research Methodology Framework and Report Scope
Market Definition and Coverage
For this study, the market covers revenues generated from building information modelling (BIM) software and related services used to create, coordinate, and manage digital building and infrastructure models across North America.
Scope exclusions: This sizing does not count general construction labor, raw construction materials, or non-BIM design tools that are not used for model-based project delivery.
Segmentation Overview
- By Component
- Software
- Design Authoring
- Model Review and Coordination
- Simulation and Analysis
- Project Management
- Services
- Consulting
- Implementation and Integration
- Training and Certification
- Support and Maintenance
- Software
- By Deployment Mode
- On-Premise
- Cloud
- By Application
- Commercial
- Office
- Retail
- Healthcare
- Education
- Residential
- Single-Family
- Multi-Family
- Industrial
- Manufacturing
- Energy and Utilities
- Infrastructure
- Transportation
- Public Safety and Government Facilities
- Commercial
- By Project Lifecycle Phase
- Pre-Construction/Design
- Construction
- Operation and Maintenance
- By Country
- United States
- Canada
- Mexico
Data Sources, Market Sizing, and Validation
Desk Research
Desk research was used to define the market boundary, set realistic adoption ranges, and avoid double counting between BIM software and BIM-related services. We reviewed public construction spending and permitting signals, then aligned those indicators with how BIM is typically adopted in project delivery and procurement.
Sources typically included official statistics and standards references such as the US Census Bureau construction spending series, US Bureau of Labor Statistics employment and wage data for architecture and engineering roles, US General Services Administration and other public procurement portals, National Institute of Standards and Technology publications where relevant, and publicly available guidance from buildingSMART and similar industry bodies. We also used company filings, product documentation, investor presentations, and reputable press coverage, then filled remaining gaps with paid subscriptions for company financials, patent lookups, and contract and tender tracking. The sources listed here are not exhaustive, and many other public and paid references were used to collect, cross-check, and clarify inputs.
Primary Interviews and Surveys
Primary work focused on validating what is actually bought and deployed on projects, and how spend is split across software licenses, subscriptions, implementation, and ongoing support. We spoke with a mix of BIM software and service providers, implementation partners, and end users such as AEC decision-makers across the US, Canada, and Mexico, and we used these discussions to confirm pricing logic, the pace of cloud migration, and typical lifecycle usage (pre-construction through operations).
Distribution of primary research fieldwork respondents
| Company type | Respondent position |
|---|---|
| Top tier: 33% | CXOs: 15% |
| Mid tier: 52% | Functional/Unit leaders: 36% |
| Smaller Players: 15% | Managers: 49% |
Market-Sizing & Forecasting
The core model uses a top-down build that reconstructs the North America spend pool from construction activity and digital delivery adoption, then applies BIM penetration and spend intensity by project type and lifecycle stage. Once that spend picture is formed, we corroborate it with selective bottom-up approximations, such as sampled subscription and services pricing ranges, channel checks on implementation intensity, and revenue sanity checks using publicly visible company disclosures, which are then used to adjust outliers.
Inputs that mattered most included nonresidential and infrastructure construction spend trends, the pace of cloud deployment versus on-premise usage, average subscription pricing bands by seat and by project, services attach rates for implementation and training, and the share of BIM use moving into operations and maintenance. Where direct splits were unclear, we handled gaps by applying interview-backed ranges and testing how sensitive totals were to changes in pricing and adoption.
For forecasting, we used scenario analysis supported by a light multivariate regression view using drivers such as construction spending, labor availability in AEC roles, and policy or owner-led BIM mandate signals. The final forecast was kept traceable to the same variables each year so the model can be repeated and explained without relying on hard-to-access data.
Data Validation & Update Cycle
Outputs were cross-checked against independent indicators like construction spending direction, procurement activity for model-based delivery tools, and the observed shift toward cloud collaboration, then reviewed for internal consistency across components and lifecycle stages. When variances showed up, the assumptions were revisited, and targeted re-contacts were triggered to confirm whether the gap was due to pricing, packaging changes, or uneven adoption by project type.
Before sign-off, a multi-step analyst review was completed so the model totals, growth rates, and implied pricing stayed reasonable. The report is refreshed annually, with interim updates for material events, and a final pre-delivery pass is done so clients receive the most current view.
Mordor Intelligence's North America Building Information Modelling Market Estimate Compared With Other Published Estimates
Published figures for the North America BIM market do not always match because the market boundary is not identical across sources, and even the starting year can change the total. Differences also come from how software versus services are counted, and whether values are reported as project-based spending or as vendor revenue.
Construction spending signals, procurement activity for model-based delivery, and pricing checks from interviews provide the link that ties Mordor Intelligence's estimate to a defined software-plus-services demand pool, rather than folding in broader digital construction tools. In a few external estimates, the scope appears closer to BIM software only, or it uses an earlier base year and then projects aggressive growth without re-checking license and services attach rates in the current year.
Benchmark comparison
| Source | Market Size | Gaps in Research Methodology |
|---|---|---|
| Mordor Intelligence | USD 3.98 B (2025) | |
| Industry Publisher A | USD 3.25 B (2025) | Often presented as BIM software-led revenue, which can undercount implementation, integration, and training services purchased alongside deployments. |
| Consulting Group B | USD 3.34 B (2023) | Uses an earlier base year and a long-range CAGR track, and the bridge from project activity to vendor revenue is not clearly shown, which can shift totals versus a current-year demand build. |
Across the three figures, the spread mainly traces back to scope and base-year choices, plus how services are treated in the total. By keeping the inputs anchored to observable construction activity and interview-tested pricing and attach rates, the resulting market size stays transparent and repeatable year to year.
Key Questions Answered in the Report
How large is the North America Building Information Modelling market in 2026?
The market stands at USD 4.54 billion in 2026 with a 14.18% CAGR forecast to 2031.
Which segment is growing fastest within North America BIM?
Services are rising at 14.72% CAGR, reflecting demand for implementation, integration and training.
What deployment mode is gaining traction among SMEs?
Cloud platforms are growing 15.32% CAGR as subscription pricing lowers capital barriers and supports remote collaboration.
Why is Mexico the fastest-growing geography for BIM in the region?
Nearshoring, megaprojects like Tren Maya and increasing LEED certification requirements drive a 15.29% CAGR for Mexico through 2031.
How does generative AI influence BIM workflows?
AI automates design iterations, clash detection and documentation, shaving up to 30% from delivery timelines while enhancing energy performance modeling.
What is the main barrier preventing smaller firms from adopting BIM?
High upfront costs for hardware and specialized training, alongside cultural resistance to new workflows, limit SME adoption.