
North America Building Automation Systems Market Size and Share
Market Overview
| Study Period | 2020 - 2031 |
|---|---|
| Forecast Data Period | 2026 - 2031 |
| Historical Data Period | 2020 - 2024 |
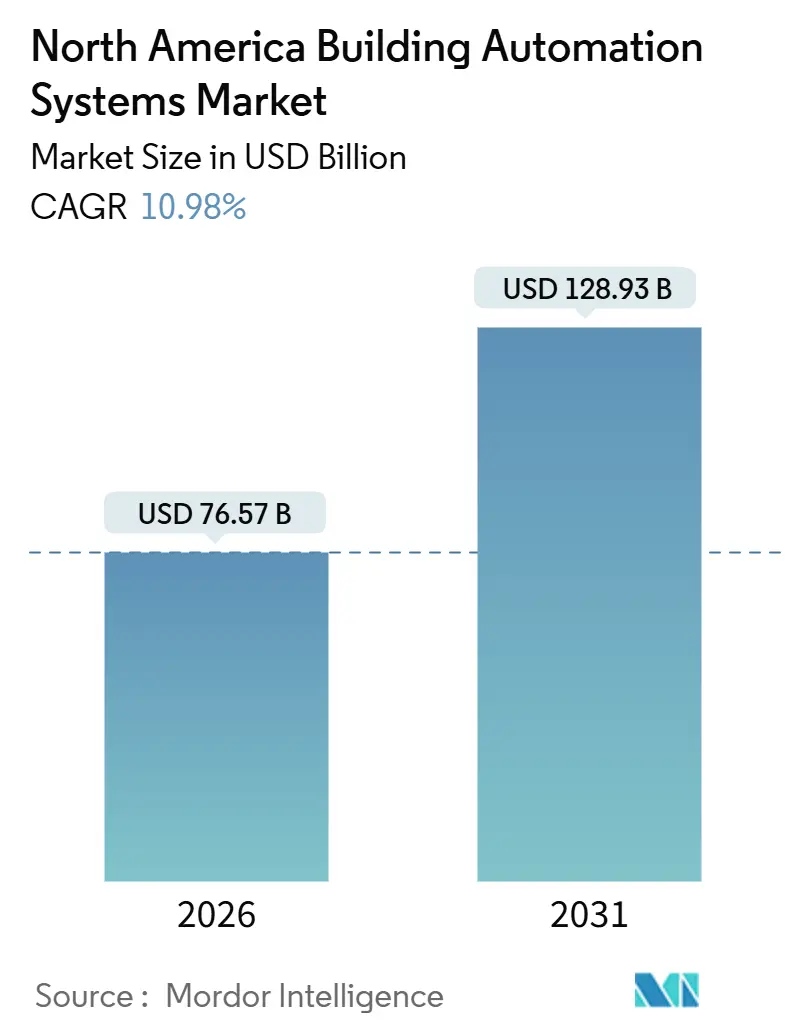
| Market Size (2026) | USD 76.57 Billion |
| Market Size (2031) | USD 128.93 Billion |
| Growth Rate (2026 - 2031) | 10.98 % |
| Market Concentration | Medium |
Major Players *Disclaimer: Major Players sorted in no particular order Image © Mordor Intelligence. Reuse requires attribution under CC BY 4.0. | |
North America Building Automation Systems Market Analysis by Mordor Intelligence
The North America building automation systems market size reached USD 76.57 billion in 2026 and is forecast to climb to USD 128.93 billion by 2031, reflecting a 10.98% CAGR. Strong federal decarbonization incentives, rapid tenant demand for verifiable carbon cuts, and the pivot to cloud-native analytics are reshaping procurement criteria and compressing project timelines. Hardware still contributes the largest single revenue block, yet software and wireless networking are capturing incremental growth as owners favor scalable, subscription-based models. Regulatory pressure in the United States and carbon-pricing schemes in Canada continue to convert voluntary upgrades into compliance obligations, while nearshoring in Mexico unlocks a surge of greenfield industrial projects. At the same time, cybersecurity directives and semiconductor volatility are lengthening lead times and lifting component costs, reinforcing the strategic value of integrated platforms that can de-risk deployment.
Key Report Takeaways
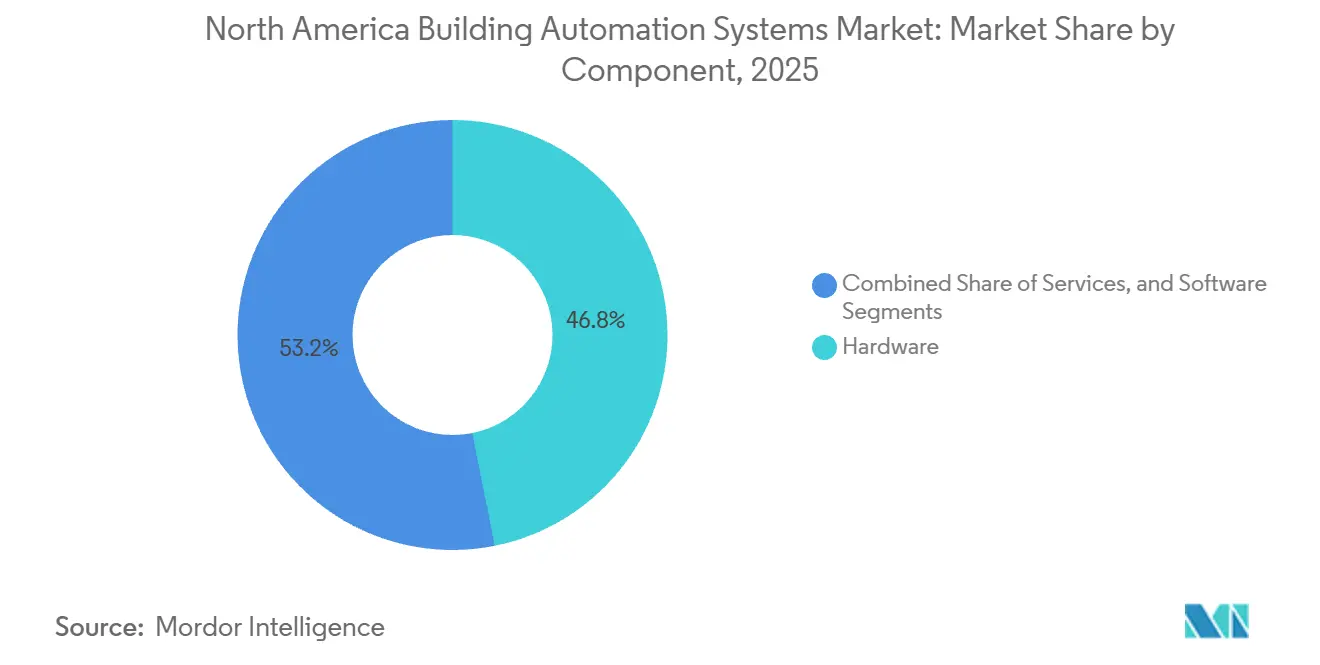
- By component, hardware led with 46.84% revenue share in 2025, while software is expanding at an 11.55% CAGR through 2031.
- By system type, heating, ventilation, and air conditioning control held 39.42% of the North America building automation systems market share in 2025, whereas energy management and analytics platforms are advancing at an 11.74% CAGR to 2031.
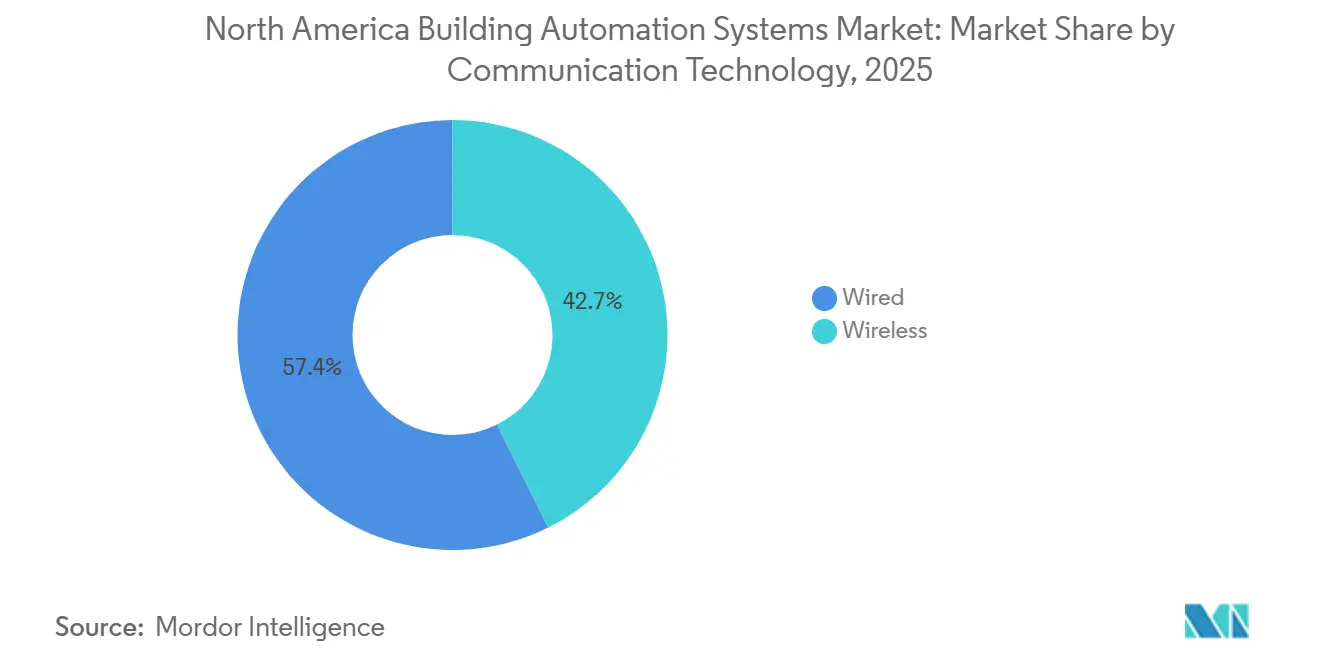
- By communication technology, wired infrastructure commanded 57.35% of the North America building automation systems market size in 2025, yet wireless protocols are projected to grow at an 11.46% CAGR.
- By end-user, commercial buildings accounted for 48.93% of spending in 2025, but industrial facilities are adopting automation at a 12.12% CAGR through 2031.
- By country, the United States captured 78.23% revenue share in 2025, while Mexico records the fastest growth at a 12.24% CAGR to 2031.
Note: Market size and forecast figures in this report are generated using Mordor Intelligence’s proprietary estimation framework, updated with the latest available data and insights as of January 2026.
Market Trends and Insights
Drivers Impact Analysis of North America Building Automation Systems Market*
| Driver | (~) % Impact on CAGR Forecast | Geographic Relevance | Impact Timeline |
|---|---|---|---|
| Adoption of AI Enabled Predictive Maintenance and Analytics | +2.1% | United States and Canada, early adoption in Mexico industrial corridors | Medium term (2-4 years) |
| Federal and State Incentives Accelerating Building Decarbonization | +1.9% | United States (California, New York, Washington), Canada federal programs | Short term (≤ 2 years) |
| Rapid Growth of Connected HVAC Retrofit Projects | +1.6% | North America, concentrated in commercial real estate hubs | Medium term (2-4 years) |
| Corporate ESG Commitments Driving Smart Building Investments | +1.4% | United States and Canada corporate portfolios, spillover to Mexico subsidiaries | Long term (≥ 4 years) |
| Move Toward Open Interoperable BACnet/IP and MQTT Protocols | +0.9% | North America, global standards adoption | Medium term (2-4 years) |
| Emerging Demand for Indoor Air Quality Monitoring Post-Pandemic | +0.8% | United States and Canada commercial and institutional sectors | Short term (≤ 2 years) |
| Source: Mordor Intelligence | |||
Adoption Of AI Enabled Predictive Maintenance And Analytics
Machine-learning models convert raw sensor feeds into early-warning diagnostics that predict equipment degradation three days ahead with 85% accuracy, cutting emergency repairs by 40% and lengthening asset life by 15%.[1] Subscription-based analytics platforms allow vendors to guarantee uptime, shifting revenue from one-time parts sales to performance contracts. A 2025 deployment across 1,200 buildings demonstrated that aggregated cloud data helps operators benchmark anomalies portfolio-wide, a task single-site analysis cannot match. Edge controllers embedding inference engines now execute algorithms locally, trimming latency to 50 milliseconds and reducing cloud bandwidth needs.
Federal And State Incentives Accelerating Building Decarbonization
The Inflation Reduction Act increased the Section 179D deduction to USD 5.00 per square foot for projects hitting 50% energy savings, halving simple payback from eight to four years.[2] New York City’s Local Law 97 fines USD 268 per tonne of CO₂-equivalent emissions above caps, converting automation into a compliance tool rather than a discretionary upgrade. California’s 2025 Title 24 update mandates fault detection on large HVAC systems, effectively making automation standard in 90% of new commercial installs. Combined carrots and sticks have compressed procurement cycles from 18 months to nine as owners race to secure incentives before the 2032 phase-down.[3]
Rapid Growth Of Connected HVAC Retrofit Projects
HVAC consumes 40% of commercial building electricity. Variable-frequency drives and smart thermostats synchronize output with occupancy and weather, eliminating 20%-30% waste. A 2025 portfolio retrofit cut peak demand charges by 22%, saving USD 180,000 annually across 500,000 square feet. Wireless overlay kits shorten installation from six weeks to ten days and slash labor costs by 35%. Utilities now pay USD 50 per kilowatt-year for demand response, transforming connected HVAC into a revenue generator.
Corporate ESG Commitments Driving Smart Building Investments
Institutional investors stewarding USD 130 trillion require portfolio companies to disclose Scope 1 and Scope 2 emissions. Buildings often represent half that footprint, making automation core to cost-of-capital discussions. Microsoft trimmed energy intensity 28% across 17 million square feet in 2025 after adding sub-metering and analytics. Green leases now oblige landlords to provide real-time dashboards, shifting ESG compliance risk to property managers. Class A adoption reached 75% in 2025, while Class B trailed at 40%.
Restraints Impact Analysis of North America Building Automation Systems Market*
| Restraint | (~) % Impact on CAGR Forecast | Geographic Relevance | Impact Timeline |
|---|---|---|---|
| High Upfront Retrofit Costs for Legacy Buildings | -1.2% | United States and Canada, concentrated in secondary markets with older building stock | Medium term (2-4 years) |
| Skilled Labor Shortage for BAS Integration and Cybersecurity | -0.9% | North America, acute in rural and secondary markets | Long term (≥ 4 years) |
| Rising Cyber-Security Compliance Costs | -0.7% | United States and Canada, regulatory pressure from CISA and NERC | Short term (≤ 2 years) |
| Semiconductor Supply Chain Volatility Impacting Controller Availability | -0.6% | North America, global supply dependencies | Short term (≤ 2 years) |
| Source: Mordor Intelligence | |||
High Upfront Retrofit Costs For Legacy Buildings
Comprehensive retrofits cost USD 2.50-USD 6.00 per square foot, pushing a 100,000 square-foot project to USD 250,000-USD 600,000. Smaller landlords face 7-10 year paybacks without rebates, exceeding the five-year hurdle typical of discretionary spending. Wireless kits trim labor by up to 40% but hardware still strains cash flow. On-bill, zero-interest utility financing reached 92% participation in a Seattle pilot, yet scaling needs regulatory approval that can take two years.
Skilled Labor Shortage For BAS Integration And Cybersecurity
Forty percent of automation technicians can retire by 2030, while training programs supply only two-thirds of replacements. Integration now demands IP networking and zero-trust security skills that traditional HVAC trades lack. Project schedules stretched 25% in 2025 and pushed revenue recognition into later quarters. Certified cybersecurity professionals bill USD 150-USD 250 per hour, raising commissioning costs. Vendors answer with remote diagnostics and augmented-reality tools that lift junior-tech productivity by 30%.
*Our forecasts treat driver/restraint impacts as directional, not additive. The impact forecasts reflect baseline growth, mix effects, and variable interactions.
North America Building Automation Systems Market Segment Analysis
By Component - Software Ascends As Analytics Monetize Data
Software grew 11.55% annually through 2031, outpacing hardware’s 46.84% of North America building automation systems market share in 2025 as cloud platforms convert device data into recurring fees. The building automation systems market size for software reached USD 1.2 billion at Johnson Controls alone in 2025, up 34% year over year. Owners favor opex contracts that avoid capital depreciation while scaling across portfolios. Hardware margins are tightening as commoditization pushes controller prices down by 8%-12% annually, prompting manufacturers to bundle devices with analytics subscriptions.
Edge computing blurs category lines. New controllers perform machine-learning inference locally, cutting latency from 500 milliseconds to 50 milliseconds and reducing outbound traffic. Service revenue pivots from break-fix calls to performance guarantees, commanding a 25% premium when vendors share savings. These shifts indicate that competitive advantage is migrating away from proprietary devices toward data ecosystems that improve algorithm accuracy with every additional building.

By System Type - Energy Management Platforms Outpace Legacy Controls
Energy management and analytics platforms are expanding at 11.74% a year, the fastest pace among system types. They forecast load a day ahead with 92% accuracy, enabling pre-cooling that avoids peak tariffs and trims utility bills by up to 25%. HVAC control retained 39.42% of the 2025 revenue share in the North America building automation systems market, yet its growth moderates as saturation rises in Class A offices. Lighting systems benefit from wireless commissioning tools that reduce installation time by 40% and lift retrofit viability.
Unified dashboards now link access control with HVAC zoning, eliminating energy waste from unoccupied areas. Fire and life-safety upgrades follow code mandates; the 2025 edition of NFPA 72 broadened networked detector requirements, growing the addressable retrofit pool by 18%. As utilities reward flexibility, PJM paid USD 85 per kilowatt-hour for demand response in 2025. Energy platforms unlock a new revenue stream, boosting returns by 300 basis points.
By Communication Technology - Wireless Gains As Retrofit Economics Improve
Wireless networks are rising at an 11.46% CAGR, narrowing the gap with wired systems that held 57.35% of revenue in 2025. Labor savings are decisive; avoiding conduit and cable pulls cuts total retrofit costs by up to 40%. Reliability fears recede as Zigbee and Bluetooth mesh deliver 99.9% uptime. Wired solutions still dominate new builds where deterministic latency below 10 milliseconds remains critical.
Hybrid architectures bridge both worlds. BACnet/IP over Wi-Fi 6 lets wireless sensors integrate with legacy trunks, enabling phased upgrades that protect sunk investments. Enhanced AES-256 encryption and certificate-based authentication meet federal cybersecurity guidance. Battery life is extending toward 10 years via energy harvesting, easing maintenance burdens.
By End-User - Industrial Facilities Accelerate Automation To Curb Energy Costs
Industrial users are the fastest adopters, growing 12.12% annually as plants consume three to five times more energy than offices. Predictive maintenance that detects motor bearing failure 48 hours in advance prevents downtime that can cost up to USD 250,000 an hour. Commercial properties still account for 48.93% of the North America building automation systems market share in 2025, supported by tenant experience features that boost lease renewal rates.
Residential penetration remains below 15% due to per-unit costs and privacy concerns, though smart thermostats saved households USD 180 in 2025. Institutional buildings must cut federal energy 30% by 2030, driving upgrades across 450 million square feet. K-12 districts redirect USD 120 per student in annual savings into instruction after automating HVAC.
Geography Analysis
Coastal United States Building Automation Systems Market
The United States dominates the building automation systems market with 78.23% of regional revenue in 2025, powered by a blend of federal tax credits and state mandates that reduce payback periods from eight to four years. Title 24 in California and Local Law 97 in New York City both require real-time diagnostics, turning automation into table stakes for compliance. Coastal markets account for 45% of national spending despite only 28% of floor area, underscoring how regulations direct capital.
Canada Building Automation Systems Market
Canada maintains mid-single-digit growth as a rising carbon price, set to reach CAD 170 per tonne (USD 125) by 2030, pushes owners to retrofit ahead of future tax liabilities. Provinces such as Ontario and British Columbia require 15% energy-intensity cuts for buildings above 50,000 square feet, effectively mandating automation for 70% of commercial stock in Toronto and Vancouver. Workforce shortages, especially in Alberta, extend project timelines by up to 30%.
Mexico Building Automation Systems Market
Mexico accelerates fastest at a 12.24% CAGR, buoyed by nearshoring that drew USD 1.3 billion in new automotive investment in 2025. Incentives that refund 30% of automation capital costs and the chance to design smart factories from the ground up lower total installed cost by 40% versus retrofits. Grid reliability remains a hurdle outside top metros, adding 10%-15% to project budgets for backup power, yet greenfield economics keep demand robust.
Regulatory Landscape
Regulation in North America is increasingly tying building performance outcomes to digital controls, which is pushing owners toward certified sequences, continuous monitoring, and auditable reporting. In the United States, the Inflation Reduction Act expanded the Section 179D deduction up to USD 5.00 per square foot for projects achieving 50% energy savings, while city and state requirements are raising the compliance value of BAS data. New York City requirements such as Local Law 84 (benchmarking) and Local Law 97 (carbon caps, with stated penalties of USD 268 per tonne of CO2e above caps in the report context) further increase demand for metering, analytics, and ongoing verification in buildings above 25,000 square feet.
California is a key regulatory anchor for controls, as the California Energy Commission (CEC) 2025 Energy Code (Title 24, Part 6) took effect on January 1, 2026, and includes requirements tied to certified control sequences for nonresidential HVAC systems. CEC Joint Appendix 18 (JA18) defines the certification pathway for Guideline 36-compliant control libraries, and Carrier Global Corporation was reported as holding the first CEC-certified control library certifications for i-Vu and WebCTRL as of February 20, 2026. Alongside energy-code enforcement, cybersecurity guidance and directives cited in the report context (including references to CISA and NERC pressure) are raising documentation and segmentation expectations for connected building systems, affecting procurement toward vendors and integrators with stronger secure-by-design implementations.
Value Chain Analysis
The value chain covers component suppliers (sensors, controllers, meters, networking), system OEMs and platform vendors, software and analytics providers, and a downstream layer of local and regional integrators that design, install, commission, and maintain BAS. Hardware remains the largest single revenue block in the report context (46.84% share in 2025), but commoditization and supply variability are shifting differentiation toward software, secure connectivity, and portfolio-level analytics. Standards and code-linked sequences (for example, CEC Title 24/JA18 control-library certification pathways) raise the importance of validated control logic, commissioning workflows, and documentation as part of delivered value, not just the devices.
Midstream, platform vendors such as Johnson Controls, Honeywell, Siemens, and Schneider Electric increasingly bundle devices with cloud subscriptions and managed services, using open interoperability (BACnet/IP and MQTT noted in the report context) to connect third-party subsystems. Downstream, integrators and facility service firms generate recurring revenue through monitoring, tuning, cybersecurity hardening, and performance-contract delivery, while remaining constrained by labor availability and specialized OT/IT security skills. Industry consolidation dynamics in the evidence pack, including platform strategies and buy-and-build rollups among installers, are reshaping channel power as larger groups can offer multi-site standardization, remote operations, and compliance-ready reporting across commercial, industrial, and institutional portfolios.
Competitive Landscape
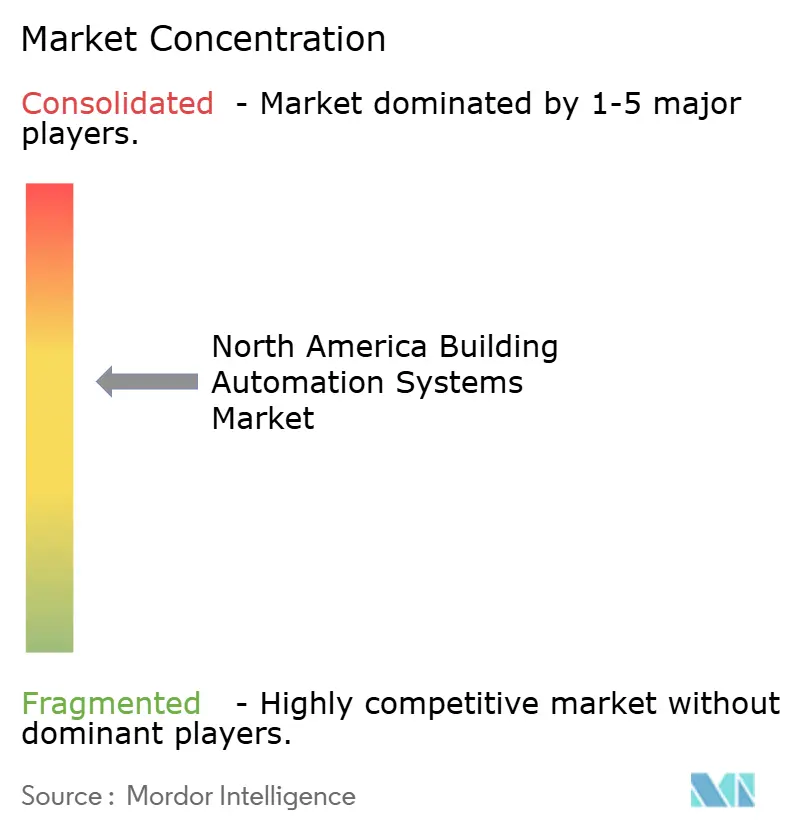
The top five suppliers control roughly 45% of revenue, while installation and service remain fragmented among local integrators. Platform leaders such as Johnson Controls, Honeywell, and Siemens are buying software specialists to fold predictive analytics into legacy hardware, lifting subscription revenue. Schneider Electric leverages its electrical distribution footprint to win industrial projects that prefer single-vendor accountability. Open-protocol proponents like Distech Controls and Delta Controls chipped away at incumbent share in 2025 by offering BACnet/IP products priced 25% below proprietary systems.
Cybersecurity has emerged as a differentiator. Vendors capable of segmenting operational technology from IT networks under zero-trust rules win specifications in finance and healthcare. Carrier Global embeds AI in rooftop units to cut install costs by 30% and target 12 million aging units due for replacement by 2030.
Patent filings in edge computing and wireless mesh rose 40% in 2024, signaling industry focus on retrofit-friendly innovation. Ultimately, firms that build data network effects, where each additional building improves algorithmic accuracy, will capture outsized margins and resist commoditization.
North America Building Automation Systems Industry Leaders
-
Honeywell International Inc.
-
Johnson Control International PLC
-
Siemens AG
-
Schneider Electric SE
-
Greenwave Systems Inc.
- *Disclaimer: Major Players sorted in no particular order
North America Building Automation Systems Market Companies Covered in this Report
- Johnson Controls International PLC
- Honeywell International Inc.
- Siemens AG
- Schneider Electric SE
- Greenwave Systems Inc.
- Uplight Inc.
- Panasonic Holdings Corporation
- ABB Ltd.
- Carrier Global Corporation
- Trane Technologies plc
- Rockwell Automation Inc.
- Legrand SA
- Lutron Electronics Co. Inc.
- Cisco Systems Inc.
- Delta Controls Inc.
- Distech Controls Inc.
- Emerson Electric Co.
- Crestron Electronics Inc.
- Hubbell Incorporated
Read Analysis of North America Building Automation Systems Companies
Market Opportunities and Future Outlook
One major opportunity is compliance-grade controls and verification tied to building codes and city mandates, especially where certified sequences and reporting are required. California Energy Commission Title 24 (effective January 1, 2026) and the JA18 pathway for Guideline 36-compliant control libraries create room for vendors and integrators that can deliver certified sequences, faster commissioning, and measurable outcomes in nonresidential HVAC retrofits. Carrier Global Corporation being reported as holding early JA18 certifications for i-Vu and WebCTRL as of February 20, 2026 shows how product roadmaps and go-to-market activity are aligning with code-driven sequence validation.
A second opportunity area is AI-enabled optimization, autonomous operations, and horizontal software platforms that aggregate data across HVAC, security, and energy systems to support recurring services revenue. Johnson Controls acquisition of Nantum AI (April 2026) and Honeywell initiatives around AI-driven building management and autonomous operations (including its collaboration with TCS) point to ongoing investment in software capabilities that support fault detection, continuous commissioning, and energy optimization at scale. Grid-interactive buildings also create monetization pathways by coordinating HVAC load modulation and, where applicable, storage integration for demand response, which supports demand for energy management and analytics platforms that connect building operations to utility programs while meeting cybersecurity and auditability requirements.
Recent Industry Developments in North America Building Automation Systems Market
- June 2026: Johnson Controls launches Metasys 16.0 building automation system. The launch enhances the BAS platform with AI assisted fault resolution. Strengthens OpenBlue integration and uptime resilience; expands software revenue.
- June 2026: Prolon Controls completes wireless HVAC modernization project at Tulsa Boys' Home. Demonstrates retrofit wireless BAS deployment in North America. Supports growing demand for wired to wireless modernization in existing facilities.
- April 2026: Johnson Controls acquires Nantum AI to add AI driven algorithms to OpenBlue ecosystem. Adds AI powered analytics to BAS portfolio. Deepens analytics capability and cross sell opportunities within OpenBlue customer base.
North America Building Automation Systems Market Report Scope and Research Methodology
Market Definition and Coverage
For this study, the market is defined as revenues earned from building automation systems used to monitor, control, and optimize building functions across North America, covering equipment, software, and related services delivered for buildings.
Scope exclusions: standalone consumer smart home gadgets that are not part of an integrated building control system, along with general construction spend that is not tied to automation hardware, software, or services, are excluded.
Segments Covered in This Report
- By Component
- Hardware
- Software
- Services
- By System Type
- HVAC Control Systems
- Lighting Control Systems
- Security and Access Control Systems
- Energy Management and Analytics Platforms
- Fire and Life Safety Systems
- By Communication Technology
- Wired
- Wireless
- By End-User
- Residential
- Commercial
- Industrial
- Institutional / Government
- By Country
- United States
- Canada
- Mexico
Data Sources, Market Sizing, and Validation
Desk Research
Desk research starts with understanding the real demand pool for automation in North America, and then tying it to measurable signals. We reviewed public energy and building data and guidance, such as U.S. Energy Information Administration data, U.S. Department of Energy efficiency programs, ASHRAE standards references, and Canada energy code and efficiency publications, which help anchor likely control and retrofit needs.
To avoid relying on one type of indicator, we also used sources such as US Census construction and building stock indicators, trade and customs statistics for related equipment flows, and patents and technical publications that show adoption direction for protocols and controls. These inputs were complemented with company filings, investor presentations, and reputable press coverage for project activity and pricing context, plus selective paid subscriptions for company financial intelligence and patent databases. The desk research sources listed here are illustrative, and we also used other public and paid references for data collection, cross-checks, and clarification.
Primary Interviews and Surveys
Primary work was used to pressure test the sizing logic in plain terms, including how often HVAC control is bundled with lighting or security, what typically gets counted as services, and what pricing changes feel realistic for retrofits versus new builds. We spoke with a mix of system integrators, channel participants, building owners and operators, and technical decision makers to validate adoption pace, average project scope, and replacement cycles across the US, Canada, and Mexico.
Because building automation demand can shift by building type and local energy rules, we balanced regional coverage across major metro areas and high retrofit states and provinces. We then checked the results against views from industrial and institutional facilities to make sure the service mix and scope assumptions stayed consistent.
Distribution of primary research fieldwork respondents
| Company type | Respondent position |
|---|---|
| Top tier: 29% | CXOs: 13% |
| Mid tier: 57% | Functional/Unit leaders: 33% |
| Smaller Players: 14% | Managers: 54% |
Market-Sizing & Forecasting
Sizing is built using a mixed approach, where a top-down demand pool is first reconstructed from building activity and automation penetration signals, and then checked with selective bottom-up roll ups to keep outputs realistic. On the top-down side, the model uses practical indicators like commercial and institutional building additions and retrofit activity, HVAC equipment replacement cycles, energy code and efficiency program triggers, and the typical share of projects that include controls, sensors, and software.
Those totals are then corroborated using bottom-up approximations, including sampled project values from integrator feedback, typical controller and sensor pricing ranges, and channel checks on service attachment rates. Adjustments are made for double counting risks across components. When data is missing for a smaller country or a niche end user, gaps are handled by using proxy ratios from similar building categories, then validating them with interview feedback.
For forecasting, scenario analysis is used to reflect different retrofit funding and construction cycles, and it is supported with variable-level views from experts on how fast wireless adoption, cloud management, and cybersecurity requirements are changing project scopes. The forecast also reflects realistic price movement assumptions for hardware, along with a steadier, higher attachment rate trend for software and services.
Data Validation & Update Cycle
Outputs are validated through multiple checks so that unexpected spikes or drops are questioned before sign-off. We compare the model results against independent demand signals, such as building construction and retrofit indicators, energy efficiency program activity, and observed shifts in component mix. When anomalies appear, we review the drivers and recalculate if assumptions do not align.
A second analyst review is completed to recheck calculations, definitions, and boundary conditions. Targeted re-contacts with interviewees are then done when a variance crosses a set internal tolerance. Reports are refreshed annually, and interim updates are made when material events impact demand, pricing, or regulation. Before delivery, a fresh pass is completed so clients receive the latest updated view based on the most recent data available.
Mordor Intelligence's North America Building Automation Systems Market Size Measured Against Other Published Estimates
Published market sizes for North America building automation systems often differ because the scope lines are drawn differently, and because each model uses its own view on what counts as a system sale versus adjacent smart building spend. Differences also show up when some estimates mix global and regional inputs, or when they rely on older exchange rate timing and keep assumptions unchanged for too long.
Permit and retrofit activity checks, along with component mix validation from integrator channel feedback, are evidence points that keep Mordor Intelligence tied to a North America only revenue pool that counts hardware, software, and services without folding in unrelated building energy spend. Other published numbers can move away from this if they include broader smart home devices, count non-automation building management services, or apply aggressive price uplift assumptions without reconfirming typical project scope each year.
Benchmark comparison
| Source | Market Size | Gaps in Research Methodology |
|---|---|---|
| Mordor Intelligence | USD 76.57 B (2026) | |
| Trade Journal A | USD 60.20 B (2026) | Often undercounts services by treating commissioning and ongoing monitoring as optional add-ons, and it may exclude smaller retrofit projects that are bundled through facilities budgets rather than booked as automation programs. |
| Regional Consultancy B | USD 92.40 B (2026) | Tends to include adjacent smart building spend, such as broader energy management consulting and some non-integrated devices, and it can apply faster ASP expansion assumptions without rechecking project-level scope changes across the US, Canada, and Mexico. |
The spread mainly comes from what is included around the core automation system and how services and software are treated in project economics. By keeping the scope tied to measurable building activity signals and then validating with channel and end user feedback, the estimate stays traceable to repeatable inputs rather than broad umbrella categories.
Key Questions Answered in the Report
How large will North America’s building automation systems market be by 2031?
It is projected to reach USD 128.93 billion by 2031, up from USD 76.57 billion in 2026.
Which segment is growing fastest within the market?
Energy management and analytics platforms are advancing at an 11.74% CAGR through 2031.
Why are industrial facilities accelerating adoption?
Plants consume three to five times more energy than offices, so predictive maintenance and load optimization deliver rapid cost savings.
What role do federal incentives play?
The Section 179D tax deduction of up to USD 5.00 per square foot and state carbon penalties cut paybacks in half, making automation a compliance priority.
How is wireless technology affecting retrofit economics?
Eliminating conduit and cabling reduces installation labor up to 60%, lowering total retrofit costs by as much as 40%.
What is the main hurdle for smaller landlords?
Upfront retrofit costs of USD 2.50-USD 6.00 per square foot extend paybacks beyond the five-year threshold many owners require.