
Market Overview
| Study Period | 2021 - 2031 |
|---|---|
| Forecast Data Period | 2026 - 2031 |
| Base Year Market Size (2025) | USD 34.67 Billion |
| Market Size (2026) | USD 38.90 Billion |
| Market Size (2031) | USD 74.08 Billion |
| Growth Rate (2026 - 2031) | 13.75 % |
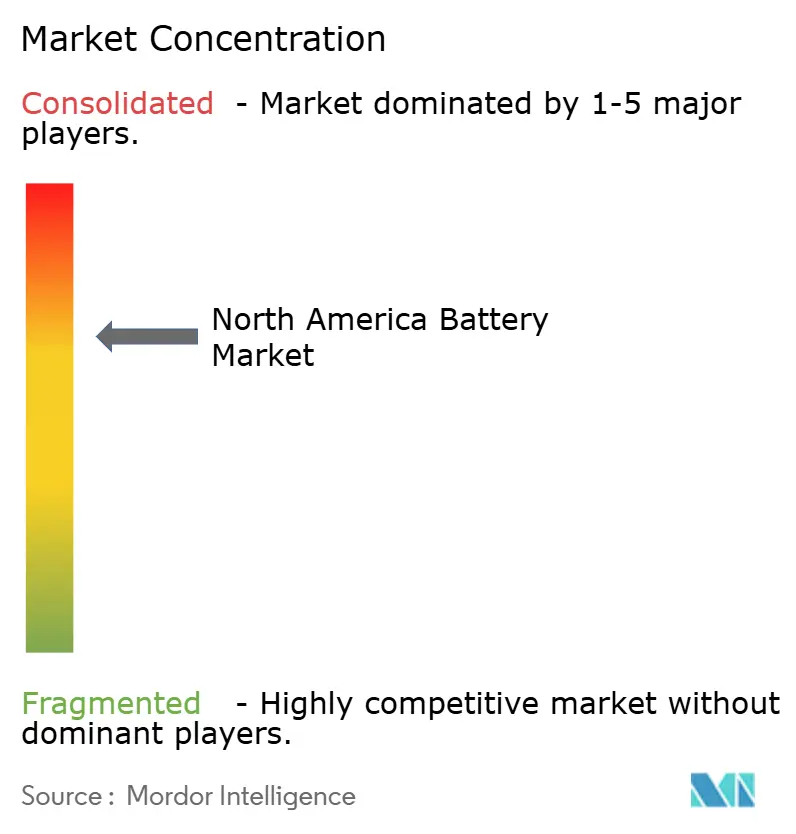
| Market Concentration | Medium |
Major Players *Disclaimer: Major Players sorted in no particular order Image © Mordor Intelligence. Reuse requires attribution under CC BY 4.0. | |
North America Battery Market Analysis by Mordor Intelligence
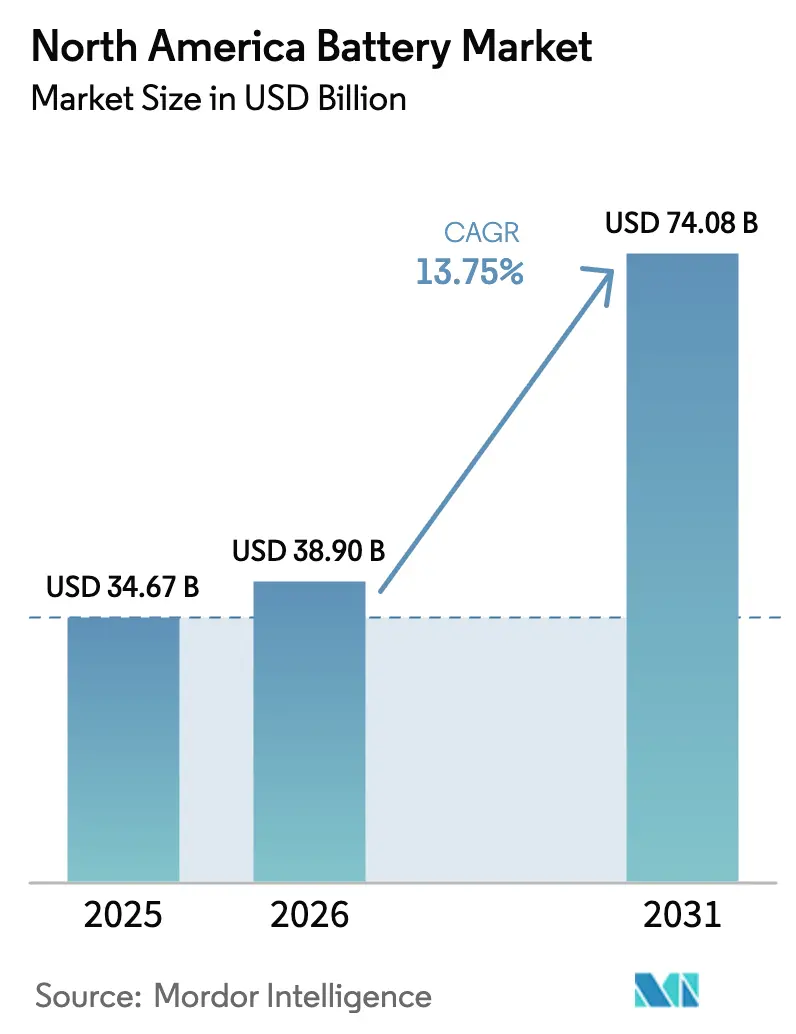
The North America Battery Market size is projected to be USD 34.67 billion in 2025, USD 38.90 billion in 2026, and reach USD 74.08 billion by 2031, growing at a CAGR of 13.75% from 2026 to 2031.
Federal production tax credits, state-level storage mandates, and fast-growing electric-vehicle (EV) demand are compressing pack costs, widening addressable use cases, and accelerating capacity additions across the region. Automotive electrification, especially in the light-duty truck and SUV segments that require packs exceeding 100 kilowatt-hours, is pulling forward gigafactory investments and anchoring multiyear supply agreements between automakers and cell manufacturers. At the same time, utility-scale storage targets in California, New York, Texas, and British Columbia are establishing a predictable offtake floor that de-risks financing for new entrants.[1] Technology differentiation is shifting from cost to performance as solid-state, silicon-anode, and sodium-ion chemistries move from pilot to early commercial scale, expanding the innovation frontier while intensifying competition for skilled labor and critical-material supply.
Key Report Takeaways
- By battery type, secondary rechargeable batteries held 75.5% of the North American battery market share in 2025, while their 15.5% CAGR through 2031 positions them as the fastest-growing battery-type segment.
- By technology, lithium-ion technology captured 60.2% of 2025 revenue, yet solid-state cells are forecast to post a 35.8% CAGR, the quickest rate within the technology landscape.
- By application, automotive applications commanded 46.9% of 2025 demand and are projected to expand at a 19.7% CAGR, outpacing all other end uses.
- By geography, the United States accounted for 73.8% of 2025 revenue, whereas Mexico is set to climb at a 28.6% CAGR, the fastest among North American geographies.
Note: Market size and forecast figures in this report are generated using Mordor Intelligence’s proprietary estimation framework, updated with the latest available data and insights as of January 2026.
Market Trends and Insights
Drivers Impact Analysis of North America Battery Market*
| Driver | (~) % Impact on CAGR Forecast | Geographic Relevance | Impact Timeline |
|---|---|---|---|
| IRA-fuelled gigafactory build-out compressing pack costs | 3.8% | United States, with spillover to Canada and Mexico | Medium term (2-4 years) |
| On-shoring incentives reducing supply-chain risk for OEMs | 2.7% | United States and Canada, concentrated in Michigan, Ontario, Tennessee, Kentucky | Medium term (2-4 years) |
| Utility-scale storage mandates in CA, NY, TX, BC | 1.9% | California, New York, Texas, British Columbia | Short term (≤2 years) |
| Emerging automaker-battery-maker JVs unlocking capital efficiency | 1.6% | United States and Canada, particularly in EV manufacturing hubs | Medium term (2-4 years) |
| EV-driven average battery size increase (SUV mix) creating volume pull | 2.4% | United States and Canada, driven by consumer preference for larger vehicles | Long term (≥4 years) |
| Recycling tax credits lowering end-of-life costs | 0.9% | United States, with early adoption in Nevada, Georgia, and Ohio | Long term (≥4 years) |
| Source: Mordor Intelligence | |||
IRA-Fuelled Gigafactory Build-Out Compressing Pack Costs
Section 45X of the Inflation Reduction Act (IRA) provides USD 35 per kilowatt-hour for cells and USD 10 per kilowatt-hour for modules manufactured domestically, a structure that triggered USD 110 billion of announced battery investments across 13 states since 2022.[2] BlueOval SK secured a USD 9.6 billion Department of Energy loan for twin plants in Kentucky and Tennessee, with the first line online in late 2025. Panasonic ramped its De Soto, Kansas, facility to 30 gigawatt-hours in 2025, while Samsung SDI and General Motors broke ground on an Indiana site targeting a 2026 start-up. These projects lower the breakeven utilization threshold from 80% to 60%, accelerating commissioning schedules and enabling a forecast 40% pack-cost decline from 2022 to 2027. As costs fall, total-cost-of-ownership parity between EVs and internal-combustion vehicles is expected as early as 2027, a full two years earlier than many OEMs originally modeled.
On-Shoring Incentives Reducing Supply-Chain Risk for OEMs
Automakers absorbed USD 2.3 billion of extra logistics costs during the 2021–2022 semiconductor crunch, prompting a pivot toward regional cell production that mitigates shipping disruptions and tariff exposure. The IRA’s Foreign Entity of Concern provisions, effective January 2024, disqualify EVs from a USD 7,500 consumer credit if batteries or critical minerals come from Chinese or Russian entities, driving supplier re-mapping. Ultium Cells now runs three U.S. plants totaling 140 gigawatt-hours, trimming cell lead times from 12 to 4 weeks and lowering working-capital needs by about 20%. Stellantis and Samsung SDI followed with a USD 7.3 billion Kokomo facility that secures supply for full-size pickups. Together, these vertically integrated models insulate OEM programs from foreign-exchange swings and logistics bottlenecks, protecting margins during the EV ramp.
Utility-Scale Storage Mandates in CA, NY, TX, BC
California requires 11.5 gigawatts of incremental storage by 2026 and another 15 gigawatts by 2030, spurring record interconnection requests for lithium-ion projects. New York’s Climate Leadership and Community Protection Act targets 6 gigawatts of storage by 2030, backed by a USD 400 million incentive pot launched in 2024. ERCOT added 4.2 gigawatts of batteries in 2024, the largest single-year gain nationwide, as merchants arbitraged peak-price spreads. British Columbia’s CleanBC blueprint seeks 3 gigawatts by 2030, with BC Hydro issuing 1.5 gigawatts of 2025 RFPs. These mandates underpin multiyear offtake contracts that cut project financing costs by 100–150 basis points and create a demand floor independent of EV adoption trajectories.
EV-Driven Average Battery Size Increase (SUV Mix)
Average North American pack size jumped from 62 kilowatt-hours in 2022 to 78 kilowatt-hours in 2025 as consumers gravitated toward electric SUVs and pickups.[3] The Ford F-150 Lightning, Chevrolet Silverado EV, and Rivian R1T each deploy packs exceeding 130 kilowatt-hours, magnifying cell demand beyond unit-sales growth. A 1% rise in EV penetration now equates to a 1.3% uptick in gigawatt-hour demand, compressing timelines for new-build gigafactory absorption. Cell-to-pack architectures that remove module housings cut part counts by 30% and lift energy density by up to 15%, a design shift favoring vertically integrated OEMs capable of co-engineering cells and structural enclosures. Higher average pack capacities are therefore both a volume and technology catalyst, reinforcing learning-curve cost declines.
Restraints Impact Analysis of North America Battery Market*
| Restraint | (~) % Impact on CAGR Forecast | Geographic Relevance | Impact Timeline |
|---|---|---|---|
| Mid-stream bottlenecks (foil, separator) delay ramp-ups | -1.8% | United States and Canada, affecting new gigafactory commissioning timelines | Short term (≤2 years) |
| Lithium-price volatility widening project IRR band | -1.3% | North America-wide, with heightened exposure in projects reliant on spot-market procurement | Medium term (2-4 years) |
| Tariff uncertainty on Chinese LFP imports | -1.1% | United States, particularly impacting utility-scale ESS and entry-level EV segments | Short term (≤2 years) |
| Skilled-labour shortages at new cell plants | -0.9% | United States and Canada, concentrated in emerging battery-belt states (Kentucky, Tennessee, Georgia, Kansas) | Medium term (2-4 years) |
| Source: Mordor Intelligence | |||
Lithium-Price Volatility Widening Project IRR Band
Spot lithium-carbonate prices plunged from USD 80,000 per metric ton in late 2022 to USD 12,000 by June 2024 before rebounding to USD 15,000 by December, a roller-coaster that injected a 12%–15% spread into battery-pack economics. General Motors’ Thacker Pass joint venture aims to secure 40,000 metric tons annually by 2027, shielding 800,000 vehicles per year from spot swings. Yet project IRRs remain highly sensitive; sustained prices below USD 18,000 could extend paybacks beyond 10 years, delaying bank financing for mid-tier cell manufacturers. Smaller firms lacking captive lithium struggle to hit the 80% offtake threshold demanded by lenders, throttling greenfield builds and weighing on near-term capacity additions.
Mid-Stream Bottlenecks (Foil, Separator) Delay Ramp-Ups
Separator film and copper foil constitute 15%-20% of a cell’s bill of materials, but over 70% of global separator capacity sits with three Asian suppliers, leaving new North American lines vulnerable to shortages.[4] Gigafactories that started in 2024 experienced 3- to 6-month qualification delays, pushing revenue ramp-ups into 2026. U.S. copper-foil capacity covered only 150 gigawatt-hours of annual demand in 2024 versus 1,100 gigawatt-hours of announced cell capacity by 2030, forcing OEMs to dual-source from Asia and accept longer lead times. SK Nexilis’ 30,000-metric-ton Kentucky plant, due 2027, will address just a slice of the deficit. Until mid-stream supply expands, gigafactory commissioning schedules remain a gating factor for the North America battery market outlook.
*Our forecasts treat driver/restraint impacts as directional, not additive. The impact forecasts reflect baseline growth, mix effects, and variable interactions.
North America Battery Market Segment Analysis
By Battery Type:
Rechargeable Dominance AcceleratesSecondary rechargeable batteries accounted for 75.5% of the North America battery market share in 2025 and are projected to expand at a 15.5% CAGR to 2031. This growth trajectory reflects surging EV and stationary-storage deployments, both of which require high cycle life and multi-year warranties that favor lithium-ion chemistries. Average pack sizes in electric trucks rose to 78 kilowatt-hours in 2025, lifting cell demand per vehicle and hastening gigafactory utilization ramps. Primary cells, at 24.5% of revenue, grow at single-digit rates, limited to medical, defense, and IoT niches where multi-decade shelf life outweighs rechargeability. Consolidation trends differ by sub-segment; Duracell and Energizer maintain brand pull in consumer alkaline, whereas automotive OEMs increasingly insource lithium-ion, compressing margins for independent suppliers.
Unit economics are also diverging. Tesla’s internal 4680 line hit a 10 gigawatt-hour run rate by September 2025, reducing per-kilowatt-hour costs 15% versus externally sourced 2170 cells and capturing upstream value that previously accrued to vendors. Small primary-battery suppliers benefited from a 12% rise in Department of Defense procurement in 2024, highlighting how performance-critical niches can still yield steady margins despite slower volume growth. Overall, rechargeable capacity additions and associated learning-curve cost declines are locked in as the principal engine of the North America battery market through 2031.
By Technology:
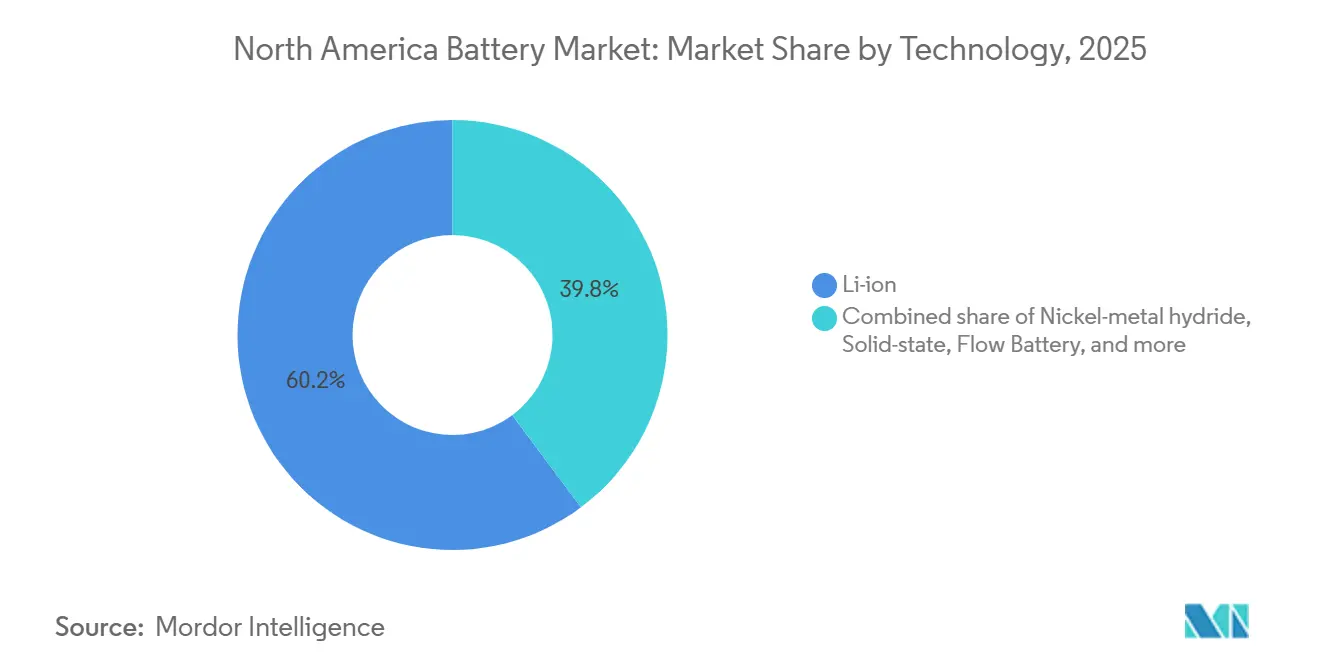
Solid-State Gains Outpace Lithium-IonLithium-ion retained 60.2% of 2025 revenue, underpinned by established NMC and LFP chemistries that combine cost competitiveness with automotive-grade safety. Solid-state cells, while representing less than 1% of shipments, are on course for a 35.8% CAGR as pilot lines scale and OEMs chase 400 watt-hour-per-kilogram energy densities. Lead-acid, still critical for starting-lighting-ignition, slipped below 25% as EVs erode the internal-combustion vehicle base and data centers pivot to lithium-ion UPS systems.
QuantumScape and Volkswagen’s PowerCo finalized a licensing pact in April 2025, aiming for initial solid-state deliveries in 2026, signaling readiness for limited commercial adoption. Sodium-ion cells from Natron Energy entered production in Michigan to serve stationary UPS and material-handling use cases where energy density is secondary to cost and cycle life. Flow and lithium-sulfur variants remain restricted to demonstration projects given current cost-per-cycle disadvantages, but continued R&D investment keeps them on the long-term radar for grid storage applications.

By Application:
Automotive Segment Drives VolumeAutomotive batteries captured 46.9% of 2025 revenue and are forecast to grow 19.7% annually to 2031, cementing their role as the principal volume driver for the North America battery market. Pickup- and SUV-heavy model mixes push pack capacities above 100 kilowatt-hours, magnifying the gigawatt-hour impact of each new EV launch. Industrial stationary storage, at roughly 30% of revenue, posts mid-teen growth as data centers, telecoms, and utilities replace lead-acid and gas peakers with lithium-ion systems that cut operating costs by up to 50%. Portable consumer electronics and power tools hold a 15% share, with cordless tool electrification offsetting slower smartphone replacement cycles.
SLI batteries, now below an 8% share, decline slowly as the regional fleet transitions to EVs. Clarios is repositioning with 12-volt lithium-ion packs for EV auxiliaries, a nascent but strategic hedge against diminishing lead-acid demand. Co-location strategies, such as Ultium Cells’ Spring Hill site, only 5 miles from GM’s truck line, underscore how logistics optimization and just-in-time delivery are now as critical as chemistry advances for competitive advantage.
Geography Analysis
United States Battery Market
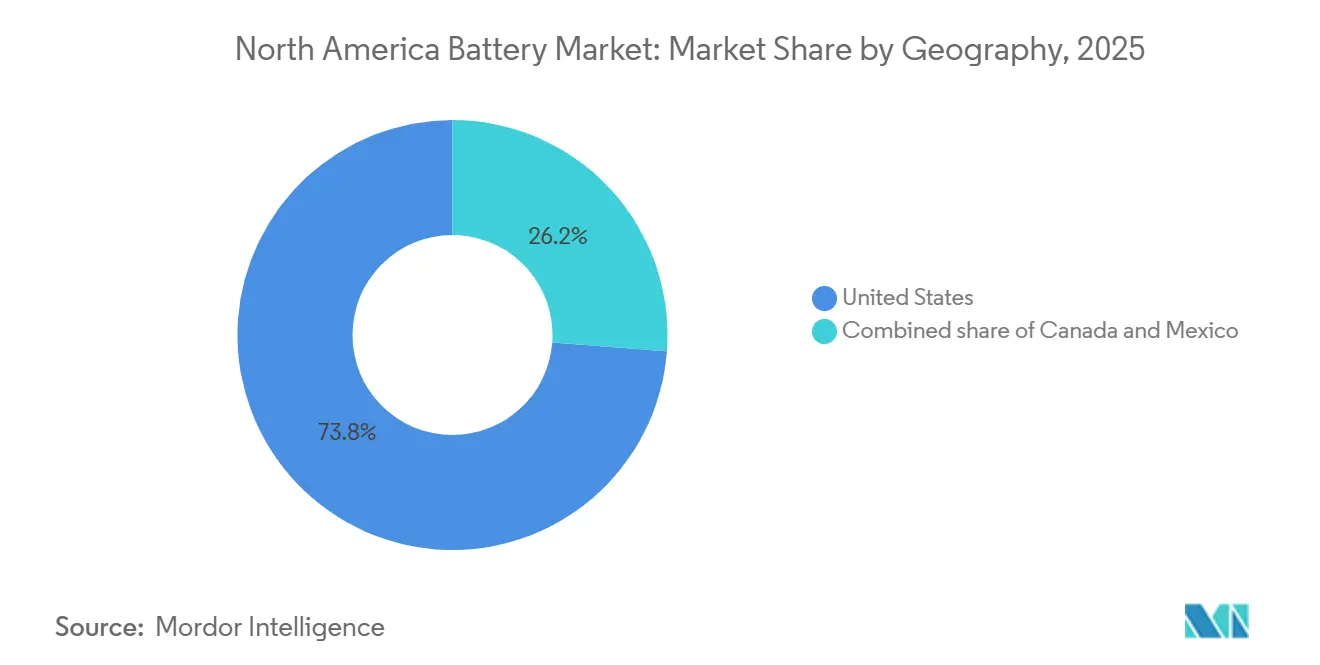
The United States generated 73.8% of 2025 revenue, powered by more than USD 110 billion of post-IRA cell-plant announcements and aggressive state storage mandates. Loan Programs Office commitments totaling USD 18 billion cut weighted-average costs of capital by up to 200 basis points, tipping numerous projects from “proposed” to “under construction.” California, New York, and Texas alone accounted for 60% of 2024 stationary storage deployments, reflecting how policy targets translate directly into near-term volume.
Canada Battery Market
Canada contributed roughly 15% of regional revenue, with Ontario and Quebec capturing the bulk via CAD 15 billion of combined incentives that attracted Stellantis, LG Energy Solution, and Volkswagen gigafactories scheduled to come online between 2025 and 2027. Upstream mineral strength anchors cathode-precursor projects, shortening supply lines for nickel and cobalt and reinforcing the nation’s strategic role in the North America battery market size calculus.
Mexico Battery Market
Mexico is growing quickest at a 28.6% CAGR, leveraging USMCA trade rules and lower labor costs to attract both automakers and mid-stream suppliers. Tesla’s Monterrey gigafactory and BYD’s site scouting in Nuevo León signal that announced capacity could quintuple to 50 gigawatt-hours by 2030 if water, electricity, and skilled-labor hurdles are resolved. Component makers—from separator film to electrolytes—are co-locating, mirroring the broader automotive supply-chain migration that has unfolded since the mid-1990s.
Regulatory Landscape
In the United States, federal policy continues to influence battery manufacturing localization and product compliance. The Inflation Reduction Act incentives (including Section 45X advanced manufacturing credits referenced throughout the market) and related eligibility rules are reinforced by federal guidance and funding programs, while NHTSA safety requirements have been updated through FMVSS No. 305a for electric-powered vehicles (effective February 2025, 49 CFR 571.305a), which aligns U.S. crash-safety performance expectations for propulsion batteries with international frameworks.
Regulatory requirements are also broadening beyond in-vehicle safety into end-of-life stewardship and consumer safety. California's Responsible Battery Recycling Act sets a timetable for higher recycling performance requirements (including a 60% minimum recycling efficiency rate for rechargeable batteries effective January 2027), adding state-level compliance obligations for producers alongside federal battery recycling best-practices direction in U.S. Code (Title 42). In Canada, Health Canada has consulted on proposed new requirements for products containing lithium-ion batteries under the Canada Consumer Product Safety Act, indicating tighter expectations for safety and incident prevention in consumer-facing battery-containing products across North America.
Competitive Landscape
The top five suppliers, LG Energy Solution, Panasonic Energy, SK On, Samsung SDI, and Tesla, controlled about 60% of lithium-ion cell capacity in 2025, giving the North America battery market a moderate concentration profile. Joint-venture structures dominate capacity additions, allowing OEMs to secure supply while sharing capital burdens; Ultium Cells’ 140-gigawatt-hour U.S. footprint exemplifies this model. Vertical integration is accelerating: Tesla’s 4680 line reached a 10 gigawatt-hour run rate in 2025, and Ford plans to internalize LFP technology under a CATL license in Michigan by 2026, moves that could further redistribute margin pools.
White-space opportunities are surfacing in solid-state, sodium-ion, and recycling. QuantumScape raised USD 300 million from Volkswagen to co-develop production processes, while Redwood Materials secured a USD 2 billion DOE loan to upscale recycled-cathode output to 500 gigawatt-hours by 2028. Incumbent lead-acid players such as EnerSys are launching lithium-ion product lines to retain industrial customers transitioning away from legacy chemistries. Regulatory compliance with Foreign Entity of Concern rules is also reshaping supply decisions, steering automakers toward U.S. or allied-nation facilities and prompting Chinese firms to consider licensing or local joint ventures to preserve North American market access.
North America Battery Industry Leaders
-
LG Energy Solution
-
Panasonic Energy
-
Tesla (Internal)
-
Samsung SDI
-
SK On
- *Disclaimer: Major Players sorted in no particular order
North America Battery Market Companies Covered in this Report
- LG Energy Solution
- Panasonic Energy Co.
- Tesla (Internal Cell Ops)
- Samsung SDI
- SK On
- BYD Co. Ltd.
- CATL
- Enersys
- Saft Groupe SA
- Duracell Inc.
- Johnson Controls Intl.
- Clarios
- Northvolt AB
- AESC (Envision)
- EVE Energy NA
- American Battery Factory
- Natron Energy
- 24M Technologies
- FREYR Battery
- Lyten Inc.
- BlueOval SK
Market Opportunities and Future Outlook
Near-term opportunity centers on expanding domestic midstream build-out, especially critical mineral and material processing, coated electrodes, and recycling, as these areas directly address commissioning bottlenecks and domestic-content driven sourcing needs. The U.S. Department of Energy launched a USD 500 million Notice of Funding Opportunity in 2026 focused on strengthening domestic critical materials processing and related battery manufacturing and recycling capacity, with program structures that favor commercial-scale facilities and meaningful expansions. This creates a tangible financing pathway for projects that address separator, foil, and active-material gaps reflected in current ramp delays.
A second opportunity is the pull from stationary storage and data-center power infrastructure, which is shifting where capacity and chemistry investments are directed. Panasonic's public plan to convert its Kansas battery facility to serve data center applications and Toyota's start of battery production at Liberty, North Carolina, show how OEM and tier-1 investments are being paired with industrial offtake needs beyond light-duty EVs. That mix supports whitespace for LFP-focused domestic supply chains, grid-scale integrators, and recycling-linked cathode precursor capacity that can contract directly with utilities, merchants, and large-load customers while aligning with policy-linked localization incentives.
Recent Industry Developments in North America Battery Market
- July 2026: Honda and LG Energy Solution's joint venture began ESS cell production at its retooled Ohio facility. The shift from an EV-oriented footprint toward stationary storage output highlights how manufacturers are reallocating North American capacity to serve utility and large-load customers alongside automotive demand.
- May 2026: LG Energy Solution Vertech announced a USD 1.6 billion agreement with DTE Energy to supply 6 GWh of battery energy storage systems for eight grid projects in Michigan over two years. The contract provides bankable, multi-project offtake that supports scale-up of locally sourced ESS supply and ties battery deployments to grid modernization and major load growth in the state.
- March 2026: Reuters reported U.S. government confirmation of Tesla and LG Energy Solution's USD 4.3 billion LFP battery supply deal tied to Megapack systems, with cells planned from a Lansing, Michigan facility starting in 2027. This agreement deepens domestic LFP localization for stationary storage and strengthens vertically integrated procurement around U.S. manufacturing to reduce tariff and logistics exposure.
North America Battery Market Report Scope and Research Methodology
Market Definition and Coverage
For this methodology, the North America battery market is measured as the revenue generated from batteries sold into end uses across the United States, Canada, and Mexico, covering common primary and secondary battery technologies used in transport, industry, and consumer devices.
Scope exclusions: This sizing excludes adjacent power electronics and charging equipment, along with downstream services such as installation, maintenance, and recycling.
Segments Covered in This Report
- By Battery Type
- Primary Batteries
- Secondary Batteries
- By Technology
- Lead-acid
- Li-ion
- Nickel-metal hydride
- Nickel-cadmium
- Sodium-sulfur
- Solid-state
- Flow Battery
- Emerging chemistries
- By Application
- Automotive (HEV, PHEV, and EV)
- Industrial (Motive, Stationary (Telecom, UPS, ESS), etc.)
- Portable (Consumer Electronics, etc.)
- Power Tools
- SLI
- Other Applications
- By Geography
- United States
- Canada
- Mexico
Data Sources, Market Sizing, and Validation
Desk Research
Desk work was used to anchor the model on real demand signals and supply indicators, before forecasting assumptions were applied. We mainly referenced public sources such as USGS mineral and materials statistics, the US Energy Information Administration for energy storage and power-sector context, the US International Trade Commission trade data, and government transport datasets such as the US Department of Transportation (with similar national statistics for Canada and Mexico). For technology direction and product-level context, sources such as IEEE and peer-reviewed electrochemistry and materials journals were used where they helped explain chemistry shifts and typical performance ranges.
In parallel, we reviewed company filings, investor presentations, and credible trade-association updates to understand capacity adds, localization plans, and application mix changes in North America. Where needed, paid subscriptions were used in a limited way for company financials and intelligence, patent lookups, and shipment-level import and export checks, so that publicly visible trends could be translated into practical sizing inputs. The desk sources listed here are illustrative only, and other public and paid references were also used for cross-checks and clarification during the study.
Primary Interviews and Surveys
Primary work was used to confirm what desk signals could not fully explain, especially around price movement, chemistry substitution, and which applications were scaling in the region. We spoke with a mix of manufacturers, distributors, integrators, and large end users, and the discussions were balanced across the United States, Canada, and Mexico so regional differences in regulations, production footprints, and demand timing were reflected in the final model.
Distribution of primary research fieldwork respondents
| Company type | Respondent position |
|---|---|
| Top tier: 25% | CXOs: 12% |
| Mid tier: 56% | Functional/Unit leaders: 36% |
| Smaller Players: 19% | Managers: 52% |
Market-Sizing & Forecasting
Sizing starts with a top-down build that reconstructs the addressable demand pool by application in North America, and then allocates that demand across battery types and chemistries based on adoption and replacement cycles. The totals are corroborated with selective bottom-up approximations, such as sampled average selling price (ASP) ranges by chemistry, channel checks on high-volume applications, and a limited roll-up of supplier revenues where disclosures are available.
Key inputs used in the model include EV and hybrid production and sales direction, stationary energy storage deployment indicators, lead-acid replacement intensity in SLI and industrial uses, import and export movements for key battery categories, and observed ASP progression for major chemistries as scale improves. Where data is uneven, for example for smaller niche chemistries or mixed-use industrial categories, gaps are handled through conservative penetration assumptions that are pressure-tested in interviews, followed by adjustments so the implied volumes and pricing remain realistic.
For forecasting, scenario analysis is applied around two drivers that shift the most in this market, transport electrification pace and grid storage build-out. The path is then smoothed using trend-based methods when short-term spikes appear. Assumptions on chemistry mix, localization timing, and price compression are reviewed with industry participants so the forecast stays practical and explainable.
Data Validation & Update Cycle
Validation is done in multiple steps so the final numbers do not rely on one data series or one interview set. Analysts compare the model outputs against independent signals such as trade flows, announced capacity and commissioning timelines, and application-level demand indicators, and then investigate any large variances before sign-off.
If a mismatch is found, we re-check definitions, re-run sensitivity on key price and adoption inputs, and re-contact select respondents to confirm whether the change is real or just a timing issue. Reports are refreshed annually, and interim updates are made when material events occur that can move pricing, supply, or demand. Before delivery, an analyst performs a fresh pass on the core assumptions so clients receive the latest updated view.
Mordor Intelligence's North America Battery Market Market Size Versus Other Published Estimates
Published market sizes for batteries in North America often do not match because groups draw the market boundary in different ways and then apply different price and volume assumptions. Differences also show up when some estimates focus only on rechargeable systems, or when the country coverage is limited to only the largest two markets.
By tracking application-level demand signals and refreshing key ASP assumptions by chemistry, Mordor Intelligence keeps the North America battery estimate tied to end-use adoption and replacement cycles across the United States, Canada, and Mexico, rather than relying mainly on capacity announcements or a narrow country cut.
Benchmark comparison
| Source | Market Size | Gaps in Research Methodology |
|---|---|---|
| Mordor Intelligence | USD 38.90 B (2026) | |
| Industry Publisher A | USD 40.00 B (2025) | Uses a different base year and country set (focused on the United States and Canada), and the scope typically groups applications more broadly, which can shift the implied mix and pricing when scaled to the full region. |
| Regional Consultancy B | USD 39.00 B (2025) | Starts from a different base year framework and may apply a higher growth stance across emerging end uses, which can lift the near-term run rate if chemistry transitions and price declines are assumed to happen faster. |
The spread across the three values mainly comes from base-year choice, which countries are counted as North America, and how quickly pricing is expected to fall as mix shifts toward lithium-ion. When the scope is kept consistent and the price and adoption levers are checked against observable demand indicators, the market size becomes easier to reproduce and explain.
Key Questions Answered in the Report
How large is the North America battery market in 2026?
The market is estimated at USD 38.90 billion in 2026.
Which battery type is growing fastest?
Secondary rechargeable batteries are expanding at a 15.5% CAGR through 2031 thanks to soaring EV and stationary-storage demand.
What technology will disrupt lithium-ion dominance?
Solid-state cells are poised for the highest growth, with pilot lines moving toward commercial production by 2028.
Why is Mexico attracting battery investments?
Nearshoring incentives under USMCA, lower labor costs, and proximity to U.S. vehicle plants underpin Mexico's 28.6% CAGR through 2031.
What is the main supply-chain bottleneck today?
Separator-film and copper-foil shortages delay gigafactory ramps, extending lead times and forcing continued reliance on Asian suppliers.
How are pack costs expected to change?
Section 45X manufacturing credits and economies of scale are projected to drive a 40% drop in pack costs between 2022 and 2027.